
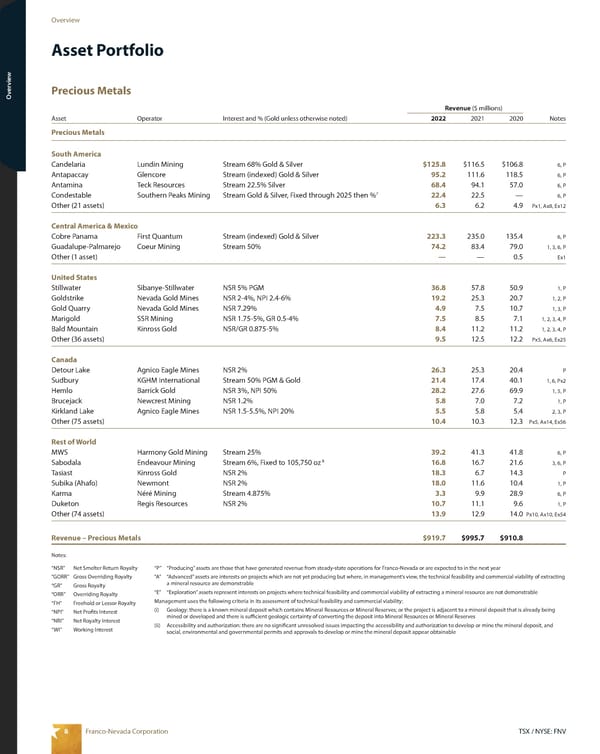
8 TSX / NYSE: FNV Franco-Nevada Corporation Overview Overview Asset Portfolio Precious Metals “NSR” Net Smelter Return Royalty “GORR” Gross Overriding Royalty “GR” Gross Royalty “ORR” Overriding Royalty “FH” Freehold or Lessor Royalty “NPI” Net Profits Interest “NRI” Net Royalty Interest “WI” Working Interest “P” “Producing” assets are those that have generated revenue from steady-state operations for Franco - Nevada or are expected to in the next year “A” “Advanced” assets are interests on projects which are not yet producing but where, in management’s view, the technical feasibility and commercial viability of extracting a mineral resource are demonstrable “E” “Exploration” assets represent interests on projects where technical feasibility and commercial viability of extracting a mineral resource are not demonstrable Management uses the following criteria in its assessment of technical feasibility and commercial viability: (i) Geology: there is a known mineral deposit which contains Mineral Resources or Mineral Reserves; or the project is adjacent to a mineral deposit that is already being mined or developed and there is sufficient geologic certainty of converting the deposit into Mineral Resources or Mineral Reserves (ii) Accessibility and authorization: there are no significant unresolved issues impacting the accessibility and authorization to develop or mine the mineral deposit, and social, environmental and governmental permits and approvals to develop or mine the mineral deposit appear obtainable Revenue ($ millions) Asset Operator Interest and % (Gold unless otherwise noted) 2022 2021 2020 Notes Precious Metals South America Candelaria Lundin Mining Stream 68% Gold & Silver $125.8 $116.5 $106.8 6, P Antapaccay Glencore Stream (indexed) Gold & Silver 95.2 111.6 118.5 6, P Antamina Teck Resources Stream 22.5% Silver 68.4 94.1 57.0 6, P Condestable Southern Peaks Mining Stream Gold & Silver, Fixed through 2025 then % 7 22.4 22.5 — 6, P Other (21 assets) 6.3 6.2 4.9 Px1, Ax8, Ex12 Central America & Mexico Cobre Panama First Quantum Stream (indexed) Gold & Silver 223.3 235.0 135.4 6, P Guadalupe-Palmarejo Coeur Mining Stream 50% 74.2 83.4 79.0 1, 3, 6, P Other (1 asset) — — 0.5 Ex1 United States Stillwater Sibanye-Stillwater NSR 5% PGM 36.8 57.8 50.9 1, P Goldstrike Nevada Gold Mines NSR 2-4%, NPI 2.4-6% 19.2 25.3 20.7 1, 2, P Gold Quarry Nevada Gold Mines NSR 7.29% 4.9 7.5 10.7 1, 3, P Marigold SSR Mining NSR 1.75-5%, GR 0.5-4% 7.5 8.5 7.1 1, 2, 3, 4, P Bald Mountain Kinross Gold NSR/GR 0.875-5% 8.4 11.2 11.2 1, 2, 3, 4, P Other (36 assets) 9.5 12.5 12.2 Px5, Ax6, Ex25 Canada Detour Lake Agnico Eagle Mines NSR 2% 26.3 25.3 20.4 P Sudbury KGHM International Stream 50% PGM & Gold 21.4 17.4 40.1 1, 6, Px2 Hemlo Barrick Gold NSR 3%, NPI 50% 28.2 27.6 69.9 1, 5, P Brucejack Newcrest Mining NSR 1.2% 5.8 7.0 7.2 1, P Kirkland Lake Agnico Eagle Mines NSR 1.5-5.5%, NPI 20% 5.5 5.8 5.4 2, 3, P Other (75 assets) 10.4 10.3 12.3 Px5, Ax14, Ex56 Rest of World MWS Harmony Gold Mining Stream 25% 39.2 41.3 41.8 6, P Sabodala Endeavour Mining Stream 6%, Fixed to 105,750 oz 8 16.8 16.7 21.6 3, 6, P Tasiast Kinross Gold NSR 2% 18.3 6.7 14.3 P Subika (Ahafo) Newmont NSR 2% 18.0 11.6 10.4 1, P Karma Néré Mining Stream 4.875% 3.3 9.9 28.9 6, P Duketon Regis Resources NSR 2% 10.7 11.1 9.6 1, P Other (74 assets) 13.9 12.9 14.0 Px10, Ax10, Ex54 Revenue – Precious Metals $919.7 $995.7 $910.8 Notes:
 2023 Asset Handbook Page 9 Page 11