
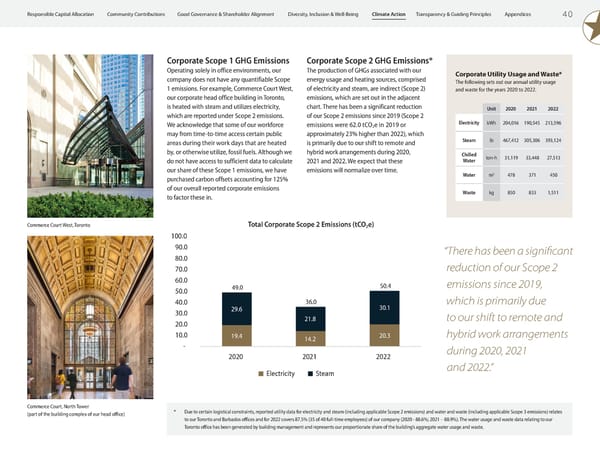
4 0 Appendices Transparency & Guiding Principles Climate Action Diversity, Inclusion & Well-Being Good Governance & Shareholder Alignment Community Contributions Responsible Capital Allocation Corporate Scope 1 GHG Emissions Operating solely in office environments, our company does not have any quantifiable Scope 1 emissions. For example, Commerce Court West, our corporate head office building in Toronto, is heated with steam and utilizes electricity, which are reported under Scope 2 emissions. We acknowledge that some of our workforce may from time-to-time access certain public areas during their work days that are heated by, or otherwise utilize, fossil fuels. Although we do not have access to sufficient data to calculate our share of these Scope 1 emissions, we have purchased carbon offsets accounting for 125% of our overall reported corporate emissions to factor these in. Corporate Scope 2 GHG Emissions* The production of GHGs associated with our energy usage and heating sources, comprised of electricity and steam, are indirect (Scope 2) emissions, which are set out in the adjacent chart. There has been a significant reduction of our Scope 2 emissions since 2019 (Scope 2 emissions were 62.0 tCO 2 e in 2019 or approximately 23% higher than 2022), which is primarily due to our shift to remote and hybrid work arrangements during 2020, 2021 and 2022. We expect that these emissions will normalize over time. 19.4 14.2 20.3 29.6 21.8 30.1 49.0 36.0 50.4 - 10.0 20.0 30.0 40.0 50.0 60.0 70.0 80.0 90.0 100.0 2020 2021 2022 Electricity Steam 8.8 8.7 28.9 11.5 37.7 20.2 - 10.0 20.0 30.0 40.0 50.0 60.0 70.0 80.0 90.0 100.0 2020 2021 Employee Commuting - Car 6.0 7.0 0.1 14.1 14.0 16.0 * Due to certain logistical constraints, reported utility data for electricity and steam (including applicable Scope 2 emissions) and water and waste (including applicable Scope 3 emissions) relates to our Toronto and Barbados offices and for 2022 covers 87.5% (35 of 40 full-time employees) of our company (2020 - 88.6%; 2021 – 88.9%). The water usage and waste data relating to our Toronto office has been generated by building management and represents our proportionate share of the building’s aggregate water usage and waste. Corporate Utility Usage and Waste* The following sets out our annual utility usage and waste for the years 2020 to 2022. Unit 2020 2021 2022 Electricity kWh 204,016 190,545 213,596 Steam lb 467,412 305,306 393,124 Chilled Water ton-h 31,119 33,448 27,513 Water m 3 478 371 450 Waste kg 850 833 1,511 “There has been a significant reduction of our Scope 2 emissions since 2019, which is primarily due to our shift to remote and hybrid work arrangements during 2020, 2021 and 2022.” Commerce Court West, Toronto Commerce Court, North Tower (part of the building complex of our head office) Total Corporate Scope 2 Emissions (tCO 2 e)
 ESG Report 2023 Page 41 Page 43