
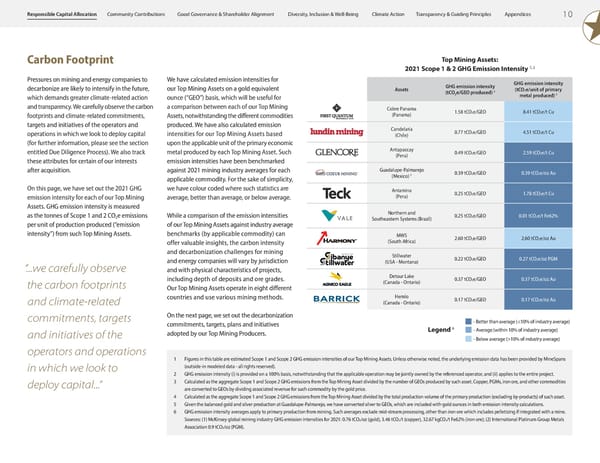
1 0 Appendices Transparency & Guiding Principles Climate Action Diversity, Inclusion & Well-Being Good Governance & Shareholder Alignment Community Contributions Responsible Capital Allocation Carbon Footprint Pressures on mining and energy companies to decarbonize are likely to intensify in the future, which demands greater climate-related action and transparency. We carefully observe the carbon footprints and climate-related commitments, targets and initiatives of the operators and operations in which we look to deploy capital (for further information, please see the section entitled Due Diligence Process). We also track these attributes for certain of our interests after acquisition. On this page, we have set out the 2021 GHG emission intensity for each of our Top Mining Assets. GHG emission intensity is measured as the tonnes of Scope 1 and 2 CO 2 e emissions per unit of production produced (“emission intensity”) from such Top Mining Assets. We have calculated emission intensities for our Top Mining Assets on a gold equivalent ounce (“GEO”) basis, which will be useful for a comparison between each of our Top Mining Assets, notwithstanding the different commodities produced. We have also calculated emission intensities for our Top Mining Assets based upon the applicable unit of the primary economic metal produced by each Top Mining Asset. Such emission intensities have been benchmarked against 2021 mining industry averages for each applicable commodity. For the sake of simplicity, we have colour coded where such statistics are average, better than average, or below average. While a comparison of the emission intensities of our Top Mining Assets against industry average benchmarks (by applicable commodity) can offer valuable insights, the carbon intensity and decarbonization challenges for mining and energy companies will vary by jurisdiction and with physical characteristics of projects, including depth of deposits and ore grades. Our Top Mining Assets operate in eight different countries and use various mining methods. On the next page, we set out the decarbonization commitments, targets, plans and initiatives adopted by our Top Mining Producers. “...we carefully observe the carbon footprints and climate-related commitments, targets and initiatives of the operators and operations in which we look to deploy capital...” 1 Figures in this table are estimated Scope 1 and Scope 2 GHG emission intensities of our Top Mining Assets. Unless otherwise noted, the underlying emission data has been provided by MineSpans (outside-in modeled data - all rights reserved). 2 GHG emission intensity (i) is provided on a 100% basis, notwithstanding that the applicable operation may be jointly owned by the referenced operator, and (ii) applies to the entire project. 3 Calculated as the aggregate Scope 1 and Scope 2 GHG emissions from the Top Mining Asset divided by the number of GEOs produced by such asset. Copper, PGMs, iron ore, and other commodities are converted to GEOs by dividing associated revenue for such commodity by the gold price. 4 Calculated as the aggregate Scope 1 and Scope 2 GHG emissions from the Top Mining Asset divided by the total production volume of the primary production (excluding by-products) of such asset. 5 Given the balanced gold and silver production at Guadalupe-Palmarejo, we have converted silver to GEOs, which are included with gold ounces in both emission intensity calculations. 6 GHG emission intensity averages apply to primary production from mining. Such averages exclude mid-stream processing, other than iron ore which includes pelletizing if integrated with a mine. Sources: (1) McKinsey global mining industry GHG emission intensities for 2021: 0.76 tCO 2 /oz (gold), 3.46 tCO 2 /t (copper), 32.67 kgCO 2 /t Fe62% (iron ore); (2) International Platinum Group Metals Association 0.9 tCO 2 /oz (PGM). Top Mining Assets: 2021 Scope 1 & 2 GHG Emission Intensity 1, 2 Assets GHG emission intensity (tCO 2 e/GEO produced) 3 GHG emission intensity (tCO 2 e/unit of primary metal produced) 4 Cobre Panama (Panama) 1.58 tCO 2 e/GEO 8.41 tCO 2 e/t Cu Candelaria (Chile) 0.77 tCO 2 e/GEO 4.51 tCO 2 e/t Cu Antapaccay (Peru) 0.49 tCO 2 e/GEO 2.59 tCO 2 e/t Cu Guadalupe-Palmarejo (Mexico) 5 0.39 tCO 2 e/GEO 0.39 tCO 2 e/oz Au Antamina (Peru) 0.25 tCO 2 e/GEO 1.78 tCO 2 e/t Cu Northern and Southeastern Systems (Brazil) 0.25 tCO 2 e/GEO 0.01 tCO 2 e/t Fe62% MWS (South Africa) 2.60 tCO 2 e/GEO 2.60 tCO 2 e/oz Au Stillwater (USA - Montana) 0.22 tCO 2 e/GEO 0.27 tCO 2 e/oz PGM Detour Lake (Canada - Ontario) 0.37 tCO 2 e/GEO 0.37 tCO 2 e/oz Au Hemlo (Canada - Ontario) 0.17 tCO 2 e/GEO 0.17 tCO 2 e/oz Au Legend 6 - Better than average (<10% of industry average) - Average (within 10% of industry average) - Below average (>10% of industry average)
 ESG Report 2023 Page 11 Page 13