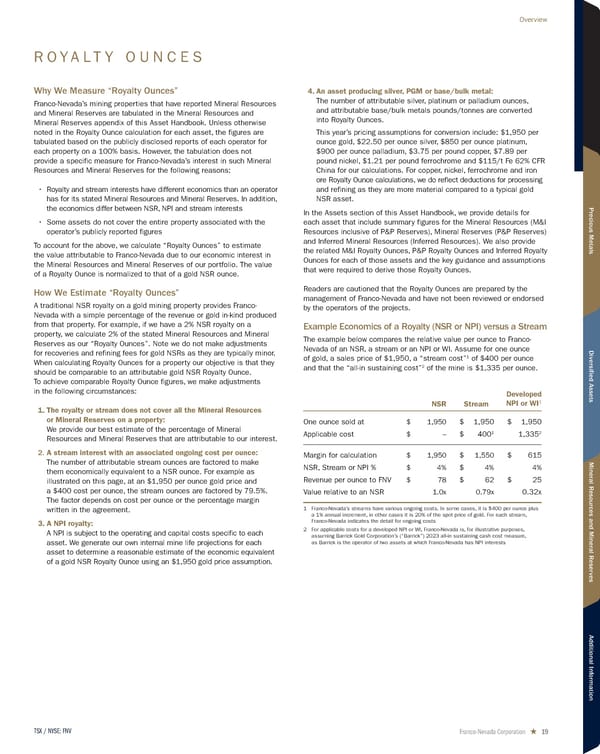
Overview ROYALTY OUNCES Why We Measure “Royalty Ounces” 4. An asset producing silver, PGM or base/bulk metal: Franco-Nevada’s mining properties that have reported Mineral Resources The number of attributable silver, platinum or palladium ounces, and Mineral Reserves are tabulated in the Mineral Resources and and attributable base/bulk metals pounds/tonnes are converted into Royalty Ounces. Mineral Reserves appendix of this Asset Handbook. Unless otherwise noted in the Royalty Ounce calculation for each asset, the figures are This year’s pricing assumptions for conversion include: $1,950 per tabulated based on the publicly disclosed reports of each operator for ounce gold, $22.50 per ounce silver, $850 per ounce platinum, each property on a 100% basis. However, the tabulation does not $900 per ounce palladium, $3.75 per pound copper, $7.89 per provide a specific measure for Franco-Nevada’s interest in such Mineral pound nickel, $1.21 per pound ferrochrome and $115/t Fe 62% CFR Resources and Mineral Reserves for the following reasons: China for our calculations. For copper, nickel, ferrochrome and iron ore Royalty Ounce calculations, we do reflect deductions for processing • Royalty and stream interests have different economics than an operator and refining as they are more material compared to a typical gold has for its stated Mineral Resources and Mineral Reserves. In addition, NSR asset. the economics differ between NSR, NPI and stream interests In the Assets section of this Asset Handbook, we provide details for Precious Metals • Some assets do not cover the entire property associated with the each asset that include summary figures for the Mineral Resources (M&I operator’s publicly reported figures Resources inclusive of P&P Reserves), Mineral Reserves (P&P Reserves) To account for the above, we calculate “Royalty Ounces” to estimate and Inferred Mineral Resources (Inferred Resources). We also provide the value attributable to Franco-Nevada due to our economic interest in the related M&I Royalty Ounces, P&P Royalty Ounces and Inferred Royalty the Mineral Resources and Mineral Reserves of our portfolio. The value Ounces for each of those assets and the key guidance and assumptions of a Royalty Ounce is normalized to that of a gold NSR ounce. that were required to derive those Royalty Ounces. How We Estimate “Royalty Ounces” Readers are cautioned that the Royalty Ounces are prepared by the management of Franco-Nevada and have not been reviewed or endorsed A traditional NSR royalty on a gold mining property provides Franco- by the operators of the projects. Nevada with a simple percentage of the revenue or gold in-kind produced from that property. For example, if we have a 2% NSR royalty on a Example Economics of a Royalty (NSR or NPI) versus a Stream property, we calculate 2% of the stated Mineral Resources and Mineral The example below compares the relative value per ounce to Franco- Reserves as our “Royalty Ounces”. Note we do not make adjustments for recoveries and refining fees for gold NSRs as they are typically minor. Nevada of an NSR, a stream or an NPI or WI. Assume for one ounce Diver 1 When calculating Royalty Ounces for a property our objective is that they of gold, a sales price of $1,950, a “stream cost” of $400 per ounce 2 sified Assets should be comparable to an attributable gold NSR Royalty Ounce. and that the “all-in sustaining cost” of the mine is $1,335 per ounce. To achieve comparable Royalty Ounce figures, we make adjustments in the following circumstances: Developed 1 NSR Stream NPI or WI 1. The royalty or stream does not cover all the Mineral Resources or Mineral Reserves on a property: One ounce sold at $ 1,950 $ 1,950 $ 1,950 We provide our best estimate of the percentage of Mineral $ – 1 2 Resources and Mineral Reserves that are attributable to our interest. Applicable cost $ 400 1,335 2. A stream interest with an associated ongoing cost per ounce: Margin for calculation $ 1,950 $ 1,550 $ 615 The number of attributable stream ounces are factored to make NSR, Stream or NPI % $ 4% $ 4% 4% Mineral Resources and Mineral Reser them economically equivalent to a NSR ounce. For example as illustrated on this page, at an $1,950 per ounce gold price and Revenue per ounce to FNV $ 78 $ 62 $ 25 a $400 cost per ounce, the stream ounces are factored by 79.5%. Value relative to an NSR 1.0x 0.79x 0.32x The factor depends on cost per ounce or the percentage margin written in the agreement. 1 Franco-Nevada’s streams have various ongoing costs. In some cases, it is $400 per ounce plus a 1% annual increment, in other cases it is 20% of the spot price of gold. For each stream, 3. A NPI royalty: Franco-Nevada indicates the detail for ongoing costs A NPI is subject to the operating and capital costs specific to each 2 For applicable costs for a developed NPI or WI, Franco-Nevada is, for illustrative purposes, assuming Barrick Gold Corporation’s (“Barrick”) 2023 all-in sustaining cash cost measure, asset. We generate our own internal mine life projections for each as Barrick is the operator of two assets at which Franco-Nevada has NPI interests asset to determine a reasonable estimate of the economic equivalent of a gold NSR Royalty Ounce using an $1,950 gold price assumption. ves Additional Inf or mation TSX / NYSE: FNV Franco-Nevada Corporation ★ 19
 2024 Asset Handbook Page 18 Page 20