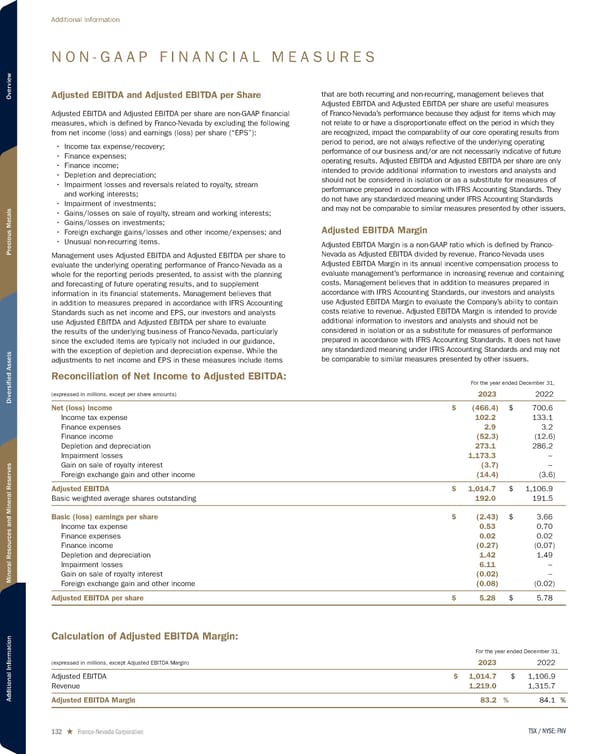
N O N - G A A P F I N A N C I A L M E A S U R E S Adjusted EBITDA and Adjusted EBITDA per Share Adjusted EBITDA and Adjusted EBITDA per share are non-GAAP financial measures, which is defined by Franco-Nevada by excluding the following from net income (loss) and earnings (loss) per share (“EPS”): • Income tax expense/recovery; • Finance expenses; • Finance income; • Depletion and depreciation; • Impairment losses and reversals related to royalty, stream and working interests; • Impairment of investments; • Gains/losses on sale of royalty, stream and working interests; • Gains/losses on investments; • Foreign exchange gains/losses and other income/expenses; and • Unusual non-recurring items. Management uses Adjusted EBITDA and Adjusted EBITDA per share to evaluate the underlying operating performance of Franco-Nevada as a whole for the reporting periods presented, to assist with the planning and forecasting of future operating results, and to supplement information in its financial statements. Management believes that in addition to measures prepared in accordance with IFRS Accounting Standards such as net income and EPS, our investors and analysts use Adjusted EBITDA and Adjusted EBITDA per share to evaluate the results of the underlying business of Franco-Nevada, particularly since the excluded items are typically not included in our guidance, with the exception of depletion and depreciation expense. While the adjustments to net income and EPS in these measures include items that are both recurring and non-recurring, management believes that Adjusted EBITDA and Adjusted EBITDA per share are useful measures of Franco-Nevada’s performance because they adjust for items which may not relate to or have a disproportionate effect on the period in which they are recognized, impact the comparability of our core operating results from period to period, are not always reflective of the underlying operating performance of our business and/or are not necessarily indicative of future operating results. Adjusted EBITDA and Adjusted EBITDA per share are only intended to provide additional information to investors and analysts and should not be considered in isolation or as a substitute for measures of performance prepared in accordance with IFRS Accounting Standards. They do not have any standardized meaning under IFRS Accounting Standards and may not be comparable to similar measures presented by other issuers. Adjusted EBITDA Margin Adjusted EBITDA Margin is a non-GAAP ratio which is defined by Franco- Nevada as Adjusted EBITDA divided by revenue. Franco-Nevada uses Adjusted EBITDA Margin in its annual incentive compensation process to evaluate management’s performance in increasing revenue and containing costs. Management believes that in addition to measures prepared in accordance with IFRS Accounting Standards, our investors and analysts use Adjusted EBITDA Margin to evaluate the Company’s ability to contain costs relative to revenue. Adjusted EBITDA Margin is intended to provide additional information to investors and analysts and should not be considered in isolation or as a substitute for measures of performance prepared in accordance with IFRS Accounting Standards. It does not have any standardized meaning under IFRS Accounting Standards and may not be comparable to similar measures presented by other issuers. Reconciliation of Net Income to Adjusted EBITDA: (expressed in millions, except per share amounts) For the year ended December 31, 2023 2022 Net (loss) income $ (466.4) $ 700.6 Income tax expense 102.2 133.1 Finance expenses 2.9 3.2 Finance income (52.3) (12.6) Depletion and depreciation 273.1 286.2 Impairment losses 1,173.3 – Gain on sale of royalty interest (3.7) – Foreign exchange gain and other income (14.4) (3.6) Adjusted EBITDA $ 1,014.7 $ 1,106.9 Basic weighted average shares outstanding 192.0 191.5 Basic (loss) earnings per share $ (2.43) $ 3.66 Income tax expense 0.53 0.70 Finance expenses 0.02 0.02 Finance income (0.27) (0.07) Depletion and depreciation 1.42 1.49 Impairment losses 6.11 – Gain on sale of royalty interest (0.02) – Foreign exchange gain and other income (0.08) (0.02) Adjusted EBITDA per share $ 5.28 $ 5.78 Calculation of Adjusted EBITDA Margin: (expressed in millions, except Adjusted EBITDA Margin) For the year ended December 31, 2023 2022 Adjusted EBITDA $ 1,014.7 $ 1,106.9 Revenue 1,219.0 1,315.7 Adjusted EBITDA Margin 83.2 % 84.1 % TSX / NYSE: FNV 132 ★ Franco-Nevada Corporation Additional Information
 2024 Asset Handbook Page 131 Page 133