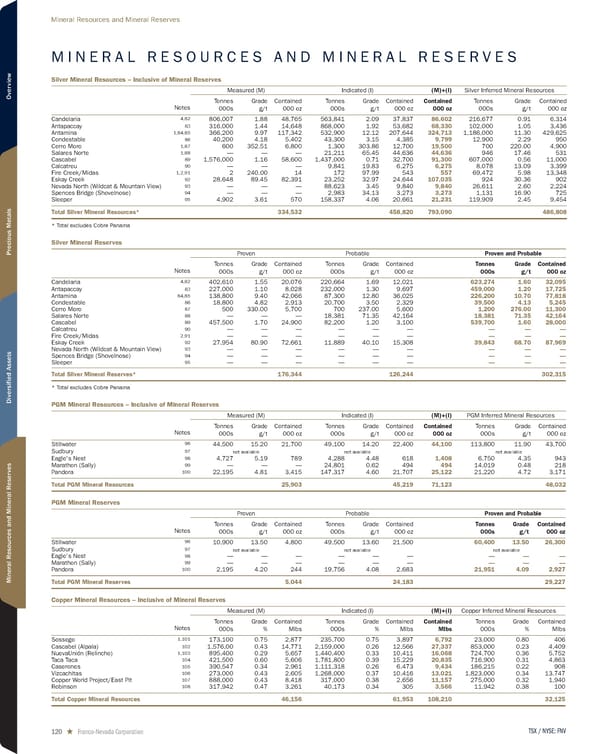
M I N E R A L R E S O U R C E S A N D M I N E R A L R E S E R V E S Silver Mineral Resources – Inclusive of Mineral Reserves Measured (M) Indicated (I) (M)+(I) Silver Inferred Mineral Resources Notes Tonnes 000s Grade g/t Contained 000 oz Tonnes 000s Grade g/t Contained 000 oz Contained 000 oz Tonnes 000s Grade g/t Contained 000 oz Candelaria 4,82 806,007 1.88 48,765 563,841 2.09 37,837 86,602 216,677 0.91 6,314 Antapaccay 83 316,000 1.44 14,648 868,000 1.92 53,682 68,330 102,000 1.05 3,436 Antamina 1,84,85 366,200 9.97 117,342 532,900 12.12 207,644 324,713 1,186,000 11.30 429,625 Condestable 86 40,200 4.18 5,402 43,300 3.15 4,385 9,799 12,900 2.29 950 Cerro Moro 1,87 600 352.51 6,800 1,300 303.86 12,700 19,500 700 220.00 4,900 Salares Norte 1,88 — — — 21,211 65.45 44,636 44,636 946 17.46 531 Cascabel 89 1,576,000 1.16 58,600 1,437,000 0.71 32,700 91,300 607,000 0.56 11,000 Calcatreu 90 — — — 9,841 19.83 6,275 6,275 8,078 13.09 3,399 Fire Creek/Midas 1,2,91 2 240.00 14 172 97.99 543 557 69,472 5.98 13,348 Eskay Creek 92 28,648 89.45 82,391 23,252 32.97 24,644 107,035 924 30.36 902 Nevada North (Wildcat & Mountain View) 93 — — — 88,623 3.45 9,840 9,840 26,611 2.60 2,224 Spences Bridge (Shovelnose) 94 — — — 2,983 34.13 3,273 3,273 1,131 16.90 725 Sleeper 95 4,902 3.61 570 158,337 4.06 20,661 21,231 119,909 2.45 9,454 Total Silver Mineral Resources* 334,532 458,820 793,090 486,808 * Total excludes Cobre Panama Silver Mineral Reserves Proven Probable Proven and Probable Notes Tonnes 000s Grade g/t Contained 000 oz Tonnes 000s Grade g/t Contained 000 oz Tonnes 000s Grade g/t Contained 000 oz Candelaria 4,82 402,610 1.55 20,076 220,664 1.69 12,021 623,274 1.60 32,095 Antapaccay 83 227,000 1.10 8,028 232,000 1.30 9,697 459,000 1.20 17,725 Antamina 84,85 138,800 9.40 42,066 87,300 12.80 36,025 226,200 10.70 77,818 Condestable 86 18,800 4.82 2,913 20,700 3.50 2,329 39,500 4.13 5,245 Cerro Moro 87 500 330.00 5,700 700 237.00 5,600 1,200 276.00 11,300 Salares Norte 88 — — — 18,381 71.35 42,164 18,381 71.35 42,164 Cascabel 89 457,500 1.70 24,900 82,200 1.20 3,100 539,700 1.60 28,000 Calcatreu 90 — — — — — — — — — Fire Creek/Midas 2,91 — — — — — — — — — Eskay Creek 92 27,954 80.90 72,661 11,889 40.10 15,308 39,843 68.70 87,969 Nevada North (Wildcat & Mountain View) 93 — — — — — — — — — Spences Bridge (Shovelnose) 94 — — — — — — — — — Sleeper 95 — — — — — — — — — Total Silver Mineral Reserves* 176,344 126,244 302,315 * Total excludes Cobre Panama PGM Mineral Resources – Inclusive of Mineral Reserves Measured (M) Indicated (I) (M)+(I) PGM Inferred Mineral Resources Notes Tonnes 000s Grade g/t Contained 000 oz Tonnes 000s Grade g/t Contained 000 oz Contained 000 oz Tonnes 000s Grade g/t Contained 000 oz Stillwater 96 44,500 15.20 21,700 49,100 14.20 22,400 44,100 113,800 11.90 43,700 Sudbury 97 not available not available not available Eagle's Nest 98 4,727 5.19 789 4,288 4.48 618 1,408 6,750 4.35 943 Marathon (Sally) 99 — — — 24,801 0.62 494 494 14,019 0.48 218 Pandora 100 22,195 4.81 3,415 147,317 4.60 21,707 25,122 21,220 4.72 3,171 Total PGM Mineral Resources 25,903 45,219 71,123 48,032 PGM Mineral Reserves Proven Probable Proven and Probable Notes Tonnes 000s Grade g/t Contained 000 oz Tonnes 000s Grade g/t Contained 000 oz Tonnes 000s Grade g/t Contained 000 oz Stillwater 96 10,900 13.50 4,800 49,500 13.60 21,500 60,400 13.50 26,300 Sudbury 97 not available not available not available Eagle's Nest 98 — — — — — — — — — Marathon (Sally) 99 — — — — — — — — — Pandora 100 2,195 4.20 244 19,756 4.08 2,683 21,951 4.09 2,927 Total PGM Mineral Reserves 5,044 24,183 29,227 Copper Mineral Resources – Inclusive of Mineral Reserves Measured (M) Indicated (I) (M)+(I) Copper Inferred Mineral Resources Notes Tonnes 000s Grade % Contained Mlbs Tonnes 000s Grade % Contained Mlbs Contained Mlbs Tonnes 000s Grade % Contained Mlbs Sossego 1,101 173,100 0.75 2,877 235,700 0.75 3,897 6,792 23,000 0.80 406 Cascabel (Alpala) 102 1,576,00 0.43 14,771 2,159,000 0.26 12,566 27,337 853,000 0.23 4,409 NuevaUnión (Relincho) 1,103 895,400 0.29 5,657 1,440,400 0.33 10,411 16,068 724,700 0.36 5,752 Taca Taca 104 421,500 0.60 5,606 1,781,800 0.39 15,229 20,835 716,900 0.31 4,863 Caserones 105 390,547 0.34 2,961 1,111,318 0.26 6,473 9,434 186,215 0.22 908 Vizcachitas 106 273,000 0.43 2,605 1,268,000 0.37 10,416 13,021 1,823,000 0.34 13,747 Copper World Project/East Pit 107 888,000 0.43 8,418 317,000 0.38 2,656 11,157 275,000 0.32 1,940 Robinson 108 317,942 0.47 3,261 40,173 0.34 305 3,566 11,942 0.38 100 Total Copper Mineral Resources 46,156 61,953 108,210 32,125 TSX / NYSE: FNV 120 ★ Franco-Nevada Corporation Mineral Resources and Mineral Reserves
 2024 Asset Handbook Page 119 Page 121