
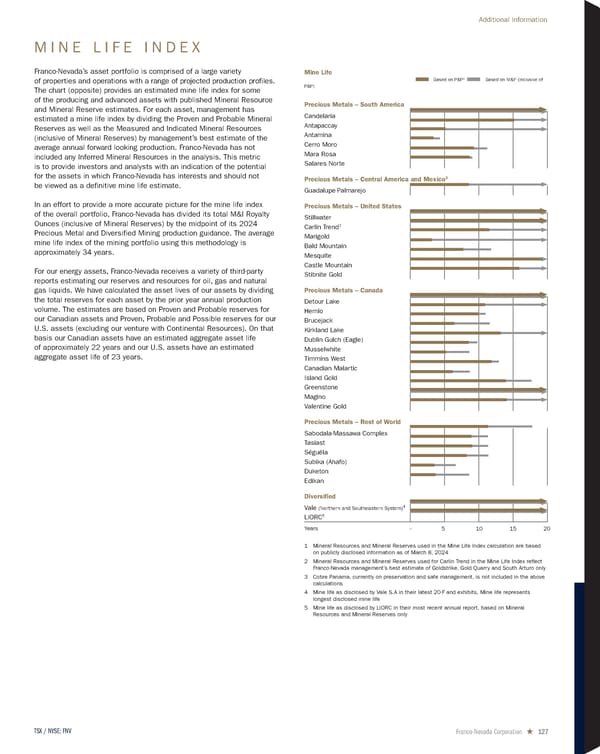
M I N E L I F E I N D E X Franco-Nevada’s asset portfolio is comprised of a large variety of properties and operations with a range of projected production profiles. The chart (opposite) provides an estimated mine life index for some of the producing and advanced assets with published Mineral Resource and Mineral Reserve estimates. For each asset, management has estimated a mine life index by dividing the Proven and Probable Mineral Reserves as well as the Measured and Indicated Mineral Resources (inclusive of Mineral Reserves) by management’s best estimate of the average annual forward looking production. Franco-Nevada has not included any Inferred Mineral Resources in the analysis. This metric is to provide investors and analysts with an indication of the potential for the assets in which Franco - Nevada has interests and should not be viewed as a definitive mine life estimate. In an effort to provide a more accurate picture for the mine life index of the overall portfolio, Franco-Nevada has divided its total M&I Royalty Ounces (inclusive of Mineral Reserves) by the midpoint of its 2024 Precious Metal and Diversified Mining production guidance. The average mine life index of the mining portfolio using this methodology is approximately 34 years. For our energy assets, Franco-Nevada receives a variety of third-party reports estimating our reserves and resources for oil, gas and natural gas liquids. We have calculated the asset lives of our assets by dividing the total reserves for each asset by the prior year annual production volume. The estimates are based on Proven and Probable reserves for our Canadian assets and Proven, Probable and Possible reserves for our U.S. assets (excluding our venture with Continental Resources). On that basis our Canadian assets have an estimated aggregate asset life of approximately 22 years and our U.S. assets have an estimated aggregate asset life of 23 years. 1 Mineral Resources and Mineral Reserves used in the Mine Life Index calculation are based on publicly disclosed information as of March 8, 2024 2 Mineral Resources and Mineral Reserves used for Carlin Trend in the Mine Life Index reflect Franco-Nevada management’s best estimate of Goldstrike, Gold Quarry and South Arturo only 3 Cobre Panama, currently on preservation and safe management, is not included in the above calculations 4 Mine life as disclosed by Vale S.A in their latest 20-F and exhibits. Mine life represents longest disclosed mine life 5 Mine life as disclosed by LIORC in their most recent annual report, based on Mineral Resources and Mineral Reserves only Mine Life Based on P&P 1 Based on M&I 1 (inclusive of P&P) Precious Metals – South America Candelaria Antapaccay Antamina Cerro Moro Mara Rosa Salares Norte Precious Metals – Central America and Mexico 3 Guadalupe-Palmarejo Precious Metals – United States Stillwater Carlin Trend 2 Marigold Bald Mountain Mesquite Castle Mountain Stibnite Gold Precious Metals – Canada Detour Lake Hemlo Brucejack Kirkland Lake Dublin Gulch (Eagle) Musselwhite Timmins West Canadian Malartic Island Gold Greenstone Magino Valentine Gold Precious Metals – Rest of World Sabodala-Massawa Complex Tasiast Séguéla Subika (Ahafo) Duketon Edikan Diversified Vale (Northern and Southeastern System) 4 LIORC 5 Years 5 – 15 20 10 Franco-Nevada Corporation ★ 127 TSX / NYSE: FNV Additional Information
 2024 Asset Handbook Page 126 Page 128