
2026 Asset Handbook
The Franco-Nevada 2026 Asset Handbook provides insights and details about their gold investment strategies and assets.
franco-nevada
FNV
franco-nevada corporation
franco-nevada stock
franco-nevada investor relations
annual report
asset handbook
asset handbook 2026
business model
dividend
revenue
franco-nevada revenue
franco-nevada cash flow
gold royalty company
precious metals streaming company
free cash flow business
mining
Hoyle Pond, Timmins, Ontario | Image Courtesy of the ROM (Royal Ontario Museum), Toronto, Canada. ©ROM A S S E T H A N D B O O K 2 0 2 6
Over view Hoyle Pond, Timmins, Ontario | Image Courtesy of the ROM (Royal Ontario Museum), Toronto, Canada. ©ROM Overview
D E A R S T A K E H O L D E R S Our ambition is to be the “Go-to Gold Stock” for generalist investors. We are proud that in the 18 years since our IPO our share price has appreciated 1,414%. The shareholder returns have compounded at an annual growth rate of approximately 17%, outperforming all relevant market indices, including the NASDAQ and S&P 500, and generating double the return from holding bullion over the period. We have increased annual dividends 19 consecutive times, taking the US$ dividend yield for our IPO shareholders to approximately 12%. The combination of strong production growth and rising gold prices in 2025 generated record revenues, cash flows and earnings. The growth in our portfolio came from recent acquisitions, in particular the gold and platinum stream on Sibanye’s Western Limb PGM operations, and from several new gold mines ramping up production. The strength of this performance allowed a 16% dividend increase in January 2026. 2025 was the second of two highly productive years for our business development team. Our team executed on US$1.8B in acquisitions, adding royalties on quality long-dated assets. The Côté Gold mine is set to be Canada’s third-largest gold mine, and we believe the Arthur Gold project will be the next great mine in Nevada. These and other additions over the last two years have positioned the company for sustained growth over the longer term. We have pursued a strategy of providing financial backing to strong teams with great assets. The financial packages provided to G Mining Ventures to construct Tocantinzinho and to Discovery Silver to acquire the Porcupine assets both included lead orders in their concurrent equity raises. The two companies have meaningfully outperformed their peers. The success of the companies we backed is by far the best endorsement of the royalty and stream financing model. Post year-end, we have supported three other strong management teams, providing royalty and stream financing to Orezone Gold to acquire the Casa Berardi Mine, i-80 Gold to develop its Nevada assets, and Minerals 260 to develop its Bullabulling deposit in Western Australia. While Cobre Panamá remains shuttered, the government’s environmental review is expected to be completed in May 2026, and President Mulino has stated he would like to reach a decision on the mine by this summer. In 2025, his government approved the shipment of the remaining concentrates and restarting the power plant. In April of this year, the Government approved the processing of previously stockpiled ore at the mine. We are optimistic that with the support of the Panamanian public, the mine will return to production. We aim to invest with operators that limit the environmental impact of their projects, to contribute positively to the communities where we invest, and to provide a great place to work for our employees. We are gratified that these efforts are reflected in the top-level ratings we receive from ESG rating agencies and are proud to have been selected as one of Corporate Knights’ Global 100 Most Sustainable Corporations for 2026. We expect year-over-year growth in GEOs from the portfolio in 2026, driven by new contributions from recent acquisitions and increased contributions from the ramp-up of new mines. Two potential catalysts in 2026 could cement further powerful, longer-term growth: a final investment decision on the Coroccohuayco project by Glencore would secure value from a material new project, and the restart of operations at Cobre Panamá would add 30% to our growth outlook assuming the mine has ramped up to full capacity. A broader-based driver is the injection of cash flow into operators, the availability of capital to developers, and the surge in exploration activity that accompanies higher gold and copper prices. The estimated more than US$250M set aside for exploration in 2026 on our Canadian assets alone is indicative of the amount of spending. It is in this environment that the upside optionality embedded in our portfolio of more than 300 development and exploration stage royalties really shines. David Harquail has served as a founder and CEO of Franco-Nevada since its IPO in 2007 and, from 2020 to date, as non-executive Chair of its Board of Directors. David will not be standing for re-election at our 2026 annual meeting. Under his leadership, Franco-Nevada has had an outstanding track record of creating value for its shareholders. David will be appointed Chair Emeritus following our 2026 annual meeting. The board intends to appoint Tom Albanese as the independent non-executive Chair of its Board of Directors at our 2026 Annual Meeting. Tom currently serves as the Lead Independent Director of Franco-Nevada. He is a seasoned mining executive, including prior CEO roles at both Rio Tinto plc and Vedanta Resources plc and many corporate director positions. We finished the year with no debt and US$3.1 billion of available capital. At current prices, we expect the business to generate approximately US$2.0 billion in cashflow from operations in 2026, allowing us to continue creating true shareholder value through disciplined growth. Thank you for your ongoing trust and support. David Harquail Paul Brink Chair of the Board President & CEO May 1, 2026 C O N T E N T S Overview Message to Stakeholders 5 Our Business Model 6 Diversified Portfolio 7 Global Assets 8 Asset Portfolio 10 Historical Performance 2008 to 2025 12 Sustainability Highlights 14 2026 Guidance 15 Five-Year Outlook to 2030 15 Growth Outlook 16 Long-Term Optionality 16 Gold at a Discount 17 Additional Exploration Optionality 17 Royalty Ounces 18 Royalty Ounces by Mineral Resources and Mineral Reserves 19 Mining Royalty Ounces 20 Mine Life Index 22 Mining Assets South & Central America 26 Canada 47 United States 75 Rest of World 91 Mining Exploration Assets 108 Energy Assets Energy Assets 114 Other Producing Energy Assets 122 Energy Exploration Assets 123 Mineral Resources and Mineral Reserves Gold Mineral Resources 126 Gold Mineral Reserves 128 Mineral Resources and Mineral Reserves 130 Additional Information Asset Counts 136 Acreage of Assets 137 Board of Directors 138 Executives 140 Corporate Organization 141 Non-GAAP Financial Measures 142 Technical and Third-Party Information 144 Forward-Looking Information 145 Glossary 146 Corporate Information 148 This Asset Handbook has not been prepared in connection with the sale of securities and is not an offering memorandum and should not be relied upon as such. This Asset Handbook does not constitute an offer to sell or a solicitation for an offer to purchase any security in any jurisdiction. Information relating to projects, properties and their owners and operators presented in this Asset Handbook has been sourced from the public disclosure of the owners and operators of our assets available as at March 12, 2026 (except where stated otherwise). More current information may become available in our subsequent disclosure and on our website. This Asset Handbook contains information about many of our assets, including those that may not currently be material to us. The description and depiction of our business and assets have been simplified for presentation purposes. Unless otherwise noted or the context otherwise indicates, the terms “Franco-Nevada”, “FNV”, “Company”, “Corporation”, “our” and “we” refer to Franco-Nevada Corporation and its subsidiaries. Dollar references are in U.S. dollars unless otherwise noted. This Asset Handbook should be read with reference to the explanatory notes and cautionary statements contained in the Additional Information section found at the end of this Asset Handbook. Please also refer to the additional supporting information and explanatory notes found in our most recent Annual Information Form as well as our most recent Management’s Discussion and Analysis available at www.sedarplus.com and our most recent Annual Report filed on Form 40-F available at www.sec.gov, and all of which are also available on our website at www.franco-nevada.com. This Asset Handbook complements, but does not form part of, nor is it incorporated by referenced in, such documents. David Harquail (left) and Paul Brink (right) TSX / NYSE: FNV Franco-Nevada Corporation ★ 5 4 ★ Franco-Nevada Corporation TSX / NYSE: FNV Overview Overview
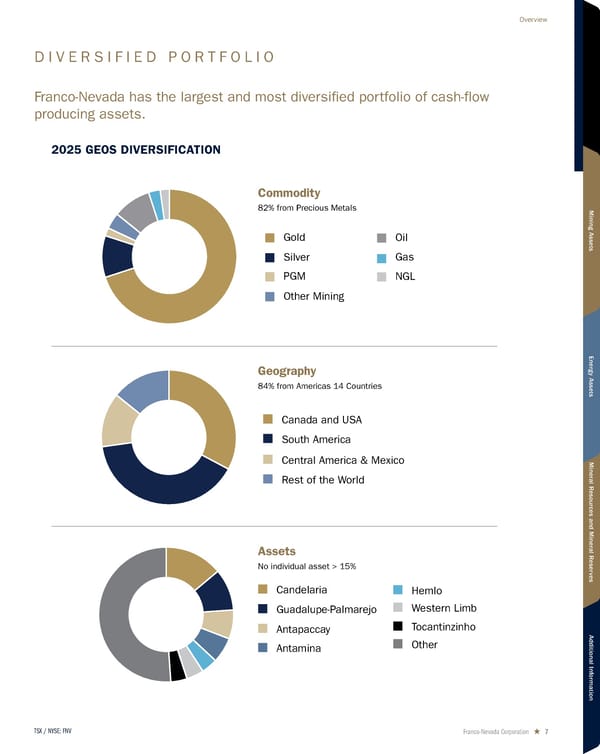
O U R B U S I N E S S M O D E L As a gold-focused royalty and streaming company, we do not operate mines, develop projects or conduct exploration. We have a unique business that is exposed to both the tremendous resource upside potential, or “optionality” of royalties on gold mines, development projects and exploration properties and the low risk, long life cash flows of precious metals streams on large copper mines. Both royalties and streams provide exposure to commodity prices, increases in production and future discoveries on the property. After our initial investment has been made, neither interest is subject to cash calls to fund exploration, development, capital, environmental or closure costs and so they are lower risk than an operating interest. Royalties Royalties are based on a percentage (often 1–2%) of the value of future production from a resource property and are typically created as exploration properties change hands or in exchange for providing capital. Often royalties are a percentage of the net value a mine operator receives for its product when it is processed at a smelter, hence the term “net smelter return” or “NSR” royalty. Other forms of royalties include profit-based royalties such as net profit interests or “NPI” based on the profit realized after deducting certain costs and gross margin royalties or “GMR” based on the gross revenue realized from the property after certain deductions. Royalty rights are often registered on the title of the property or mineral rights. Registered royalties have strong tenure and, in jurisdictions where recognized, will generally survive an operating company reorganization. Streams Streams have become a mainstream source of capital to mining companies most often to fund the construction of new projects. In particular, streaming precious metals by-product from large copper projects provides a very attractive cost of capital to project developers. Streams are metal purchase agreements where the streamer purchases all or a portion of the gold, silver or other products from a mine in exchange for an upfront payment and an additional payment on each delivery. While streams have similar exploration and price optionality to royalties, they differ from royalties in many respects including the ongoing cash payment required to purchase the physical metal. 1 Cobre Panamá currently on preservation and safe management, details on acreage of assets are provided on page 137 B U S I N E S S M O D E L A D V A N T A G E S Optionality Potential for exploration success on ~72,000 km 2 (1) Focus on Growth Management not occupied with operational decisions Free Cash Flow Business Not exposed to capital calls Diversified Portfolio Non-operating business is more scalable High Margins & Low Overhead Strong cash generation throughout the commodity cycle Limited Cost Inflations Streams/NSRs not exposed to cost inflation UPSIDE POTENTIAL LOW RISK D I V E R S I F I E D P O R T F O L I O Franco-Nevada has the largest and most diversified portfolio of cash-flow producing assets. Geography 84% from Americas 14 Countries 2025 GEOS DIVERSIFICATION Assets No individual asset > 15% Candelaria Western Limb Tocantinzinho Other Guadalupe-Pa Antamina Hemlo Antapaccay Canada and USA South America Central America & Mexico Rest of the World Gold NGL Other Mining Gas Silver PGM Oil Candelaria Western Limb Tocantinzinho Other Guadalupe-Palmarejo Antamina Hemlo Antapaccay Canada and USA South America Central America & Mexico Rest of the World Gold NGL Other Mining Gas Silver PGM Oil Candelaria Guadalupe-Palmarejo Antamina Antapaccay Canada and USA South America Central America & Mexico Gold Other Mining Silver PGM Canada and USA South America Central America & M Rest of the World Gold NGL Other Mining Gas Silver PGM Oil Gold NGL Other Mining Gas Silver PGM Oil Candela Western Tocantin Other Guadalu Antamin Hemlo Antapac Canada and USA South America Central America & Mexico Rest of the World Gold NGL Other Mining Gas Silver PGM Oil Candelaria Western Limb Tocantinzinho Other Guadalupe-Palmarejo Antamina Hemlo Antapaccay Canada and USA South America Central America & Mexico Rest of the World Gold NGL Other Mining Gas Silver PGM Oil Candelaria Western Limb Tocantinzinho Other Guadalupe-Palmarejo Antamina Hemlo Antapaccay Canada and USA South America Central America & Mexico Rest of the World Gold NGL Other Mining Gas Silver PGM Oil Commodity 82% from Precious Metals TSX / NYSE: FNV Franco-Nevada Corporation ★ 7 6 ★ Franco-Nevada Corporation TSX / NYSE: FNV Overview Overview Overview
Cobre Panamá Guadalupe-Palmarejo CentroGold (Gurupi) Cerro Moro Taca Taca NuevaUnión (Relincho) Antamina Salares Norte Antapaccay Candelaria Volcan Calcatreu Cascabel (Alpala) Condestable Vale N. System Vale S.E. System Sossego Posse (Mara Rosa) Franco-Nevada International Office Caserones Tocantinzinho Yanacocha El Alto Permian Basin Castle Mountain Mesquite Courageous Lake Weyburn Goldfields Monument Bay Canadian Malartic Nevada Ontario Stibnite Gold Cariboo SCOOP Orion Eagle Red Mountain STACK Franco-Nevada U.S. Office Marcellus Brucejack Valentine Gold Stillwater Haynesville Carol Lake Eskay Creek Sterling Robinson Bald Mountain Marigold EaglePicher Goldstrike Gold Quarry South Railroad South Arturo Nevada Copper Creek Island Gold Musselwhite Hemlo Greenstone Detour Lake Timmins West Sudbury Macassa (Kirkland Lake) Golden Highway Franco-Nevada Head Office Red Lake (McFinley) Magino Crawford Ring of Fire Ontario Porcupine Copper World Project Milpillas PSJ Cobre Mendocino Granite Creek Arthur Gold Archimedes Mineral Point Cove Casa Berardi Côté Gold Wawa Kerr-Addison Spences Bridge (Westhaven) Scottie Redstone (Coates Lake) Fenelon Martiniere Vizcachitas New Prosperity AurMac Midas Sleeper Lone Tree Global Assets Our Portfolio 445 Total 121 Producing 46 Advanced 278 Exploration Diversified Diversified Precious Metals Diversified Precious Metals Mt Keith Duketon Yandal (Bronzewing) Australia Subika (Ahafo) Tasiast Sabodala Edikan Perama Hill Kiziltepe Sissingué Pandora Franco-Nevada Australia Office Séguéla Wiluna South Kalgoorlie Only selected assets are shown on this map Asset count as of May 1, 2026 Cobre Panamá currently on preservation and safe management Details on acreage of assets are provided on page 137 Precious Metals Rogozna Rebecca Western Limb Bullabulling Aphrodite Agate Creek “ A diversified portfolio of 445 assets covering ~72,000 km 2 .” TSX / NYSE: FNV Franco-Nevada Corporation ★ 9 8 ★ Franco-Nevada Corporation TSX / NYSE: FNV Overview Overview Overview
A S S E T P O R T F O L I O Precious Metals A S S E T P O R T F O L I O Diversified Notes: “NSR” Net Smelter Return Royalty “GORR” Gross Overriding Royalty “GR” Gross Royalty “ORR” Overriding Royalty “FH” Freehold or Lessor Royalty “NPI” Net Profits Interest “NRI” Net Royalty Interest “GMR” Gross Margin Royalties “WI” Working Interest “P” “Producing” assets are those that have generated revenue from steady-state operations for Franco - Nevada or are expected to in the next year “A” “Advanced” assets are interests on projects which are not yet producing but where, in management’s view, the technical feasibility and commercial viability of extracting Mineral Resources are demonstrable “E” “Exploration” assets represent interests on projects where technical feasibility and commercial viability of extracting Mineral Resources are not demonstrable “Precious Metals” includes gold, silver, and PGM assets. “Diversified” includes iron ore, other mining and energy assets (which encompass oil, gas and natural gas liquids) Management uses the following criteria in its assessment of technical feasibility and commercial viability: (i) Geology: there is a known mineral deposit which contains Mineral Resources or Mineral Reserves; or the project is adjacent to a mineral deposit that is already being mined or developed and there is sufficient geologic certainty of converting the deposit into Mineral Resources or Mineral Reserves (ii) Accessibility and authorization: there are no significant unresolved issues impacting the accessibility and authorization to develop or mine the mineral deposit, and social, environmental and governmental permits and approvals to develop or mine the mineral deposit appear obtainable 1 Initial rates shown when agreements contain agreed reductions. Please refer to individual asset descriptions for further detail 2 Does not cover all the Mineral Resources or Mineral Reserves reported for the property by the operator 3 Percentage varies depending on the claim block of the property 4 Provides for minimum or advance payments 5 Percentage varies depending on the commodity price or value of ore 6 Payable after operator recovers defined exploration and development expenses 7 These revenue numbers are before the deduction of the purchase cost per ounce 8 8,760 oz Au & 291,000 oz Ag per year until December 2025; then, 63% Au & Ag until 87,600 oz Au & 2,910,000 oz Ag delivered, respectively; thereafter, 25% Au & Ag 9 Sabodala agreement was amended with an effective date of September 1, 2020 10 Net sales royalty attributable to FNV Royalty holding on certain properties and subject to certain thresholds. Copper/Gold rate applies to Sossego at 50% given its previous joint venture ownership 11 GORR and IOC equity interest attributable to FNV 9.9% equity ownership of Labrador Iron Ore Royalty Corporation 12 Cobre Panamá currently on preservation and safe management 13 Royalty deductions include cash operating costs and exclude all capital, exploration, depreciation and other non-cash costs Revenue ($ millions) Asset Operator Interest and % (Gold unless otherwise noted) 1 2025 2024 2023 Notes Precious Metals South America Candelaria Lundin Mining Stream 68% Gold & Silver $232.5 $163.1 $130.3 7, P Antapaccay Glencore Stream (indexed) Gold & Silver 163.9 131.0 120.1 7, P Antamina Teck Resources Stream 22.5% Silver 143.3 55.3 50.5 7, P Tocantinzinho G Mining Ventures Stream 12.5% 72.5 15.4 – 7, P Condestable Rio2 Stream Gold & Silver, Fixed through 2025 then % 8 44.6 29.9 23.7 7, P Yanacocha Newmont NSR 1.8% 32.6 7.5 – P Salares Norte Gold Fields NSR 1–2% 13.3 1.6 – 3, P Other (21 assets) 5.7 6.7 5.2 Px2, Ax5, Ex14 Central America & Mexico Guadalupe-Palmarejo Coeur Mining Stream 50% 177.3 84.8 66.8 2, 4, 7, P Cobre Panamá First Quantum Minerals Stream (indexed) Gold & Silver 38.3 0.1 248.9 7, 12, A Other (1 asset) – – – Ex1 Canada Hemlo Hemlo Mining NSR 3%, NPI 50% 51.7 16.4 22.7 2, 6, P Côté Gold IAMGOLD GMR 7.5% 50.5 – – 13, P Detour Lake Agnico Eagle Mines NSR 2% 49.0 31.9 25.9 P Porcupine Discovery Silver NSR 4.25% 28.2 – – 1, P Greenstone Equinox Gold NSR 3% 22.3 9.2 – P Macassa (Kirkland Lake) Agnico Eagle Mines NSR 1.5–5.5%, NPI 20% 16.2 10.0 6.3 3, 4, P Sudbury Magna Mining Stream 50% PGM & Gold 14.9 9.9 17.6 2, 7, Px2 Musselwhite Orla Mining NPI 5% 11.6 3.2 2.8 6, P Brucejack Newmont NSR 1.2% 9.8 7.2 5.9 2, P Magino Alamos Gold NSR 3% 9.7 5.6 1.3 P Other (77 assets) 11.6 8.7 9.8 Px4, Ax13, Ex60 United States South Arturo Nevada Gold Mines GR 4–9% 37.8 6.7 2.4 2, 4, 5, P Goldstrike Nevada Gold Mines NSR 2–4%, NPI 2.4–6% 22.8 19.4 13.1 2, 3, P Bald Mountain Kinross Gold NSR/GR 0.875–5% 20.6 16.8 11.7 2, 3, 4, 5, P Stillwater Sibanye Stillwater NSR 5% PGM 15.4 21.2 26.1 2, P Marigold SSR Mining NSR 1.75–5%, GR 0.5–4% 9.6 6.5 11.2 2, 3, 4, 5, P Gold Quarry Nevada Gold Mines NSR 7.29% 5.1 3.0 3.0 2, 4, P Other (49 assets) 6.7 4.9 4.5 Px4, Ax8, Ex37 Rest of World Western Limb Sibanye Stillwater Stream Gold (indexed) & 1% Platinum 70.3 – – 7, P Subika (Ahafo) Newmont NSR 2% 45.4 34.7 19.4 2, P Tasiast Kinross Gold NSR 2% 32.8 30.5 24.5 P Sabodala Endeavour Mining Stream 6%, Fixed to 105,750 oz 9 32.7 22.6 18.3 4, 7, P Duketon Regis Resources NSR 2% 10.6 10.5 12.0 2, P MWS Harmony Gold Mining Stream 25% – 55.9 50.4 7 Other (76 assets) 39.4 22.8 16.5 Px13, Ax10, Ex53 Revenue – Precious Metals $1,548.7 $853.0 $950.9 Revenue ($ millions) Asset Operator Interest and % 1 2025 2024 2023 Notes Diversified Vale Vale 0.264% Iron Ore, 0.367% Copper/Gold, 0.147% Other 10 $36.7 $36.7 $35.1 Px3, Ex1 LIORC Rio Tinto GORR 0.7% Iron Ore, IOC Equity 1.5% 11 7.0 13.8 12.1 P Other Mining (102 assets) 12.4 13.2 8.2 Px9, Ax9, Ex84 United States (Energy) Permian Basin Various Various Royalty Rates 43.9 45.4 47.6 Px2 SCOOP/STACK Various Various Royalty Rates 42.0 31.4 33.1 Px3 Marcellus Range Resources GORR 1% 30.5 26.9 28.0 P Haynesville Various Various Royalty Rates 29.8 21.0 26.0 Px2 Other (2 assets) 0.3 0.3 0.3 Px1, Ex1 Canada (Energy) Weyburn Unit Whitecap Resources NRI 11.71%, ORR 0.44%, WI 2.56% 36.9 44.6 50.1 Px3 Orion Strathcona Resources GORR 4% 12.1 14.0 13.6 P Other (69 assets) 8.3 9.4 9.0 Px42, Ex27 Revenue – Diversified $259.9 $251.7 $268.1 Revenue from Royalty, Stream and Working Interests $1,808.6 $1,104.7 $1,219.0 Interest revenue and other interest income $14.2 $8.9 $− Total Revenue $1,822.8 $1,113.6 $1,219.0 TSX / NYSE: FNV Franco-Nevada Corporation ★ 11 10 ★ Franco-Nevada Corporation TSX / NYSE: FNV Overview Overview Overview
H I S T O R I C A L P E R F O R M A N C E 2 0 0 8 T O 2 0 2 5 1 Starting in Q4 2021, revenue from Franco-Nevada’s Energy assets are included in the calculation of Gold Equivalent Ounces (“GEOs”). GEOs for comparative periods have been recalculated to conform with the current presentation. GEOs include Franco-Nevada’s attributable share of production from our Mining and Energy assets, after applicable recovery and payability factors. GEOs are estimated on a gross basis for NSR royalties and, in the case of stream ounces, before the payment of the per ounce contractual price paid by the Company. For NPI royalties, GEOs are calculated taking into account the NPI economics. Silver, platinum, palladium, iron ore, oil, gas and other commodities are converted to GEOs by dividing associated revenue, which includes settlement adjustments, by the relevant gold price. The price used in the computation of GEOs earned from a particular asset varies depending on the royalty or stream agreement, which may make reference to the market price realized by the operator, or the average price for the month, quarter, or year in which the commodity was produced or sold 2 Adjusted Net Income, Adjusted Net Income per share, Adjusted EBITDA, and Adjusted EBITDA per share are non-GAAP financial measures with no standardized meaning under International Financial Reporting Standards (“IFRS Accounting Standards”) and might not be comparable to similar financial measures disclosed by other issuers. Refer to the “Non-GAAP Financial Measures” section starting on page 142 of this Asset Handbook 3 Fiscal years 2010 through 2025 were prepared in accordance with IFRS Accounting Standards. Fiscal years 2008 and 2009 were prepared in accordance with Canadian GAAP. Comparative information has been adjusted to conform to current presentation 4 The Company defines Working Capital as current assets less current liabilities 5 As at December 31 REVENUE (US$ MILLIONS) OPERATING CASH FLOW (US$ MILLIONS) – $500 $1,000 $1,500 $2,000 '25 '24 '23 '22 '21 '20 '19 '18 '17 '16 '15 '14 '13 '12 '11 '10 '09 '08 MARKET CAPITALIZATION 5 (US$ BILLIONS) G&A (% OF CAPITALIZATION) ADJUSTED NET INCOME PER SHARE 2 (US$ PER SHARE) – $10 $20 $30 $40 $50 '25 '24 '23 '22 '21 '20 '19 '18 '17 '16 '15 '14 '13 '12 '11 '10 '09 '08 – 0.2% 0.4% 0.6% 0.8% 1.0% '25 '24 '23 '22 '21 '20 '19 '18 '17 '16 '15 '14 '13 '12 '11 '10 '09 '08 – $1.0 $2.0 $3.0 $4.0 $5.0 $6.0 '25 '24 '23 '22 '21 '20 '19 '18 '17 '16 '15 '14 '13 '12 '11 '10 '09 '08 ADJUSTED EBITDA (US$ MILLIONS) – $200 $400 $600 $800 $1,000 $1,200 $1,400 $1,600 '25 '24 '23 '22 '21 '20 '19 '18 '17 '16 '15 '14 '13 '12 '11 '10 '09 '08 – $400 $800 $1,200 $1,600 $2,000 '25 '24 '23 '22 '21 '20 '19 '18 '17 '16 '15 '14 '13 '12 '11 '10 '09 '08 (in millions, except GEOs, Total Shareholders’ Equity, Market Capitalization, and per share amounts) 2025 3 2024 3 2023 3 2022 3 2021 3 2020 3 2019 3 2018 3 2017 3 2016 3 2015 3 2014 3 2013 3 2012 3 2011 3 2010 3 2009 3 2008 3 GEOs 1 sold (000s) 519.1 463.3 627.0 730.0 728.2 573.3 598.4 516.6 537.7 488.5 384.5 351.6 290.4 254.7 260.6 185.4 158.2 167.8 Revenue $ 1,822.8 $ 1,113.6 $ 1,219.0 $ 1,315.7 $ 1,300.0 $ 1,020.2 $ 844.1 $ 653.2 $ 675.0 $ 610.2 $ 443.6 $ 442.4 $ 400.9 $ 427.0 $ 411.2 $ 227.2 $ 199.7 $ 151.0 Operating (Loss) Income $ 1,354.2 $ 726.6 $ (428.0) $ 820.7 $ 860.7 $ 336.5 $ 410.2 $ 188.8 $ 235.4 $ 155.4 $ 51.3 $ 155.8 $ 77.7 $ 146.7 $ 45.5 $ 87.3 $ 87.4 $ 38.1 Net (Loss) Income $ 1,112.1 $ 552.1 $ (466.4) $ 700.6 $ 733.7 $ 326.2 $ 344.1 $ 139.0 $ 194.7 $ 122.2 $ 24.6 $ 106.7 $ 11.7 $ 102.6 $ (6.8) $ 62.7 $ 80.9 $ 40.3 Basic (Loss) Earnings per share $ 5.77 $ 2.87 $ (2.43) $ 3.66 $ 3.84 $ 1.71 $ 1.83 $ 0.75 $ 1.06 $ 0.70 $ 0.16 $ 0.71 $ 0.08 $ 0.72 $ (0.05) $ 0.55 $ 0.76 $ 0.41 Adjusted Net Income 2 $ 1,075.2 $ 618.1 $ 683.1 $ 697.6 $ 673.6 $ 516.3 $ 341.5 $ 217.0 $ 198.3 $ 164.4 $ 88.9 $ 137.5 $ 138.3 $ 171.0 $ 136.0 $ 52.1 $ 32.0 $ 43.7 Adjusted Net Income2 per share $ 5.58 $ 3.21 $ 3.56 $ 3.64 $ 3.52 $ 2.71 $ 1.82 $ 1.17 $ 1.08 $ 0.94 $ 0.57 $ 0.91 $ 0.94 $ 1.19 $ 1.08 $ 0.46 $ 0.30 $ 0.48 Adjusted EBITDA 2 $ 1,656.1 $ 951.6 $ 1,014.7 $ 1,106.9 $ 1,092.3 $ 839.6 $ 673.4 $ 519.6 $ 516.1 $ 489.1 $ 337.1 $ 356.0 $ 319.9 $ 347.5 $ 327.3 $ 180.0 $ 119.4 $ 127.2 Adjusted EBITDA 2 per share $ 8.59 $ 4.95 $ 5.28 $ 5.78 $ 5.72 $ 4.41 $ 3.59 $ 2.79 $ 2.82 $ 2.79 $ 2.37 $ 2.18 $ 2.43 $ 2.61 $ 1.58 $ 1.12 $ 1.30 $ 2.15 Dividends declared (including DRIP) $ 293.8 $ 277.0 $ 262.1 $ 245.8 $ 221.4 $ 197.2 $ 187.0 $ 177.8 $ 167.9 $ 156.8 $ 129.0 $ 118.0 $ 104.4 $ 77.9 $ 49.2 $ 33.3 $ 28.2 $ 21.8 Dividends declared per share $ 1.52 $ 1.44 $ 1.36 $ 1.28 $ 1.16 $ 1.03 $ 0.99 $ 0.95 $ 0.91 $ 0.87 $ 0.83 $ 0.78 $ 0.72 $ 0.54 $ 0.32 $ 0.29 $ 0.28 $ 0.24 Working Capital 4 $ 898.4 $ 1,649.3 $ 1,576.1 $ 1,332.9 $ 708.2 $ 610.5 $ 225.3 $ 153.5 $ 593.8 $ 323.6 $ 253.9 $ 677.8 $ 861.2 $ 822.4 $ 851.1 $ 572.7 $ 530.7 $ 239.1 Debt $ Nil $ Nil $ Nil $ Nil $ Nil $ Nil $ 80.0 $ 207.6 $ Nil $ Nil $ 457.3 $ Nil $ Nil $ Nil $ Nil $ Nil $ Nil $ Nil Total Shareholders’ Equity $ 7.6B $ 6.0B $ 5.8B $ 6.4B $ 6.0B $ 5.4B $ 5.1B $ 4.6B $ 4.7B $ 4.1B $ 3.2B $ 3.4B $ 3.0B $ 3.1B $ 2.8B $ 2.0B $ 1.9B $ 1.4B Market Capitalization 5 $ 40.1B $ 22.6B $ 21.3B $ 26.1B $ 26.5B $ 23.9B $ 19.6B $ 13.1B $ 14.9B $ 10.7B $ 7.2B $ 7.7B $ 6.0B $ 8.3B $ 5.3B $ 3.8B $ 3.2B $ 1.7B TSX / NYSE: FNV Franco-Nevada Corporation ★ 13 12 ★ Franco-Nevada Corporation TSX / NYSE: FNV Overview Overview Overview
>50% of 5-year Growth is Already Under Construction 1 2026 Guidance and 2030 Outlook as published on March 10, 2026 in Franco-Nevada’s 2025 Annual Report. Assuming: $4,500/oz Au, $75.00/oz Ag, $2,000/oz Pt, $1,650/oz Pd, $100/tonne Fe 62% CFR China, $70/bbl WTI oil and $3.00/mcf Henry Hub natural gas 2 Expansion periods are based on operators’ indicated period of ramp-up Recent Operating Additions Casa Berardi 2026 Côté Gold 2026 i-80 2026 Porcupine 2026 Under Construction 3 Calcatreu 2026 Eskay Creek 2027 Stibnite Gold 2029 Recent Mine Starts Valentine Gold 2025 Expansions 2 Island Gold to 2026 Vale to 2026 Magino to 2028 Candelaria to 2028 Antapaccay/Coroccohuayco to 2028 Antamina 4 to 2028 Detour Lake to 2029 Marigold 5 to 2029 Feasibility Study 3 Cascabel 2029 Copper World Project 2029 Permitting 3 Rebecca 2026 Castle Mountain (Phase 2) 2029 PSJ Cobre Mendocino 2029 Taca Taca 2030 Pre-Feasibility Bullabulling 2026 2 0 2 6 G U I D A N C E Our guidance¹ is for total GEO sales of 510k–570k GEOs in 2026. Our Total GEOs are expected to range from 510–570 koz, with approximately 90% from Precious Metal assets and 10% from our Diversified assets. The anticipated increase in our Precious Metal GEOs reflects the first full year of contribution from Côté Gold, Porcupine, and Valentine Gold, the continued ramp-up of Salares Norte and Greenstone, and the recent acquisitions of the Casa Berardi stream and i-80 royalty. With respect to our Diversified revenue, the commodity breakdown is expected to be approximately 50% oil and liquids, 25% natural gas and 25% iron ore and other minerals. We have not assumed any contributions from Cobre Panamá in our 2026 guidance. As further discussed above, as of April 7, 2026, First Quantum received formal approval to process stockpiled ore, which is expected to produce approximately 70 kt of copper and result in stream deliveries to Franco-Nevada of approximately 23,100 oz of gold and 265 koz of silver. The timing of stream deliveries would depend on when formal approval is received. 3 Indicated mine start periods are based on operators’ guidance and FNV best estimates 4 Production growth is largely from accessing higher silver grade 5 Expansion is a combination of underlying production growth at the operation and mining on higher royalty rate ground F I V E - Y E A R O U T L O O K T O 2 0 3 0 For 2030, we expect total GEOs to range between 555k–615k GEOs through organic growth alone. Should Cobre Panamá return to production at capacity it could add 150k–175k GEOs per year. Our outlook assumes the start of production at Cascabel, Copper World, Eskay Creek, Stibnite Gold and Rebecca. It also reflects planned expansions at Detour Lake, Magino and Castle Mountain Phase 2, and the development of the Coroccohuayco project at Antapaccay. These production increases are expected to be partly offset by the step-down at Candelaria and Antapaccay, and a decrease in production at Subika (Ahafo South). For our Energy assets, we anticipate continued production growth at our Haynesville, SCOOP/STACK and Permian interests, and expect steady- state production from our Canadian assets. The expected timing of the various developments are shown in the table below. The outlook has a high level of confidence as more than half of the 5-year growth is already under construction. S U S T A I N A B I L I T Y H I G H L I G H T S Franco-Nevada’s 2026 Sustainability Report is available on our website. Highlights from the report are summarized below. Due diligence to invest in strong sustainability performers Our key sustainability - related areas of focus are outlined in our 2026 Sustainability Report and comprise six areas. These include health and safety, tailings management, communities and Indigenous Peoples, water management and risk, carbon footprint, and biodiversity. We have also evaluated operators’ sustainability - related performance primarily with reference to our top revenue - generating mining assets. Growing our community contributions and commitments Our community contributions continue to grow year - over - year, including renewed funding for initiatives in Peru and Brazil, as well as contributions to new initiatives in Mexico, Ecuador and Canada. We also remain committed to supporting mining industry groups and diversity initiatives. Strengthening our diverse representation and diversity initiatives In furtherance of our goal of attaining and maintaining diversity at the Board level on grounds broader than gender diversity, we welcomed a new diverse director to our Board in 2025. Following our 2026 annual meeting, our Board will be comprised of 44% diverse persons. Now in its fifth year, the Franco - Nevada Mining Industry Scholarship program, which has the objective of attracting diverse students to the sector, continues to expand, with four students receiving new scholarships in 2025, bringing the total number of active scholarships to 15. Supporting employee well - being, development and financial security We continue to support the physical and mental well - being, development and long - term financial security of our employees. Our approach includes maintaining flexible work arrangements, providing comprehensive health benefits and wellness allowances, offering opportunities for professional development and education, and supporting employee well - being through dedicated workplace facilities. Last year, we also implemented a pension plan for all Canadian employees helping them to plan for retirement and secure their financial future. Efforts toward our emissions reduction targets We have implemented emissions reduction targets for our corporate emissions in support of our aspiration to achieve net - zero emissions across our corporate operations by 2050 or sooner. 2025 represents our second year measuring performance against these targets. Our solar panel project for our Barbados office was operational for approximately half of the year, and early results indicate a meaningful reduction in reliance on grid - supplied energy at our office there. We continue to explore additional measures and programs to reduce our carbon footprint in furtherance of our near- and longer-term emissions reduction targets. Reporting financed emissions in our Scope 3 emissions As part of our ongoing climate - related disclosure, we report financed greenhouse gas emissions attributable to our royalty and stream interests within Scope 3, Category 15 (Investments). We also provide a concise overview of the Greenhouse Gas Protocol to support an understanding of the distinctions among Scope 1, Scope 2 and Scope 3 emissions. Managing corporate emissions Since 2020, emissions from our corporate operations have been managed through ongoing emissions reduction efforts and the purchase of carbon credits to address remaining emissions. Alignment of sustainability reporting with SASB, GRI and ISSB disclosure standards Our sustainability - related disclosure is aligned with leading reporting standards and frameworks, including the Sustainability Accounting Standards Board and the Global Reporting Initiative. Building on last year’s transition toward reporting aligned with the International Sustainability Standards Board’s IFRS Sustainability Disclosure Standards, we have updated our analysis of climate - related risks and opportunities and expanded related disclosure, including a refreshed scenario analysis. Initiatives aligned with the UN Sustainable Development Goals Initiatives across our business support a number of the United Nations Sustainable Development Goals, which were adopted in 2015 to address global priorities including poverty, environmental protection, and long - term social and economic well - being. Continued strong third - party sustainability and governance recognition We continue to receive strong recognition across a broad range of independent sustainability and governance assessments. During the year, we maintained industry - leading rankings from key third - party assessment providers, including an improved “AAA” ESG rating from MSCI and a reaffirmed “Prime” rating from ISS ESG. Sustainalytics recognized Franco - Nevada as a Global ESG Leader, ranking us among the top - rated companies globally for sustainability - related risk, and we achieved improved governance outcomes, including being ranked the number one mining company in The Globe and Mail’s 2025 Board Games assessment. In addition, Franco - Nevada was recognized for the first time as one of Corporate Knights’ 2026 Global 100 Most Sustainable Corporations and was once again named as one of Corporate Knights’ Canada’s Best 50 Corporate Citizens for 2025. TSX / NYSE: FNV Franco-Nevada Corporation ★ 15 14 ★ Franco-Nevada Corporation TSX / NYSE: FNV Overview Overview Overview
GEOs 2025 Actuals 519K GEOs 2030 Outlook¹ 555K–615K GEOs Potential growth of 150k–175k GEOs if Cobre Panamá restarts at full capacity • Stibnite Gold • Cascabel • Copper World • Eskay Creek • Taca Taca • Vale • Antapaccay/ Coroccohuayco • Magino • Detour Lake • Castle Mountain • Candelaria • Antapaccay + New mines + Expansions - Step-downs 1 2026 Guidance and 2030 Outlook estimate as provided in March 2026 (excluding Cobre Panamá) 2 Potential: ~$3.1B Available Capital to deploy 3 See Long-Term Optionality charts below 1 Royalty Ounces are 100% attributable to Franco-Nevada. See Long-Term Optionality charts on page 16 for additional information and qualifications related above 2 As at March 31, 2026 1 Potential Annual Contribution provides FNV’s conceptual estimate of potential GEOs that could be delivered to FNV in any given year post 2030. Such estimate assumes all projects being developed and uses current public disclosures on Mineral Reserves and Mineral Resources and potential mine production plans, where available 2 Information on calculation of Royalty Ounces and additional Advanced and Exploration assets can be found in this Asset Handbook. Royalty Ounces presented for the year ending December 31, 2025 3 FNV views the recent agreement with the T ŝ ilhqot’in Nation as a positive development and has POTENTIAL ANNUAL CONTRIBUTION LONG-TERM ROYALTY OUNCES + over 230 additional assets New Prosperity 3 (Au) Cascabel NSR + Stream (Au) Other Volcan (Au) AurMac (Au) Heva Hosco (Au) Kerr-Addison (Au) Holt (Au) Vizcachitas (Cu) Porcupine (Dome) (Au) Rogozna (Au, Ag, Zn) Arthur Gold (Au) Mineral Point (Au, Ag) Ring of Fire (Cr, Ni) Pascua-Lama (Au) Conga (Cu, Au) ~5.8M M&I + ~2.0M Inferred Royalty Ounces New Prosperity (Au) Cascabel NSR 4 + Stream (Au) Other Volcan (Au) Holt (Au) Vizcachitas (Cu) Porcupine (Dome) (Au) Rogozna (Au, Ag, Zn) Arthur Gold (Au) Conga (Cu, Au) Ring of Fire (Cr, Ni) Pascua-Lama (Au) AurMac (Au) Heva Hosco (Au) Kerr-Addison (Au) Mineral Point (Au, Ag) ~222,000 GEOs 1 included the historic resource in this Asset Handbook. However, the New Prosperity Technical Report has not been updated since 2009. FNV is not treating the New Prosperity Royalty Ounces as current and caution is advised when assessing the reliability of such resources. Royalty Ounces were not calculated for New Prosperity in the prior year Asset Handbook due to the uncertainty surrounding its development 4 Represents incremental contribution from Cascabel stream and NSR at full production net of the buyback. Franco-Nevada has the option to convert the Cascabel royalty to a gold NSR for a period of time once the asset is producing 0 20 40 60 80 100 120 2025 2008 – 2025 2007 Gold Reserves 2 at time of IPO Proven and Probable Mineral Reserves (Moz) >55 Moz gold produced IPO $1.2B paid for portfolio Gold Reserves 2 of same assets as reported December 2025 Reserves increase at no cost >$2.7B 3 revenue to Franco-Nevada from portfolio 3.6x increase 4 1 Exploration assets listed on pages 108–111 2 Total gold reserves associated with the top 37 assets at the time of IPO (not adjusted for FNV royalty ownership). All Mineral Reserves have been calculated in accordance with CIM or acceptable foreign codes for the purposes of NI 43-101, including Regulation S-K 1300, SEC Industry Guide 7, JORC, or SAMREC guidelines 3 Revenue from original FNV portfolio includes gold, platinum and palladium revenue as at December 31, 2025 4 Calculation includes depletion 2030 Updated and Potential Cobre Panamá Available Capital² Total Inventory 1 : • M&I (incl.) Royalty Ounces • Inferred Royalty Ounces • Cobre Panamá and New Prosperity potential • Excludes 230 exploration/smaller projects Potential Value of Total Inventory: • 27.5 Moz @ $4,500/oz gold 2 = $123.8B • CF from Energy Assets largely offsets tax FNV Enterprise Value: • $47.8B 2 @ $247/share Exploration Potential Long-Term Potential Long-Term Options ~222k GEOs Annually³ 510K–570K GEOs 2026 Guidance¹ Assets that have the potential to sustain or continue our growth beyond our 5-year outlook L O N G - T E R M O P T I O N A L I T Y Assets that have the potential to sustain or continue our growth beyond our 5-year outlook. G O L D A T A D I S C O U N T Stock trades at a significant discount to the value of the already identified gold inventory. G R O W T H O U T L O O K Growth reflected in our 2026 guidance, 5-year outlook and the longer-term growth drivers. A D D I T I O N A L E X P L O R A T I O N O P T I O N A L I T Y The 3.6x growth in reserves of our IPO portfolio over 18 years illustrates the potential future growth of our current portfolio. $47.8B $123.8B $0 $20 $40 $60 $80 $100 $120 $140 FNV Enterprise Value Exploration Potential Total Inventory Value TSX / NYSE: FNV Franco-Nevada Corporation ★ 17 16 ★ Franco-Nevada Corporation TSX / NYSE: FNV Overview Overview Overview
R O Y A L T Y O U N C E S Why We Measure “Royalty Ounces” Franco-Nevada’s mining properties that have reported Mineral Resources and Mineral Reserves are tabulated in the Mineral Resources and Mineral Reserves section of this Asset Handbook. Unless otherwise noted in the Royalty Ounce calculation for each asset, the figures are tabulated based on the publicly disclosed reports of each operator for each property on a 100% basis. However, the tabulation does not provide a specific measure for Franco-Nevada’s interest in such Mineral Resources and Mineral Reserves for the following reasons: • Royalty and stream interests have different economics than an operator has for its stated Mineral Resources and Mineral Reserves. In addition, the economics differ between NSR, NPI and stream interests. • Some assets do not cover the entire property associated with the operator’s publicly reported figures. To account for the above, we calculate “Royalty Ounces” to estimate the value attributable to Franco-Nevada due to our economic interest in the Mineral Resources and Mineral Reserves of our portfolio. The value of a Royalty Ounce is normalized to that of a gold NSR ounce. How We Estimate “Royalty Ounces” A traditional NSR royalty on a gold mining property provides Franco- Nevada with a simple percentage of the revenue or gold in-kind produced from that property. For example, if we have a 2% NSR royalty on a property, we calculate 2% of the stated Mineral Resources and Mineral Reserves as our “Royalty Ounces”. Note we do not make adjustments for recoveries and refining fees for gold NSRs as they are typically minor. When calculating Royalty Ounces for a property our objective is that they should be comparable to an attributable gold NSR Royalty Ounce. To achieve comparable Royalty Ounce figures, we make adjustments in the following circumstances: 1. The royalty or stream does not cover all the Mineral Resources or Mineral Reserves on a property: We provide our best estimate of the percentage of Mineral Resources and Mineral Reserves that are attributable to our interest. 2. A stream interest with an associated ongoing cost per ounce: The number of attributable stream ounces are factored to make them economically equivalent to a NSR ounce. For example as illustrated on this page, at a $4,500/oz gold price and a $400 cost per ounce, the stream ounces are factored by 91%. The factor depends on cost per ounce or the percentage margin written in the agreement. 3. A NPI royalty: A NPI is subject to the operating and capital costs specific to each asset. We generate our own internal mine life projections for each asset to determine a reasonable estimate of the economic equivalent of a gold NSR Royalty Ounce using a $4,500 gold price assumption. 4. A Gross Margin Royalties or “GMR”: Gross Margin Royalties (“GMR”) are based on the gross revenue realized from the property after deducting specified operating costs from total revenue. The calculation of gross revenue generally excludes deductions for capital costs and similar expenditures. 5. An asset producing silver, PGM or base/bulk metal: The number of attributable silver, platinum or palladium ounces, and attributable base/bulk metals pounds/tonnes are converted into Royalty Ounces. This year’s pricing assumptions for conversion include: $4,500/oz gold, $75/oz silver, $2,000/oz platinum, $1,650/oz palladium, $5.50/lb copper, $7.39/lb nickel, $1.45/lb ferrochrome and $100/t Fe 62% CFR China for our calculations. For copper, nickel, ferrochrome and iron ore Royalty Ounce calculations, we do reflect deductions for processing and refining as they are more material compared to a typical gold NSR asset. In the Assets section of this Asset Handbook, we provide details for each asset that include summary figures for the Mineral Resources (M&I Resources inclusive of P&P Reserves), Mineral Reserves (P&P Reserves) and Inferred Mineral Resources (Inf. Resources). We also provide the related M&I Royalty Ounces, P&P Royalty Ounces and Inf. Royalty Ounces for each of those assets and the key guidance and assumptions that were required to derive those Royalty Ounces. Readers are cautioned that the Royalty Ounces are prepared by the management of Franco-Nevada and have not been reviewed or endorsed by the operators of the projects. Example Economics of a Royalty (NSR or NPI) versus a Stream The example below compares the relative value per ounce to Franco- Nevada of an NSR, a stream or an NPI or WI. Assume for one ounce of gold, a sales price of $4,500, a “stream cost”¹ of $400/oz and that the “all-in sustaining cost” 2 of the mine is $1,637/oz. NSR Stream Developed NPI or WI One ounce sold at $ 4,500 $ 4,500 $ 4,500 Applicable cost $ – $ 400 1 $ 1,637 2 Margin for calculation $ 4,500 $ 4,100 $ 2,863 NSR, Stream or NPI % 4% 4% 4% Revenue per ounce to FNV $ 180 $ 164 $ 115 Value relative to an NSR 1.00x 0.91x 0.64x 1 Franco-Nevada’s streams have various ongoing costs. In some cases, it is $400/oz of gold plus a 1% annual increment, in other cases it is 20% of the spot price of gold. For each stream, Franco-Nevada indicates the detail for ongoing costs 2 For applicable costs for a developed NPI or WI, Franco-Nevada is, for illustrative purposes, assuming Barrick Gold Corporation’s (“Barrick”) 2025 all-in sustaining cash cost measure, as Barrick is the operator of two assets at which Franco-Nevada has NPI interests In total our assets have 16.7M M&I Royalty Ounces and 6.0M Inferred Royalty Ounces, the equivalent of $102.2B at $4,500/oz. If Cobre Panamá and New Prosperity are included, the total potential inventory would be 27.5M Royalty Ounces or $123.8B. 1 Royalty Ounces presented do not include Cobre Panamá, currently on preservation and safe management, and New Prosperity ROYALTY OUNCES BY MINERAL RESOURCES AND MINERAL RESERVES 1 CLASSIFICATION CATEGORIES P&P 32% M&I (excl.) 42% Inf. 26% MEASURED & INDICATED RESOURCES (Incl.) NSR 59% Stream 35% NPI 3% Other 3% PROVEN & PROBABLE RESERVES Chile 14% Peru 12% Other S. America 18% United States 13% Canada 27% Rest of World 10% Mexico 6% MEASURED & INDICATED RESOURCES (Excl.) Chile 20% Peru 13% Other S. America 11% United States 12% Canada 27% Rest of World 14% Mexico 3% INFERRED RESOURCES Chile 7% Peru 17% Other S. America 6% United States 24% Canada 28% Rest of World 14% Mexico 4% TSX / NYSE: FNV Franco-Nevada Corporation ★ 19 18 ★ Franco-Nevada Corporation TSX / NYSE: FNV Overview Overview Overview
M I N I N G R O Y A L T Y O U N C E S 1 (M&I Royalty Ounces are inclusive of P&P Royalty Ounces) Asset Asset Type P&P (000s) M&I 3 (000s) Inf (000s) South & Central America 2,4 Candelaria Stream 672 1,801 139 Antapaccay Stream 263 696 94 Antamina Stream 480 703 695 Condestable Stream 94 152 11 Vale (Northern & Southeastern System) Other 284 431 33 Sossego Other 2 2 – Tocantinzinho Stream 187 193 1 Yanacocha + Conga NSR 15 522 226 Cerro Moro NSR 4 10 4 Caserones NSR 28 43 2 Salares Norte NSR 42 44 – Cascabel (Alpala) Stream/NSR 510 1,247 175 NuevaUnión (Relincho) NSR 156 218 90 Taca Taca NSR 268 277 12 Vizcachitas NSR 109 147 155 Posse (Mara Rosa) NSR 9 11 2 CentroGold (Gurupi) NSR – 18 8 Calcatreu NSR – 19 10 El Alto NSR – 494 20 Volcan NSR – 147 19 PSJ Cobre Mendocino NSR – 95 137 Canada 2,5 Detour Lake NSR 372 715 123 Sudbury Stream 15 104 19 Hemlo NSR/NPI 165 228 98 Côté Gold GMR 414 1,067 127 Porcupine - Hoyle Pond NSR – 21 6 Porcupine - Borden NSR – 31 5 Porcupine - Pamour NSR – 108 23 Porcupine - Dome NSR – – 247 Casa Berardi Stream 55 102 20 Heva-Hosco Stream – 24 14 Brucejack NSR 35 42 30 Kirkland Lake NSR/NPI 35 68 66 Greenstone NSR 171 238 83 Magino NSR 94 137 10 LIORC Other 54 103 39 Eagle NSR 24 43 5 Musselwhite NPI 49 65 10 Timmins West NSR 7 9 3 Gold River NSR – 3 23 Canadian Malartic NSR 28 31 70 Island Gold NSR 18 20 3 Golden Highway - Holt Complex NSR – 131 86 Golden Highway - Hislop NSR – 7 4 Golden Highway - Aquarius NSR – 17 – Valentine Gold NSR 81 121 32 Eskay Creek NSR 120 154 2 Spences Bridge (Shovelnose) NSR – 15 6 Wawa NSR – 13 13 Kerr-Addison NSR – 33 24 Clarence Stream NSR – 9 13 Scottie NSR – – 14 Crawford NSR 192 306 189 AurMac NSR – 23 55 Red Lake (McFinley) NSR 1 5 3 Courageous Lake NSR 29 112 39 Goldfields NSR – 20 4 Monument Bay NSR – 44 53 Red Mountain NSR 5 8 1 Ring of Fire NSR – 285 81 Fenelon-Martiniere NSR – 24 24 Marathon (Sally) NSR – 5 2 Eagle’s Nest NSR – 8 5 Asset Asset Type P&P (000s) M&I 3 (000s) Inf (000s) United States 2 Stillwater NSR 329 675 697 Carlin Trend NSR/NPI 179 304 118 Bald Mountain NSR 26 112 21 Marigold NSR 58 81 3 Mesquite NSR 2 22 1 Castle Mountain NSR 116 157 40 Copper World Project NSR 99 246 44 Robinson NSR 4 13 – Copper Creek NSR – 3 1 Fire Creek/Midas NSR – 3 90 Hollister NSR – 2 9 Stibnite NSR 98 131 33 Nevada North (Wildcat & Mountain View) NSR – 14 2 Sleeper NSR – 45 27 Arthur Gold NSR 50 97 65 Granite Creek NSR – 45 10 Lone Tree NSR – 13 84 Cove NSR – 8 35 Mineral Point NSR – 153 109 Archimedes NSR – 16 31 Sandman NSR – 1 – Rest of World 2 Guadalupe-Palmarejo Stream 373 695 245 Western Limb/Pandora Stream/NSR 352 1,172 200 Tasiast NSR 88 136 48 Subika (Ahafo) NSR 39 58 12 Sabodala Stream 44 99 47 Karma Stream 6 74 26 Duketon NSR 18 42 11 Edikan NSR 9 19 5 Matilda (Wiluna) NSR 12 106 146 South Kalgoorlie NSR 29 80 46 Yilgarn Star GRR – 5 2 Agate Creek NSR – 3 1 Mt Keith NSR/NPI – 13 2 Mt Martin NSR – 10 8 Cue GR 4 7 5 Kiziltepe NSR 1 2 1 Rogozna NSR – – 123 Sissingué NSR 1 1 – Yandal (Bronzewing) NSR 17 38 6 Aphrodite NSR – 23 17 Rebecca NSR 11 17 4 Séguéla NSR 9 12 4 Perama Hill NSR 19 19 45 Agi Dagi NSR 23 44 6 Bullabulling NSR – 74 37 Glenburgh NPI – 4 1 Henty NSR 2 3 1 Red October NSR – 2 10 Falcondo NPI 28 31 2 Total Royalty Ounces 6 7,133 16,696 5,990 1 For information regarding the calculation of each Royalty Ounce, please refer to the individual asset write-ups. We have assumed $4,500/oz Au, $75/oz Ag, $2,000/oz Pt, $1,650/oz Pd, $5.50/lb copper, $7.39/lb nickel, $1.45/lb ferrochrome and $100/t Fe 62% CFR China for our calculations 2 Copper Royalty Ounces assume NSR deductions of 15% (for Sossego please refer to the Vale asset write-up); Nickel Royalty Ounces and Ferrochrome Royalty Ounces assume NSR deductions of 30%. Please also refer to the individual Vale (Northern & Southeastern System) & LIORC asset write-ups for the deductions applied to the Iron Ore Royalty Ounces 3 M&I Royalty Ounces include P&P Royalty Ounces 4 Cobre Panamá, currently on preservation and safe management, is not included in the above calculations. Franco-Nevada estimates that P&P Royalty Ounces, M&I (incl.) Royalty Ounces and Inf Royalty Ounces would be 2,324 koz, 2,635 koz and 404 koz, respectively, as per First Quantum’s Annual Information Form, dated February 10, 2026, as at December 31, 2025 5 For New Prosperity, Franco-Nevada views the recent agreement with the T ŝ ilhqot’in Nation as a positive development and has included the historic resource in this Asset Handbook on page 134. However, the New Prosperity Technical Report has not been updated since 2009. While Franco-Nevada has estimated the potential Royalty Ounces related to New Prosperity based on the historical assessment, caution is advised when assessing the reliability of such resources. Royalty Ounces for New Prosperity were not included in our Royalty Ounce totals above due to the uncertainty surrounding its development. For 2025, Franco-Nevada estimates that P&P Royalty Ounces, M&I (incl.) Royalty Ounces and Inf Royalty Ounces would be 1,469 koz, 1,776 koz and 0 koz, respectively 6 If Cobre Panamá and New Prosperity were included, the Total Royalty Ounces would be 10.9M P&P Royalty Ounces, 21.1M M&I (incl.) Royalty Ounces, and 6.4M Inf. Royalty Ounces TSX / NYSE: FNV Franco-Nevada Corporation ★ 21 20 ★ Franco-Nevada Corporation TSX / NYSE: FNV Overview Overview Overview
Mining Assets Hoyle Pond, Timmins, Ontario | Image Courtesy of the ROM (Royal Ontario Museum), Toronto, Canada. ©ROM M I N E L I F E I N D E X Franco-Nevada’s asset portfolio is comprised of a large variety of properties and operations with a range of projected production profiles. The chart (opposite) provides an estimated mine life index for Franco-Nevada’s 30 most material mining assets, where sufficient information is available to present the asset. This metric is to provide investors and analysts with an indication of the potential for the assets in which Franco- Nevada has interests and should not be viewed as a definitive mine life estimate. Where an operator mine life is disclosed, it is based on such operator’s latest available disclosure. If an operator mine life is not available, management has estimated a mine life by dividing the Proven and Probable Mineral Reserves by management’s best estimate of the average annual forward-looking production. Management has further estimated a mine life index for M&I Mineral Resources and Inferred Mineral Resources by dividing the Measured and Indicated Mineral Resources (inclusive of Mineral Reserves) and Inferred Mineral Resources, respectively, by management’s best estimate of the average annual forward-looking production. Readers should be cautioned that Inferred Mineral Resources are considered too speculative geologically to enable them to be categorized as Measured and Indicated Mineral Resources. To provide the mine life index of the overall portfolio, Franco- Nevada has divided its total M&I Royalty Ounces (inclusive of Mineral Reserves) and Inferred Royalty Ounces by the midpoint of its 2026 Mining production guidance. The average mine life index of the mining portfolio using this methodology is approximately 46 years (34 years for M&I Royalty Ounces with a further 12 years from Inferred Royalty Ounces). For our energy assets, Franco-Nevada receives third-party reports estimating our reserves and resources for some assets and independently calculates reserves and resources for other assets. We have calculated the asset lives of our assets by dividing the total reserves for each asset by the prior year annual production volume. The estimates are based on Proven and Probable reserves for our Canadian assets and Proven, Probable and Possible reserves for our U.S. assets. On that basis our Canadian assets have an estimated aggregate asset life of approximately 22 years and our U.S. assets have an estimated aggregate asset life of 20 years. 1 Operator mine life based on such operator’s latest available disclosure, unless otherwise noted 2 Measured and Indicated Mineral Resources and Inferred Mineral Resources used in the mine life index calculation are based on publicly disclosed information as of March 12, 2026 3 Cobre Panamá, currently on preservation and safe management, is not includedin the above calculations 4 Mine life as disclosed by Vale S.A. in their latest 20-F and exhibits. Mine life represents longest disclosed mine life 5 Operator mine life not available, management has estimated a mine life by dividing the Proven and Probable Mineral Reserves by management’s best estimate of the average annual forward-looking production. Mineral Reserves used in the mine life index calculation are based on publicly disclosed information as of March 12, 2026 Years Based on Inferred 2 Based on M&I 2 Based on operator mine life 1 0 10 20 30 40 50 South Kalgoorlie 5 Wiluna 5 Duketon 5 Subika (Ahafo) Sabodala Tasiast Western Limb Guadalupe-Palmarejo Rest of World Marigold Bald Mountain Stillwater United States Valentine Gold Greenstone Magino Musselwhite Macassa (Kirkland Lake) Brucejack Porcupine Côté Gold Hemlo Detour Lake Canada Vale Southeastern System 4 Vale Northern System 4 Caserones Salares Norte Tocantinzinho Condestable Antamina Antapaccay Candelaria South & Central America 3 The average mine life index of the mining portfolio is approximately 46 years. TSX / NYSE: FNV 22 ★ Franco-Nevada Corporation Overview
R E G I O N A L I N D E X The description and depiction of our assets in this Asset Handbook has been simplified for presentation purposes. More detailed information may have been provided in our previous disclosure or subsequently become available, please refer to our website at www.franco-nevada.com for additional information. Mineral Resources and Mineral Reserves information contained herein for 2024 and 2023 is provided for comparative purposes only. For a detailed breakdown of the 2024 and 2023 Mineral Resources and Mineral Reserves, please refer to our AIF for each of the years ended December 31, 2024 and December 31, 2023, respectively available on SEDAR+ at www.sedarplus.com. “Producing” assets are those that have generated revenue from steady-state operations or are expected to in the next year “Advanced” assets are interests on projects which are not yet producing but where, in management’s view, the technical feasibility and commercial viability of extracting a mineral resource are demonstrable “Exploration” assets represent interests on projects where technical feasibility and commercial viability of extracting a Mineral Resource are not demonstrable. Our assessment of the stage of an asset is based on information publicly disclosed by the owners and operators of such asset as at March 12, 2026 (except where stated otherwise) MINING ASSETS South & Central America Map 26 Producing Candelaria (Au & Ag) 27 Antapaccay (Au & Ag) 28 Antamina (Ag) 29 Tocantinzinho (Au) 30 Condestable (Au & Ag) 31 Vale (Iron Ore, Cu, Au & Other) 32 Yanacocha (Au, Cu & Ag) 34 Salares Norte (Au & Ag) 35 Cerro Moro (Au & Ag) 36 Caserones (Cu & Mo) 37 Posse (Mara Rosa) (Au) 38 Advanced Taca Taca (Cu, Au & Mo) 39 Cascabel (Alpala) (Au, Cu & Ag) 40 Cobre Panamá (Au & Ag) 42 NuevaUnión (Relincho) (Cu, Au & Mo) 44 CentroGold (Gurupi) (Au) 45 Calcatreu (Au & Ag) 45 PSJ Cobre Mendocino (Au) 45 Volcan (Au) 46 Vizcachitas (Cu, Mo & Ag) 46 Exploration El Alto (Au & Cu) 46 Canada Map 47 Producing Detour Lake (Au) 48 Hemlo (Au) 50 Côté Gold (Au) 51 Porcupine (Au) 52 Greenstone (Au) 53 Macassa (Kirkland Lake) (Au) 54 Sudbury (PGM & Au) 55 Musselwhite (Au) 56 Brucejack (Au & Ag) 57 Magino (Au) 58 LIORC (Iron Ore) 59 Timmins West (Au) 60 Island Gold (Au) 61 Casa Berardi (Au) 62 Canadian Malartic (Au) 63 Valentine Gold (Au) 64 Advanced Golden Highway (Au) 65 Eskay Creek (Au & Ag) 66 Red Lake (McFinley) (Au) 67 Eagle (Au) 67 Courageous Lake (Au) 68 Goldfields (Au) 68 Crawford (Ni, Co, Fe, Cr & PGM) 69 Monument Bay (Au) 69 Red Mountain (Au) 70 Cariboo (Au) 70 Exploration Ring of Fire (Cr, Ni, Cu & PGM) 71 New Prosperity (Au) 72 Fenelon/Martiniere (Au) 72 Wawa (Au) 73 Kerr-Addison (Au) 73 Spences Bridge (Westhaven) (Au) 73 Scottie (Au) 74 Redstone (Coates Lake) (Cu & Ag) 74 AurMac (Au) 74 United States Map 75 Producing South Arturo (Au) 76 Goldstrike (Au) 77 Bald Mountain (Au) 78 Stillwater (PGM) 79 Marigold (Au) 80 Gold Quarry (Au) 81 Mesquite (Au) 82 Castle Mountain (Au) 83 i-80 Gold Assets (Au & Ag) 84 Robinson (Cu, Mo, Ag & Au) 85 EaglePicher (De) 85 Advanced Copper World Project (Cu, Mo, Ag & Au) 86 Stibnite Gold (Au & Ag) 87 Arthur Gold (Au) 88 Sterling (Au) 89 Copper Creek (Cu, Mo & Ag) 89 Exploration South Railroad (Au) 90 Midas-Hollister-Fire Creek (Au) 90 Sleeper (Au) 90 Rest of World Map 91 Producing Guadalupe-Palmarejo (Au) 92 Western Limb (Au & Pt) 93 Subika (Ahafo) (Au) 94 Tasiast (Au) 95 Sabodala (Au) 96 Duketon (Au) 97 South Kalgoorlie (Au) 98 Séguéla (Au) 99 Edikan (Au) 100 Yandal (Bronzewing) (Au) 101 Wiluna (Au) 102 Kiziltepe (Au & Ag) 102 Pandora (PGM) 103 Sissingué (Au) 103 Milpillas (Cu) 104 Advanced Rebecca (Au) 104 Perama Hill (Au) 104 Agate Creek (Au) 105 Mt Keith (Ni) 105 Aphrodite (Au) 105 Bullabulling (Au) 106 Exploration Rogozna (Au, Ag, Cu, Pb & Zn) 107 Mining Exploration Assets 108 (255 Assets) ENERGY ASSETS Energy Map 115 U.S. Permian Basin 116 SCOOP/STACK 117 Marcellus 118 Haynesville 119 Canadian Weyburn Unit 120 Orion 121 Other Producing Energy Assets 122 Energy Exploration Assets 123 (28 Assets) A L P H A B E T I C A L I N D E X MINING ASSETS Agate Creek (Au) 105 Antamina (Ag) 29 Antapaccay (Au & Ag) 28 Aphrodite (Au) 105 Arthur Gold (Au) 88 AurMac (Au) 74 Bald Mountain (Au) 78 Brucejack (Au & Ag) 57 Bullabulling (Au) 106 Calcatreu (Au & Ag) 45 Canadian Malartic (Au) 63 Candelaria (Au & Ag) 27 Cariboo (Au) 70 Casa Berardi (Au) 62 Cascabel (Alpala) (Au, Cu & Ag) 40 Caserones (Cu & Mo) 37 Castle Mountain (Au) 83 CentroGold (Gurupi) (Au) 45 Cerro Moro (Au & Ag) 36 Cobre Panamá (Au & Ag) 42 Condestable (Au & Ag) 31 Copper Creek (Cu, Mo & Ag) 89 Copper World Project (Cu, Mo, Ag & Au) 86 Côté Gold (Au) 51 Courageous Lake (Au) 68 Crawford (Ni, Co, Fe, Cr & PGM) 69 Detour Lake (Au) 48 Duketon (Au) 97 Eagle (Au) 67 EaglePicher (De) 85 Edikan (Au) 100 El Alto (Au & Cu) 46 Eskay Creek (Au & Ag) 66 Fenelon/Martiniere (Au) 72 Gold Quarry (Au) 81 Golden Highway (Au) 65 Goldfields (Au) 68 Goldstrike (Au) 77 Greenstone (Au) 53 Guadalupe-Palmarejo (Au) 92 Hemlo (Au) 50 i-80 Gold Assets (Au & Ag) 84 Island Gold (Au) 61 Kerr-Addison (Au) 73 Kiziltepe (Au & Ag) 102 LIORC (Iron Ore) 59 Macassa (Kirkland Lake) (Au) 54 Magino (Au) 58 Marigold (Au) 80 Mesquite (Au) 82 Midas-Hollister-Fire Creek (Au) 90 Milpillas (Cu) 104 Mining Exploration Assets 108 Monument Bay (Au) 69 Mt Keith (Ni) 105 Musselwhite (Au) 56 New Prosperity (Au) 72 NuevaUnión (Relincho) (Cu, Au & Mo) 44 Pandora (PGM) 103 Perama Hill (Au) 104 Porcupine (Au) 52 Posse (Mara Rosa) (Au) 38 PSJ Cobre Mendocino (Au) 45 Rebecca (Au) 104 Red Lake (McFinley) (Au) 67 Red Mountain (Au) 70 Redstone (Coates Lake) (Cu & Ag) 74 Ring of Fire (Cr, Ni, Cu & PGM) 71 Robinson (Cu, Mo, Ag & Au) 85 Rogozna (Au, Ag, Cu, Pb & Zn) 107 Sabodala (Au) 96 Salares Norte (Au & Ag) 35 Scottie (Au) 74 Séguéla (Au) 99 Sissingué (Au) 103 Sleeper (Au) 90 South Arturo (Au) 76 South Kalgoorlie (Au) 98 South Railroad (Au) 90 Spences Bridge (Westhaven) (Au) 73 Sterling (Au) 89 Stibnite Gold (Au & Ag) 87 Stillwater (PGM) 79 Subika (Ahafo) (Au) 94 Sudbury (PGM & Au) 55 Taca Taca (Cu, Au & Mo) 39 Tasiast (Au) 95 Timmins West (Au) 60 Tocantinzinho (Au) 30 Valentine Gold (Au) 64 Vale (Iron Ore, Cu, Au & Other) 32 Vizcachitas (Cu, Mo & Ag) 46 Volcan (Au) 46 Wawa (Au) 73 Western Limb (Au & Pt) 93 Wiluna (Au) 102 Yanacocha (Au, Cu & Ag) 34 Yandal (Bronzewing) (Au) 101 ENERGY ASSETS Energy Exploration Assets 123 Haynesville 119 Marcellus 118 Orion 121 Other Energy Producing Assets 123 Permian Basin 116 SCOOP/STACK 117 Weyburn Unit 120 TSX / NYSE: FNV Franco-Nevada Corporation ★ 25 24 ★ Franco-Nevada Corporation TSX / NYSE: FNV
C A N D E L A R I A Producing Location: Chile, South America | Operator: Lundin Mining Corporation | Precious Metals: Au & Ag | Stream: Gold and Silver Stream In November 2014, Franco-Nevada International Corporation (“FNIC”) acquired a gold and silver stream on production from the Candelaria operation in Chile. 2025 2024 2023 Revenue to Franco-Nevada ($ million) $ 232.5 $ 163.1 $ 130.3 M&I Resources (koz Au) 1 5,599 5,764 5,895 Inf. Resources (koz Au) 1 461 436 606 P&P Reserves (koz Au) 1 2,040 2,104 2,235 M&I Resources (Moz Ag) 1 83.3 86.1 86.6 Inf. Resources (Moz Ag) 1 5.7 5.5 6.3 P&P Reserves (Moz Ag) 1 27.0 29.7 32.1 M&I Royalty Ounces (000s) 1,2 1,801 1,683 1,586 Inf. Royalty Ounces (000s) 2 139 115 145 P&P Royalty Ounces (000s) 2 672 643 665 1 Please refer to the tables on pages 126–134 for a breakout of grade and tonnages by Mineral Resource category; all M&I categories are inclusive of Mineral Reserves 2 For Royalty Ounce calculation, Franco-Nevada estimates P&P Royalty Ounces include payable metal of the balance of the 720 koz of gold and 12.0 Moz of silver remaining and the balance of P&P Reserves subject to the lower stream percentage. For M&I Royalty Ounces, Franco- Nevada has assumed the P&P Royalty Ounces with the balance of M&I Resources subject to the lower stream percentage. For Inf. Royalty Ounces, Franco-Nevada assumes Inf. Mineral Resources are subject to the lower stream percentage. Silver is converted to Royalty Ounces assuming $4,500/oz gold and $75.00/oz silver ($2,800/oz gold and $31.00/oz silver in 2024, $1,950/oz gold and $22.50/oz silver in 2023). The stream interest has been factored by 90% to reflect $4,500/oz gold and $437.47/oz ongoing payments (85% in 2024, 78% in 2023) The Candelaria mine was discovered in 1987, and the open pit has been in operation since 1993. The operation also includes the Candelaria North and South and the Santos underground mines. Lundin Mining Corporation (“Lundin”) is the operator of the project and owns 80% of the asset with the balance owned by Sumitomo Corporation and its affiliates. Franco-Nevada provided an up-front deposit of $655 million to acquire the gold and silver stream from what is primarily a copper mine. The funds were used to finance a portion of the cost paid by Lundin to acquire the asset from Freeport-McMoRan Inc. Candelaria is an established mining operation and the transaction was the first material instance of a royalty/ streaming company partnering with an operating company to purchase a producing asset. The stream covers the current property of approximately 150 km 2 . An additional defined area of interest effectively doubles the property position. Should Lundin acquire properties located within the area of interest, Franco-Nevada has the option to purchase a gold and silver stream which will apply to the additional ore from such properties. Under the streaming agreement, Lundin will deliver 68% of the payable gold and silver from 100% of the mine production, which reduces to 40% after 720 koz of gold and 12.0 Moz of silver have been delivered to Franco-Nevada. This is currently expected to occur in 2027. Cumulatively, 650,089 oz of gold and 11.0 Moz of silver have been delivered since acquisition until December 31, 2025. Franco-Nevada pays an ongoing price equal to the lesser of $437.47/oz of gold and $4.36/oz of silver or the then prevailing spot price for gold and silver for each ounce delivered under the stream. This price escalates by 1% per annum in October of each year. Lundin has made a significant investment in exploration at Candelaria and has extended the mine life from 2028, when it acquired Candelaria, to 2051. Lundin has successfully added to the Mineral Resources and Mineral Reserves at the four underground mines and has discovered the open pittable Española deposit partly on ground covered by Franco-Nevada’s area of interest. Candelaria has a total mill throughput of approximately 75 kt per day. Lundin is currently evaluating the potential expansion of the underground mines utilizing hauling trucks to increase production capacity from 14 ktpd to approximately 22 ktpd. In 2025, Candelaria produced approximately 145 kt of copper, 80,500 oz of gold and 1.8 Moz of silver, on a 100% basis. Franco-Nevada sold 68,273 GEOs from the mine in 2025, compared with 67,260 GEOs in 2024. In 2026, Franco-Nevada expects sales from its Candelaria stream to be between 57,500 and 67,500 GEOs. Cobre Panamá CentroGold (Gurupi) Cerro Moro Taca Taca NuevaUnión (Relincho) Antamina Salares Norte Antapaccay Candelaria Volcan Calcatreu Cascabel (Alpala) Condestable Vale N. System Vale S.E. System Sossego Posse (Mara Rosa) Caserones Tocantinzinho Yanacocha El Alto Cobre Panamá currently on preservation and safe management Producing Advanced Exploration Producing Advanced Exploration Mining Assets Precious Metals Diversified PSJ Cobre Mendocino Vizcachitas South & Central America Tierra Amarilla Santos Mine Copiapo Candelaria North (U/G) Alcaparrosa Mine Candelaria Pit Candelaria South (U/G) La Española kilometer 0 2.5 N Candelaria Gold and Silver Stream Pacific Ocean Argentina Bolivia Peru Brazil Chile Candelaria Ojos del Salado Mining Property Candelaria Mining Property Area of Interest Pits History of expanding resources UG mine expansion permitted and being evaluated The operator currently has a 26-year mine plan. M&I Resources could support production for 43 years and Inf. Resources for a further 4 years TSX / NYSE: FNV Franco-Nevada Corporation ★ 27 26 ★ Franco-Nevada Corporation TSX / NYSE: FNV South & Central America
A N T A P A C C A Y Producing Location: Peru, South America | Operator: Glencore plc | Precious Metals: Au & Ag | Stream: Gold and Silver Stream In February 2016, FNIC acquired a precious metals stream on production from the Antapaccay mine for $500 million from Glencore plc (“Glencore”) and its subsidiaries. 2025 2024 2023 Revenue to Franco-Nevada ($ million) $ 163.9 $ 131.0 $ 120.1 M&I Resources (koz Au) 1 2,717 2,734 2,871 Inf. Resources (koz Au) 1 457 153 164 P&P Reserves (koz Au) 1 824 909 1,033 M&I Resources (Moz Ag) 1 68.3 68.1 68.3 Inf. Resources (Moz Ag) 1 8.7 3.2 3.4 P&P Reserves (Moz Ag) 1 16.5 15.6 17.7 M&I Royalty Ounces (000s) 1,2 696 656 712 Inf. Royalty Ounces (000s) 2 94 29 32 P&P Royalty Ounces (000s) 2 263 279 333 1 Please refer to the tables on pages 126–134 for a breakout of grade and tonnages by Mineral Resource category; all M&I categories are inclusive of Mineral Reserves 2 For Royalty Ounce calculation, Franco-Nevada estimates P&P Royalty Ounces include payable metal of the remaining deliveries before the 630 koz of gold and 10.0 Moz of silver hurdle with the balance of Mineral Reserves subject to a 30% stream. For M&I Royalty Ounces, Franco-Nevada assumes the P&P Royalty Ounces with the balance of M&I Resources subject to the 30% stream. For Inf. Royalty Ounces, Franco-Nevada assumes Inf. Mineral Resources are subject to the 30% stream. Silver has been converted to Royalty Ounces assuming $4,500/oz gold and $75.00/oz silver ($2,800/oz gold and $31.00/oz silver in 2024, $1,950/oz gold and $22.50/oz silver in 2023). The stream interest has been factored by different ongoing payments of 20% of the spot price of gold and silver on the first 750 koz of gold and 12.8 Moz of silver and 30% of the spot price thereafter Antapaccay is located within the province of Espinar in Southern Peru. The property also hosts the historic Tintaya open pit mine and related infrastructure which began operating in 1984. Glencore (Xstrata) invested in excess of $1.5 billion of initial capital to build and commission the Antapaccay open pit mine and plant, which commenced operations in 2012. Under the streaming agreement, gold and silver deliveries are initially referenced to copper in concentrate shipped. Franco-Nevada will receive 300 oz of gold and 4,700 oz of silver for each 1 kt of copper in concentrate shipped, until 630 koz of gold and 10.0 Moz of silver have been delivered, which is currently expected to occur in 2028. Thereafter, Franco-Nevada will receive 30% of the gold and silver shipped. Cumulatively, 531,810 oz of gold and 8.3 Moz of silver have been delivered since acquisition until December 31, 2025. Franco-Nevada will initially pay an ongoing price of 20% of the spot price of gold and silver until 750 koz of refined gold and 12.8 Moz of refined silver have been delivered. Thereafter, the ongoing price will increase to 30% of the spot price of gold and silver. The stream covers approximately 997 km 2 with exposure to the majority of the Antapaccay concessions including the Coroccohuayco deposit which is located within 10 km of the Antapaccay plant. Glencore anticipates a construction decision on the Coroccohuayco open pit project in H2 2026 with first production targeted for H2 2029 with average annual production of 53 koz per annum of gold and 1.5 Mozpa of silver over 40+ years. Coroccohuayco hosts M&I Mineral Resources of 704 Mt with a copper grade that is approximately 50% higher than the Antapaccay Mineral Reserves. In addition, there are several large-scale regional targets and prospects on the Antapaccay concessions. Antapaccay currently has a combined (Antapaccay + Tintaya plants) mill throughput capacity of 105 ktpd. In 2025, Antapaccay produced approximately 131 kt of copper, 44 koz of gold and 1.0 Moz of silver. Franco-Nevada sold 45,488 GEOs from the mine in 2025, compared with 55,329 GEOs in 2024 and, in 2026, expects sales from its Antapaccay stream to be between 30k–40k GEOs based on mine sequencing. Antapaccay has a planned mine life to 2036 which would be further extended by any development of Coroccohuayco. A N T A M I N A Producing Location: Peru, South America | Operator: Teck Resources Limited (owns 22.50%) | Precious Metals: Ag | Stream: Silver Stream In October 2015, Franco-Nevada acquired a silver stream for $610 million on production from the Antamina copper/zinc mine in Peru from Teck Resources Limited (“Teck”). 2025 2024 2023 Revenue to Franco-Nevada ($ million) $ 143.3 $ 55.3 $ 50.5 M&I Resources (Moz Ag)¹ 309.0 315.4 324.7 Inf. Resources (Moz Ag)¹ 424.1 428.5 429.6 P&P Reserves (Moz Ag)¹ 195.4 207.8 77.8 M&I Royalty Ounces (000s) 1,2 703 481 522 Inf. Royalty Ounces (000s) 2 695 467 492 P&P Royalty Ounces (000s) 2 480 339 134 1 Please refer to the tables on pages 126–134 for a breakout of grade and tonnages by Mineral Resource category; all M&I categories are inclusive of Mineral Reserves 2 For Royalty Ounce calculation, Franco-Nevada assumes 22.5% of Teck’s interest in Antamina is subject to our stream interest and that the stream reduces by 33% once 86 million silver ounces have been delivered. Silver has been converted to Royalty Ounces assuming $4,500/oz gold and $75.00/oz silver ($2,800/oz gold and $31.00/oz silver in 2024, $1,950/oz gold and $22.50/oz silver in 2023). The stream interest has been factored by ongoing payments of 5% of the spot price of silver Teck has a 22.50% interest in Compañía Minera Antamina S.A. (“CMA”), the Antamina joint venture company, along with partners BHP Billiton Plc (33.75%), Glencore (33.75%) and Mitsubishi Corporation (10.00%). The stream is based on recovered silver from Teck’s attributable 22.50% interest in the Antamina mine, subject to a fixed silver payability of 90%. Franco-Nevada pays 5% of the spot silver price for each ounce of silver delivered under the stream. The stream will reduce by one-third after 86.0 Moz of silver have been delivered, currently expected after 2040. A total of 32.1 million cumulative oz of silver has been delivered to Franco-Nevada as of December 31, 2025. In September 2025, Anglo American plc (“Anglo American”) and Teck agreed to a merger of equals which is expected to close in 2026. Antamina commenced operations in 2001 and is one of the lowest cost copper operations globally. Antamina has a mill throughput capacity of approximately 165 ktpd, depending on ore hardness. In 2025, on a 100% basis, Antamina produced approximately 381,800 tonnes of copper, 454,800 tonnes of zinc and 17.7 Moz of silver (silver calculated from Glencore’s 33.75% interest in Antamina) in concentrates. Silver sold for 2025 was 3.2 Moz for Franco-Nevada’s attributable share under the stream, with 1.9 Moz sold in 2024. Franco-Nevada expects attributable production in 2026 to be between 3.5–3.7 Moz of silver, higher than our long-term expected annual range of 2.8–3.2 Moz of silver as silver grades are expected to be higher than average in 2026. In addition, a new primary crusher was commissioned early 2025 to replace the existing ore crusher and allow pit Phase 9 to continue expanding to the south. All major regulatory approvals are in place for operations through 2036. At December 31, 2025, Mineral Reserves were 528 Mt (with a silver grade of 11.5 g/t). In addition to these Mineral Reserves, which are constrained by tailings disposal capacity, the mine has M&I Mineral Resources (exclusive of Reserves) of 338.7 Mt (with a silver grade of 10.4 g/t) and Inf. Mineral Resources of 1,256.3 Mt (with a silver grade of 10.5 g/t). CMA is evaluating additional tailings storage options and alternative mine plans that could result in significant mine life extensions well beyond 2036. Beyond the known Mineral Resources and Mineral Reserves, Antamina hosts additional potential open pit and bulk/selective underground targets. There is also regional exploration potential over a large, prospective land package greater than 1,000 km 2 . kilometer 15 0 N Antapaccay Gold and Silver Stream Pacific Ocean Argentina Bolivia Peru Brazil Chile Antapaccay Antapaccay Pit Coroccohuayco Tintaya Pit/ Tailings Storage Antapaccay Plant Tintaya Plant 8 km 7 km Pits Antapaccay Concession Area *Antapaccay Concession area covers ~997 km 2 Excluded from Stream Antapaccay Concession Area Pacific Ocean Argentina Bolivia Peru Brazil Chile Antamina Antamina Silver Stream kilometer 100 0 Antamina Lima Cajacay Chasquitambo Carretera Pativilca-Huarez Huarmey Punta Lobitos CMA Puerto Minero Aquia Chiquian Catac Recuay Huaraz Huallanca Yanashall Machac Parque Nacional Huascaran CMA Pipeline Pacific Ocean Autopista Panamericana Norte Conococha Cutatambo Pachacoto Huanzala Subestacion Linea de Transmision Electrica San Marcos Huari Chavui De Huantar Paramonga Pativilca Barranca Huacho Huaral Chancay Pto. Supe N High grade copper/zinc orebody and one of the lowest cost operations globally Large, high grade Measured, Indicated and Inf. Mineral Resources Additional tailings storage options key to unlocking mine life extensions The operator currently has a 11-year mine plan. M&I Resources could support production for 16 years and Inf. Resources for a further 24 years Gold and silver deliveries initially referenced to copper in concentrate shipped Potential for Coroccohuayco to extend mine life over 40+ years Land package of 997 km² offers a number of large-scale regional targets The operator currently has a 11-year mine plan. M&I Resources could support production for 31 years and Inf. Resources for a further 8 years TSX / NYSE: FNV Franco-Nevada Corporation ★ 29 28 ★ Franco-Nevada Corporation TSX / NYSE: FNV South & Central America South & Central America
C O N D E S T A B L E Producing Location: Peru, South America | Operator: Rio2 Limited | Precious Metals: Au & Ag | Stream: Gold and Silver Stream In March 2021, FNIC acquired a precious metals stream on production from the Condestable mine in Peru for $165 million and provided an additional $10 million in March 2024 to amend the phase 2 variable deliveries to 37.5%. 2025 2024 2023 Revenue to Franco-Nevada ($ million) $ 44.5 $ 29.9 $ 23.7 M&I Resources (koz Au) 1 346 546 537 Inf. Resources (koz Au) 1 31 78 79 P&P Reserves (koz Au) 1 170 244 267 M&I Resources (Moz Ag) 1 9.8 9.8 9.8 Inf. Resources (Moz Ag) 1 0.9 1.0 1.0 P&P Reserves (Moz Ag) 1 5.3 5.0 5.2 M&I Royalty Ounces (000s) 1,2 152 185 147 Inf. Royalty Ounces (000s) 2 11 18 12 P&P Royalty Ounces (000s) 2 94 72 85 1 Please refer to the tables on pages 126–134 for a breakout of grade and tonnages by Mineral Resource category; all M&I categories are inclusive of Mineral Reserves 2 For Royalty Ounce calculation, Franco-Nevada estimates 63% of gold and silver until 87,600 ounces of gold and 2,910 koz of silver are delivered, respectively; thereafter, 37.5% of gold and silver ounces are subject to the stream. For Inf. Royalty Ounces, Franco-Nevada assumes 37.5% of gold and silver from Inf. Mineral Resources (25% in 2023) are subject to the stream. Silver has been converted to Royalty Ounces assuming $4,500/oz gold and $75.00/oz silver ($2,800/oz gold and $31.00/oz silver in 2024, $1,950/oz gold and $22.50/oz silver in 2023). The stream interest has been factored by ongoing payments of 20% of the spot price of gold and silver The Condestable mine is located approximately 90 km south of Lima, Peru. In January 2026, Rio2 Limited (“Rio 2”) completed the acquisition of the mine, which was previously held by Southern Peaks Mining L.P ., a private company. The Condestable mine has operated for over 60 years, produces approximately 20 kt of copper per year and has a proven history of resource conversion. For the first five years of the streaming agreement, commencing on January 1, 2021 and ending December 31, 2025, Franco-Nevada received 8,760 oz of gold and 291 koz of silver annually until a total of 43,800 oz of gold and 1,455 koz of silver were delivered (the “Fixed Deliveries”). Franco-Nevada will now receive 63% of the gold and silver contained in concentrate until a cumulative total of 87,600 oz of gold and 2,910 koz of silver have been delivered (the “Variable Phase 1 Deliveries”). The stream then reduces to 37.5% over the remaining life of mine (the “Variable Phase 2 Deliveries”). Franco-Nevada pays 20% of the spot price for gold and silver for each ounce delivered under the stream. The stream is referenced to Condestable concessions covering approximately 450 km 2 with excellent near mine exploration upside. The mine is ramping up to 8,400 tonnes per day, which was achieved for a sustained period during the year, and is currently constructing a tailings filtration plant which extends the life of the tailings storage facilities. Due to a timing delay as a result of the transition from fixed to variable deliveries, Franco-Nevada expects deliveries of approximately 7.7 koz of gold and 150 koz of silver in 2026, based on three quarterly delivers starting in the second quarter. Following the end of the 5-year fixed delivery period, deliveries will be lower in 2026, however, Rio2 is evaluating a 20% to 40% increase in permitted capacity of the underground mine and is evaluating the development of an open pit, which may result in increased deliveries in the coming years. Condestable UG Surface facilities Raul UG Vinchos UG Pacific Ocean Pan American Hwy 102 km to Lima Condestable Gold and Silver Stream kilometer 5 0 kilometer 5 0 Condestable Mining Property Excluded from Stream N Pacific Ocean Argentina Bolivia Peru Brazil Chile Condestable T O C A N T I N Z I N H O Producing Location: Brazil, South America | Operator: G Mining Ventures Corp. | Precious Metals: Au | Stream: Gold Stream In July 2022, FNIC announced a $352.5 million funding package supporting G Mining Ventures Corp. on the Tocantinzinho gold project in Brazil. 2025 2024 2023 Revenue to Franco-Nevada ($ million) $ 72.5 $ 15.4 $ – M&I Resources (koz Au) 1 1,928 2,181 2,102 Inf. Resources (koz Au) 1 14 27 50 P&P Reserves (koz Au) 1 1,874 2,031 2,042 M&I Royalty Ounces (000s) 1,2 193 218 210 Inf. Royalty Ounces (000s) 2 1 3 5 P&P Royalty Ounces (000s) 2 187 203 204 1 Please refer to the tables on pages 126–134 for a breakout of grade and tonnages by Mineral Resource category; all M&I categories are inclusive of Mineral Reserves 2 For Royalty Ounce calculation, Franco-Nevada estimates it will receive 12.5% of gold produced which reduces to 7.5% after 300 koz of gold have been delivered. The stream interest has been factored by 80% to reflect an ongoing payment price of 20% of the spot price for each ounce of gold delivered ($4,500/oz gold in 2025, $2,800/oz gold in 2024, $1,950/oz gold in 2023) Tocantinzinho is located in the Tapajos region of Pará State, Brazil, 200 km south-southwest of the city of Itaituba, and is owned and operated by G Mining Ventures Corp. (“G Mining Ventures”). The construction funding package included a $250 million gold stream, $75 million secured term loan and purchase of $27.5 million of G Mining Ventures’ common shares. The project was completed on time and on budget and achieved commercial production in September 2024. In 2024, Franco-Nevada also completed a private placement for an additional $25 million in shares following the Reunion Gold merger and exercised its warrants in connections with the initial project finance package. Under the streaming agreement, Franco-Nevada will receive 12.5% of gold produced which reduces to 7.5% after 300 koz of gold have been delivered. Franco-Nevada pays an ongoing price of 20% of the spot gold price for each ounce of gold delivered. Tocantinzinho is a conventional open pit mining and milling operation. G Mining Ventures’ February 2022 feasibility study outlined a 12,600 tpd mill producing 1.8 Moz of gold over 10.5 years, resulting in an average annual gold production profile of approximately 175 koz with an all-in-sustaining cost of $681/oz and initial capital cost of $458 million. As of December 31, 2025, Tocantinzinho had Mineral Reserves of 1.87 Moz of gold (49.8 Mt at 1.17 g/t gold). The 2026 exploration budget is set at $8 million to $10 million with the intent to discover the next deposit on the existing land package. Tocantinzinho produced 171,871 oz of gold in 2025 and is estimated to produce between 160–190 koz of gold for 2026 and 200–235 koz of gold in 2027, with the increase in 2027 driven by a full-year contribution of higher-grade ore from Phase 2. Franco-Nevada sold 20,900 oz of gold from the mine in 2025, compared to 5,813 oz of gold in 2024. Tocantinzinho Gold Stream kilometer 10 0 N Tocantinzinho Pacific Ocean Argentina Bolivia Peru Brazil Tocantinzinho Mining Licenses Exploration Licenses Excluded from Stream Licenses under application Ramping up to nameplate capacity Large, prospective land package of approximately 996 km² The operator currently has a 10-year mine plan. M&I Resources could support production for 11 years Proven operation targeting plant expansion up to 12 ktpd with excellent potential for mine life extension Rio2 assessing options to develop a potential open pit project Large, prospective land package of approximately 450 km² The operator currently has a 11-year mine plan. M&I Resources could support production for 28 years and Inf. Resources for a further 4 years TSX / NYSE: FNV Franco-Nevada Corporation ★ 31 30 ★ Franco-Nevada Corporation TSX / NYSE: FNV South & Central America South & Central America
Vale 0.264% Iron Ore, 0.367% Copper/Gold 0.147% Other Iron Asset Royalty Area Cu/Au Asset Southeastern System Northern System Brazil Southeastern System Caué (Fe) Conceição (Fe) Itabira Overview Minas Centrais Overview Mariana Overview Brucutu (Fe) Fazendão (Fe) Capanema (Fe) Alemão Project (Cu/Au) Serra Norte (Fe) Serra Leste (Fe) S11D (Fe) Sossego (Cu/Au) Northern System kilometer 10 0 N kilometer 10 0 N Vale, Brazil V A L E Producing Location: Brazil, South America | Operator: Vale S.A. | Metals: Iron Ore, Cu, Au & Other | Royalty: 0.264% Iron Ore, 0.367% Copper / Gold, 0.147% Other 1 In April 2021, Franco-Nevada acquired 57 million Participating Debentures (“Royalty Debentures”) for $538 million, providing holders with effective net sales royalties on Vale S.A.’s (“Vale”) Northern and Southeastern Iron Ore Systems and on certain copper and gold operations in Brazil (together, the “Royalty”). 2025 2024 2023 Revenue to Franco-Nevada ($ million) $ 36.7 $ 36.7 $ 35.1 Vale (Northern and Southeastern System) M&I Resources (Mt Iron Ore) 2 19,036 16,400 16,809 Inf. Resources (Mt Iron Ore) 2 4,709 4,055 3,877 P&P Reserves (Mt Iron Ore) 2 8,056 7,672 8,534 Sossego (Au) P&P Reserves (koz Au) 2 323 377 518 Sossego (Cu) P&P Reserves (Mlbs Cu) 2 717 804 1,102 M&I Royalty Ounces (000s) 3 433 621 1,114 Inf. Royalty Ounces (000s) 3 33 41 64 P&P Royalty Ounces (000s) 3 286 442 800 1 See Franco-Nevada AIF for the year ended December 31, 2025 and Vale’s website for Royalty Debenture details including deed, semi-annual debenture reports, and annual mineral property inventory 2 Please refer to the tables on pages 126–134 for a breakout of grade and tonnages and details for Sossego Mineral Resources 3 For Royalty Ounce calculation, the Vale Royalty covers specified mining rights in the Northern and Southeastern Systems reflecting the specified properties held by Vale at privatization. It is estimated that the Vale Royalty covers all of the Mineral Resources and Mineral Reserves at the Northern System, and a portion at the Southeastern System. Historically, approximately 60 Mtpa of Southeastern System production has been attributable to the Vale Royalty and is expected to remain at that level over the medium-term. In addition, Franco-Nevada accounts for moisture, mass recovery, and allowable deductions under the Vale Royalty, as described more fully on Vale’s website. For the Royalty Ounce calculation associated with the Mineral Reserves of the Sossego mine, Franco-Nevada accounts for allowable deductions and mineral recovery and Mineral Resources have been excluded based on limited disclosure by Vale S.A. and inclusion of projects not covered by the Vale Royalty in the Mineral Resources. Refer to Vale’s 2025 20-F annual report for additional information 4 Updates to mineral property inventory and maps provided semi-annually on Vale’s website The acquisition represents 14.7% of the total number of Royalty Debentures issued originally by Vale as part of its privatization in 1997, to provide exposure to future resource growth from specified properties held at the time. Royalty payments are made by Vale on a semi-annual basis on March 31 st and September 30 th of each year reflecting production in the preceding half calendar year period. In 2025, Vale purchased 89.4 million Royalty Debentures (resulting in a 23% reduction of the total outstanding Royalty Debentures) at R42 per debenture. Northern System: The Royalty terms, on a 100% basis, provide for a 1.8% (0.264% attributable) net sales royalty on iron ore sales from the Northern System mines. The Northern System located in Carajas, Para state, Brazil is a fully integrated operation inclusive of mines, railroad, maritime facilities and a port. The Northern System includes the Serra Sul (i.e. S11A-D), Serra Norte and Serra Leste mines and represents one of the largest mining complexes globally with long-life reserves and excellent potential for mine life extensions. The Northern System has been in operation since 1984 with the most recent development of the Serra Sul (S11D) mine in 2016. The current exhaustion date provided by Vale projects mining at the Northern System until the late 2060s. The Northern System produced 170 Mt of premium high-grade iron ore in 2025. Production in 2026 is expected by Vale to be in line year-over-year and gradually increase through the approved expansion of Serra Sul (+20 Mt project on track to start-up in H2 2026) and other growth projects. Southeastern System: The Royalty terms, on a 100% basis, provide for a 1.8% (0.264% attributable) net sales royalty on iron ore sales from the portion of production covered by the Royalty in the Southeastern System. The Southeastern System located in the Iron Quadrangle of Minas Gerais, Brazil is a key global producer of pellet feed and is a fully integrated complex with rail, maritime facilities and a port. Contributions to the Royalty started in April 2025 when a cumulative sales threshold was reached. The Royalty provides partial coverage of the three Southeastern System mining complexes: Itabira, Minas Centrais (Brucutu mine), Mariana (Fazendao and, to a lesser extent, Capanema mines). We estimate c.60 Mt were sold from the covered mineral properties in 2025 and that production levels from the complexes will remain steady over the medium to long-term. This represents an approximate 30% increase to the volumes attributable to the Royalty. The current exhaustion date provided by Vale projects mining at the Southeastern System until the early 2060s. Sossego: The Royalty also provides for a 2.5% royalty on 50% of net sales (i.e. 1.25% or 0.183% attributable) on the Sossego copper mine and certain other smaller copper and gold assets in the surrounding area. Sossego is located in Carajas, Para state, Brazil and is an open pit operation with nominal capacity to produce approximately 93 kt per year of copper in concentrate. Sossego produced 74,400 tonnes of copper in 2025. The Royalty further covers certain adjacent satellite deposits to Sossego which are being studied by Vale as replacement/life extensions for the operation. Other: Additionally, the Royalty provides for a 1% (0.147% attributable) net sales royalty on (i) all other minerals (subject to certain specific thresholds and carveouts) and (ii) on net proceeds in the event of an underlying asset sale. In total, the Royalty covers approximately 3.7 million acres of prospective geology 4 . Vale, Brazil World class iron ore mines producing high quality iron ore needed for low emission steel Strong potential for growth and multi-decade mine lives Fully integrated production provides cost advantage The operator currently projects that mine will continue into the 2060s TSX / NYSE: FNV Franco-Nevada Corporation ★ 33 32 ★ Franco-Nevada Corporation TSX / NYSE: FNV South & Central America South & Central America
Y A N A C O C H A Producing Location: Peru, South America | Operator: Newmont Corporation | Precious Metals: Au,Cu & Ag | Royalty: NSR: 1.8% Franco-Nevada has a 1.8% net smelter return royalty on all minerals on Newmont’s Yanacocha mine and certain adjacent mineral properties in Peru, which includes the producing oxides and the sulfides project located within the existing oxide footprint. The royalty also covers certain other projects, including the nearby Conga Cu-Au deposit and the Quilish oxide gold project. 2025 2024 2023 Revenue to Franco-Nevada ($ million) $ 32.6 $ 7.5 $ – M&I Resources (koz Au) 1 6,300 22,500 − Inf. Resources (koz Au) 1 6,700 8,500 − P&P Reserves (koz Au) 1 500 5,300 − M&I Resources (Moz Ag) 1 95.8 174.1 − Inf. Resources (Moz Ag) 1 47.3 26.6 − P&P Reserves (Moz Ag) 1 19.4 83.4 − M&I Resources (Mlbs Cu) 1 1,543 6,393 − Inf. Resources (Mlbs Cu) 1 1,102 1,102 − P&P Reserves (Mlbs Cu) 1 − 1,543 − M&I Royalty Ounces (000s) 1,2 522 588 − Inf. Royalty Ounces (000s) 2 226 184 − P&P Royalty Ounces (000s) 2 15 148 − 1 Please refer to the tables on pages 126–134 for a breakout of grade and tonnages by Mineral Resource category; all M&I categories are inclusive of Mineral Reserves 2 For Royalty Ounce calculation, Franco-Nevada estimates 100% of the Mineral Resources and Mineral Reserves at Yanacocha and Conga are subject to our royalty interest and estimates a rate of 1.8% (1.53% for copper Royalty Ounces which factors a NSR smelting charge of 15%). Copper has been converted to Royalty Ounces assuming $5.50/lb ($4.25/lb in 2024) and silver has been converted to Royalty Ounces assuming $4,500/oz gold and $75.00/oz silver ($2,800/oz gold and $31.00/oz silver in 2024) Franco-Nevada acquired the royalty in August 2024 from Compania de Minas Buenaventura S.A.A (“Buenaventura”). Yanacocha has been one of the largest gold producing operations globally, producing more than 40 Moz of gold since 1993 and continues to extensive resource base of 30 Moz gold equivalent M&I Mineral Resources and 13 Moz gold equivalent Inferred Mineral Resources. Production in 2025 was active from the remaining oxide operation and injection leaching. Newmont continues to have significant success with injection leaching and in 2025 exceeded their production guidance of 460 koz of gold, producing 515 koz of gold (which was 45% higher versus 2024 production). 2026 guidance is 460 koz of gold which is also ahead of the estimate at the time of acquisition. Newmont continues to focus on leach production at Yanacocha and has identified a capital-efficient plan to leverage current infrastructure to continue mining operations at the site through 2026 and into 2027, adding additional low-cost ounces to Newmont’s production profile in early 2027, with further upside potential. The Yanacocha Sulfides project has been indefinitely deferred, with Newmont prioritizing optimizing injection leaching and development of the surrounding projects such as the Conga (large Cu-Au porphyry) and Quilish (high-grade gold oxide resource) projects in Peru. Both projects are covered by Franco-Nevada’s 1.8% NSR royalty. While currently deferred, the large resource base of Yanacocha Sulfides remains a significant future growth contributor that could produce c.500k GEOs per year. Perol Amaro Challhuagon Quecher Main San Jose AOI Yanacocha La Quinua Corlmayo El Tapado Cerro Quilish Maqul Maqul Chaqulcocha UG Kupfertal porphyry Cu-Au-Mo Conga +0.5% NSR Quilish +1-2% NSR HS Epithermal Deposits Porphyry Deposits Royalty licenses kilometer 10 0 N Yanacocha 1.8% NSR Pacific Ocean Argentina Bolivia Peru Brazil Chile Yanacocha Perol Amaro Challhuagon Quecher Main San Jose AOI Yanacocha La Quinua Corlmayo El Tapado Cerro Quilish Maqul Maqul Chaqulcocha UG Kupfertal porphyry Cu-Au-Mo Conga +0.5% NSR Quilish +1-2% NSR HS Epithermal Deposits Porphyry Deposits Royalty licenses kilometer 10 0 N Yanacocha 1.8% NSR Pacific Ocean Argentina Bolivia Peru Brazil Chile Yanacocha S A L A R E S N O R T E Producing Location: Chile, South America | Operator: Gold Fields Limited | Precious Metals: Au & Ag | Royalty: NSR: 1–2% In early 2019, Franco-Nevada acquired an existing 2% NSR on the Salares Norte mine being operated by Gold Fields Limited (“Gold Fields”) in the Atacama region of Northern Chile. 2025 2024 2023 Revenue to Franco-Nevada ($ million) $ 13.2 $ 1.6 $ − M&I Resources (koz Au) 1 3,631 3,586 3,646 Inf. Resources (koz Au) 1 10 10 58 P&P Reserves (koz Au) 1 3,415 3,416 3,454 M&I Resources (Moz Ag) 1 48.8 44.1 44.6 Inf. Resources (Moz Ag) 1 0.1 0.1 0.5 P&P Reserves (Moz Ag) 1 46.0 41.9 42.2 M&I Royalty Ounces (000s) 1,2 44 41 42 Inf. Royalty Ounces (000s) 2 − − 1 P&P Royalty Ounces (000s) 2 42 39 39 1 Please refer to the tables on pages 126–134 for a breakout of grade and tonnages by Mineral Resource category; all M&I categories are inclusive of Mineral Reserves 2 For Royalty Ounce calculation, Franco-Nevada estimates 100% of the Mineral Reserves & Mineral Resources are subject to our royalty interest and estimates a rate of 1.0%. Silver has been converted assuming $4,500/oz gold and $75.00/oz silver ($2,800/oz gold and $31.00/oz silver in 2024, $1,950/oz gold and $22.50/oz silver in 2023) 3 Mineral Resource and Mineral Reserve as at December 31, 2025 was published after Franco-Nevada’s March 12, 2026 cut off date. Please note the table above shows the Mineral Resource and Reserve as at December 31, 2024 In May 2025, Gold Fields exercised its option to buyback 1% of Franco-Nevada’s 2% NSR on Salares Norte, after having paid $6.0 million in cumulative royalty payments since commencing production in Q2 2024. Franco-Nevada also acquired a separate 2% NSR on the Rio Baker concession covering the northwest extension of the deposit for $5.0 million in September 2020, with contingent payments of up to $8.0 million, providing full exposure to the Salares Norte project. Salares Norte is a blind epithermal gold-silver deposit and a key operation for Gold Fields. As of December 2025, reserves totaled 3.14 Moz of gold and 43.2 Moz of silver (19.9 Mt at 4.9 g/t gold and 67.1 g/t silver)³. Salares Norte achieved its first gold pour in March 2024, with the mine achieving commercial production in Q3 2025, ramping up to steady-state levels of production in Q4 2025. Production of 397,000 gold equivalent ounces was achieved in 2025, with output for 2026 forecast to be between 525k–550k GEOs. The 2019 feasibility study supported an 11-year open pit mine life. An underground option is also being studied at a prefeasibility level for the mining of the Agua Amarga deposit, the northern portion of the Salares Norte pit. Salares Norte, Chile High-grade gold sub-domains 2017 EIA pit outline Main low-grade domains Antofagasta La Serena Copiapo Relincho Chile Argentina BOLIVIA PERU San Jorge Taca Taca Salares Norte Brecha Principal Agua Amarga Salares Norte Rio Baker 1% NSR 2% NSR kilometer 1 0 Salares Norte 1–2% NSR N Oxide operations continue to outperform One of the largest gold producing districts globally 43 Moz AuEq in reserves and resources on the royalty property Several high quality projects providing significant upside Commercial production achieved in Q3 2025 Near-mine exploration success to potentially extend mine life The operator currently has a 9-year mine plan TSX / NYSE: FNV Franco-Nevada Corporation ★ 35 34 ★ Franco-Nevada Corporation TSX / NYSE: FNV South & Central America South & Central America
C E R R O M O R O Producing Location: Argentina, South America | Operator: Pan American Silver Corp. | Precious Metals: Au & Ag | Royalty: NSR: 2% Franco-Nevada has a 2% NSR on the Cerro Moro mine operated by Pan American Silver Corp. (“Pan American Silver”) in Santa Cruz province, Argentina. 2025 2024 2023 Revenue to Franco-Nevada ($ million) $ 4.4 $ 5.1 $ 5.2 M&I Resources (koz Au) 1 324 338 422 Inf. Resources (koz Au) 1 146 150 192 P&P Reserves (koz Au) 1 150 246 302 M&I Resources (Moz Ag) 1 13.4 13.8 19.5 Inf. Resources (Moz Ag) 1 3.5 3.6 4.9 P&P Reserves (Moz Ag) 1 5.0 7.5 11.3 M&I Royalty Ounces (000s) 1,2 10 9 12 Inf. Royalty Ounces (000s) 2 4 3 4 P&P Royalty Ounces (000s) 2 4 6 8 1 Please refer to the tables on pages 126–134 for a breakout of grade and tonnages by Mineral Resource category; all M&I categories are inclusive of Mineral Reserves 2 For Royalty Ounce calculation, Franco-Nevada estimates 95% of the Mineral Reserves (95% in 2024, 95% in 2023), 90% of the M&I Mineral Resources (90% in 2024, 90% in 2023) and 90% of the Inf. Mineral Resources (90% in 2024, 90% in 2023) are subject to our royalty interest and estimates a rate of 2.0% is applicable. Silver has been converted, assuming $4,500/oz gold and $75.00/oz silver ($2,800/oz gold and $31.00/oz silver in 2024, $1,950/oz gold and $22.50/oz silver in 2023) 3 Please refer to Yamana’s public disclosures for further details on its definition of gold equivalent ounces Pan American Silver acquired Cerro Moro in March 2023 as part of its acquisition of Yamana Gold Inc. (“Yamana”). The royalty covers 160 km 2 , including a significant portion of the mineral resources contained in high-grade epithermal gold and silver veins. The mine, which began commercial production in June 2018, produced 83,100 oz of gold and 2.51 Moz of silver in 2025, compared to 77,500 oz of gold and 3.0 Moz of silver in 2024. The production increase year-over-year, was driven by a planned transition into higher-grade gold ore zones. For 2026, production is forecasted to be between 80–86 koz of gold and 2.8–3.0 Moz of silver. Pan American Silver expects a recovery in silver output, driven by sequencing into high-grade underground zones, while maintaining stable gold production. Yamana’s prior plans targeted sustainable production of at least 160,000 GEOs annually with aspirations to exceed 200,000 GEOs³. Pan American Silver’s strategy focuses on shorter-term operational optimization and life extension through active exploration and tailings expansions. Pan America’s exploration spending for 2026 is specifically targeting Cerro Moro to extend mine life and discover new mineralized zones. kilometer 5 0 Cerro Moro 2% NSR Carla Michelle Zoe Deborah Martina Tres Lomas Esperanza Loma Escondida Escondida Nini Nini Ext Natalia Natalia NW Plant Buenos Aires Cerro Moro Chile Argentina Uruguay Elsa 2% NSR FNV Royalties Excluded from Royalty Deposits N Cerro Moro, Argentina C A S E R O N E S Producing Location: Chile, South America | Operator: Lundin Mining Corporation | Metals: Cu & Mo | Royalty: NSR: 0.517% Franco-Nevada holds an effective 0.517% NSR on the producing Caserones copper-molybdenum mine located in the Atacama Region of northern Chile. 2025 2024 2023 Revenue to Franco-Nevada ($ million) $ 5.4 $ 3.9 $ 5.8 M&I Resource (Mlbs Cu) 1 7,937 8,195 9,434 Inf. Resource (Mlbs Cu) 1 324 564 908 P&P Reserves (Mlbs Cu) 1 5,240 5,736 5,990 M&I Royalty Ounces (000s) 1,2 43 55 80 Inf. Royalty Ounces (000s) 2 2 4 8 P&P Royalty Ounces (000s) 2 28 38 51 1 Please refer to the tables on pages 126–134 for a breakout of grade and tonnages by Mineral Resource category; all M&I categories are inclusive of Mineral Reserves 2 For Royalty Ounce calculation, Franco-Nevada estimates 100% of the Mineral Resources and Mineral Reserves are subject to our royalty interest and estimates a rate of 0.4395% is applicable for the copper Royalty Ounces (which factors in a NSR smelting charge of 15%). Copper has been converted to Royalty Ounces assuming $5.50/lb ($4.25/lb in 2024, $3.75/lb in 2023) Through a series of transactions in 2022 and 2023 Franco-Nevada acquired a 0.517% NSR for a net cost of $42.3 million. Caserones is an open pit mine which began operation in 2013, following a capital investment of approximately US$4.2 billion. Lundin Mining acquired a 75% interest in Caserones via three transactions in 2023, 2024 and 2026. On March 27, 2023, Lundin Mining announced that it had entered into a binding purchase agreement to acquire 51% of the outstanding equity of SCM Minera Lumina Copper Chile (“Lumina Copper”), a wholly owned subsidiary of JX Nippon Mining & Metals Corporation of Japan, and subsequently increased their interest to 70% in 2024, and 75% in 2026. The mine is located approximately 125 km southeast of Copiapó, 9 km from the border with Argentina and is situated at an elevation ranging between 3,200 meters and 5,500 meters above sea level. The porphyry copper-molybdenum deposit is located within a large land package, of which the royalty covers ~170 km 2 . The asset produces copper and molybdenum concentrates from a conventional crusher, mill and flotation plant, as well as copper cathode from a dump leach, solvent extraction and electrowinning plant (“SX-EW”). Historically, the processing facilities have historically produced approximately 100–110 kt of copper in concentrate, 1,700–2,500 tonnes of molybdenum in concentrate and approximately 15–25 kt of copper cathodes per year. Since acquiring Caserones, Lundin Mining has focused on optimizing the operations to increase production and reduce costs. Lundin produced 133 kt of copper in 2025 (on a 100% basis) surpassing guidance and in Q4 2025, achieved its highest quarterly production since Lundin’s acquisition. Furthermore, Lundin issued guidance for 130–140 kt of copper in 2026 (on a 100% basis) with improvements in annual cathode production by 6–8 kt in 2026 and 2027 vs. prior levels and they plan to carry out an 18,000 meter drill program on their large land package. Lundin is planning a 39,800 meter drill program at Caserones with a focus on the Angelica deposit to support a maiden Mineral Resource estimate next year. Caserones, Chile 1 Grants the title holder the right to perform mining operations and to extract ore 2 Grants the title holder the right to explore exclusively a determined area for a specified amount of time Caserones 0.517% NSR Chile Caserones Mine Argentina N Arica Iquique Antofagasta Santiago Copiapo Relincho Chile Argentina Bolivia Peru Candelaria Marte-Lobo Jose Maria Los Helados Cerro Casali Andacollo Regalito Caserones Pacific Ocean Chile Exploitation 1 Concession Exploration 2 /Exploitation 1 Concession Caserones Royalty AOI 0.517% NSR kilometer 10 0 N High grade gold/silver deposit with expansion potential Significant near-mine and regional exploration targets M&I Resources could support production for 4 years and Inf. Resources for a further 2 years Large scale and long–life copper mine in Chile Large land package and aggressive exploration program The operator currently has a 17-year mine plan. M&I Resources could support production for 36 years, with Inf. Resources for a further 2 years TSX / NYSE: FNV Franco-Nevada Corporation ★ 37 36 ★ Franco-Nevada Corporation TSX / NYSE: FNV South & Central America South & Central America
P O S S E ( M A R A R O S A ) Producing Location: Brazil, South America | Operator: Hochschild Mining PLC | Precious Metals: Au | Royalty: NSR: 1% Franco-Nevada holds a 1% NSR royalty on the Mara Rosa open pit project located in the State of Goiás, Brazil. Hochschild Mining PLC (“Hochschild”) took ownership of the project through its acquisition of Amarillo Gold Corporation (“Amarillo”) in 2022. Commercial production of the mine was achieved in May 2024 and Mara Rosa is expected to produce between 67–80 koz of gold in 2026. Overall production in 2025 was 40,062 GEOs, well below the original guidance due to heavy seasonal rainfall and contractor performance issues that restricted access to high-grade ore zones. Hochschild expects average annual production of approximately 80 koz of gold with the current mine life estimated to extend beyond 2030. Recent exploration at the Posse belt has successfully identified new mineralization beneath the existing open pit. Hochschild is also evaluating a 20 km structural corridor including the Posse, Araras, and Speti structures to further extend the life of mine. M&I Resources could support production for 15 years and Inf. Resources for a further 3 years. For Royalty Ounce calculation, Franco-Nevada estimates 100% of Mineral Resources and Mineral Reserves are subject to our royalty interest and estimates an average rate of 1.0% is applicable T A C A T A C A Advanced Location: Argentina, South America | Operator: First Quantum Minerals Ltd. | Metals: Cu, Au & Mo | Royalty: NSR: 1.08% Franco-Nevada has a 1.08% NSR royalty on all copper, gold and molybdenum produced from Taca Taca which was acquired through the acquisition of Lumina Royalty Corp. in December 2011. The royalty is subject to a buyback provision based on the value of the reserves. 2025 2024 2023 Revenue to Franco-Nevada ($ million) $ − $ − $ – M&I Resource (Mlbs Cu) 1 19,215 20,835 20,835 Inf. Resource (Mlbs Cu)1 858 4,863 4,863 P&P Reserves (Mlbs Cu) 1 18,582 17,052 17,052 M&I Royalty Ounces (000s) 1,2 277 356 368 Inf. Royalty Ounces (000s) 2 12 81 86 P&P Royalty Ounces (000s) 2 268 293 301 1 Please refer to the tables on pages 126-134 for a breakout of grade and tonnages by Mineral Resource category; all M&I categories are inclusive of Mineral Reserves 2 For Royalty Ounce calculation, Franco-Nevada estimates 100% of the Mineral Resources and Mineral Reserves are subject to our royalty interest and estimates a rate of 0.918% is applicable for the copper Royalty Ounces (which factors in a NSR smelting charge of 15%). Copper has been converted to Royalty Ounces assuming $5.50/lb ($4.25/lb in 2024, $3.75/lb in 2023) The property hosts a very large copper-gold-molybdenum porphyry system and is located in the Puna region of northwestern Argentina in Salta Province, 230 km west of the provincial capital of Salta. The royalty is subject to a buyback provision. In February 2026, First Quantum filed an updated NI 43-101 technical report with an updated Mineral Reserve of 8.4 Mt of contained copper (2 billion tonnes at copper grade of 0.42%). The technical report considers an open pit mine plan and flotation processing of copper ore for 35 years, with an initial processing capacity of 40 Mtpa and an expansion to 60 Mtpa commencing in the fifth year of operation. It is estimated that the expansion will take three years to complete. Taca Taca is expected to produce 209 kt of copper per annum over its 35-year mine life (with higher production in the first 10 years of 291 kt of copper per annum). The M&I Mineral Resource (inclusive of Mineral Reserves) is 2.1 Bt at 0.42% copper, and contains 8.7 Mt of copper, 253 kt of molybdenum and 5.7 Moz of gold. First Quantum is continuing to de-risk Taca Taca, including completion of the Environmental and Social Impact Assessment (“ESIA”) in the first half of 2026 and an application to the Argentina Incentive Regime for Large Investments (“RIGI”), which provides special foreign exchange provisions and tax and customs incentives, focusing on predictability, stability, and legal certainty across various sectors, including mining. First Quantum expects to conclude the ESIA process in H1 2026 following the completion of the public consultation. ESIA work is ongoing related to the power line, bypass and access road and groundwater catchments. Taca Taca 1.08% NSR kilometer 5 0 N First Quantum 2020 Technical Report Ultimate Pit Design N Arica Iquique Antofagasta La Serena Copiapo NuevaUnión (Relincho) Bolivia Peru Argentina Taca Taca Pacific Ocean Royalty Area 1.08% NSR 1.08% NSR Large porphyry deposit with reserve of over 8.4 Mt of contained copper and 5.5 Moz of Au Potentially First Quantum’s next development project Pre-development and permitting work underway The operator currently has a 35-year mine plan. M&I Resources could support production for 36 years, with Inf. Resources for a further 2 years TSX / NYSE: FNV Franco-Nevada Corporation ★ 39 38 ★ Franco-Nevada Corporation TSX / NYSE: FNV South & Central America South & Central America
C A S C A B E L ( A L P A L A ) Advanced Location: Ecuador, South America | Operator: Jiangxi Copper Company Limited | Precious Metals: Au, Cu, Ag | Stream: Gold Stream | Royalty: NSR: 0.5% In 2020, Franco-Nevada acquired a 1% NSR on the Cascabel copper-gold-silver project located in northern Ecuador being advanced by JCC for $100 million. In July 2024, FNIC announced an additional $525 million precious metals stream with reference to the Cascabel project. 2025 2024 2023 Revenue to Franco-Nevada ($ million) $ − $ − $ − M&I Resources (Mlbs Cu)¹ 27,397 27,337 27,337 Inf. Resources (Mlbs Cu)¹ 4,339 4,409 4,409 P&P Reserves (Mlbs Cu)¹ 7,128 7,128 7,055 M&I Resources (koz Au) 1 31,400 31,200 31,200 Inf. Resources (koz Au) 1 5,300 5,400 5,400 P&P Reserves (koz Au) 1 9,433 9,433 9,400 M&I Resources (Moz Ag) 1 91.3 91.3 91.3 Inf. Resources (Moz Ag) 1 11.0 11.0 11.0 P&P Reserves (Moz Ag) 1 28.0 28.0 28.0 M&I Royalty Ounces (millions) 1,2,3 1,247 2,527 769 Inf. Royalty Ounces (millions) 2,3 175 366 127 P&P Royalty Ounces (millions) 2,3 510 1,018 213 1 Please refer to the tables on pages 126–134 for a breakout of grade and tonnages by Mineral Resource category; all M&I categories are inclusive of Mineral Reserves 2 For Royalty Ounce calculation for the royalty, Franco-Nevada estimates 100% of the Mineral Resources and Mineral Reserves are subject to our royalty interest and estimates a rate of 0.5% (1.0% pre buyback in 2024 and 2023) and 0.425% for copper Royalty Ounces which factors a NSR smelting charge of 15% (0.85% pre buyback in 2024 and 2023). Copper has been converted to Royalty Ounces assuming $5.50/lb ($4.25/lb in 2024, $3.75/lb in 2023), gold and silver has been converted to Royalty Ounces assuming $4,500/oz gold and $75.00/ oz silver ($2,800/oz gold and $31.00/oz silver in 2024, $1,950/oz gold and $22.50/oz silver in 2023) 3 For Royalty Ounce calculation for the gold stream, Franco-Nevada estimates 100% of the Mineral Resources and Mineral Reserves are subject to our stream interest and estimates it will receive 7.0% of the gold produced in concentrate until 262,500 ounces of gold have been delivered, and thereafter 4.2% of the gold produced in concentrate for the remaining life of mine. The stream interest has been factored by ongoing payments of 20% of the spot price of gold ($4,500/oz in 2025, $2,800/oz in 2024) Franco-Nevada’s royalty and stream covers nearly 50 km 2 of the Cascabel mining concessions including the Alpala and the Tandayama-America (“TAM”) deposit. Alpala, the main target in the Cascabel concession, is a copper-gold porphyry deposit and represents one of the largest copper-gold projects being advanced globally. Following a successful acquisition of SolGold plc (“SolGold”) by Jiangxi Copper Company Limited (“JCC”), JCC exercised their option to buyback 50% of the Cascabel Stream and 50% of the Cascabel NSR. As a result, in March 2026, Franco-Nevada received the equivalent of approximately $40.7 million (net of the ongoing payment) as a one-time delivery of gold ounces for the buyback of 50% the Cascabel Stream, and received approximately $97.5 million in cash for the buyback of 50% of the Cascabel NSR. At the time of the acquisition, Franco-Nevada had funded $46.7 million for the Cascabel Stream. Following the buybacks, key terms of the Cascabel Stream and NSR include: • 0.5% Royalty: The royalty references all minerals produced with the option for Franco-Nevada to convert the royalty to a gold NSR for a period of time once Alpala is producing. Franco-Nevada is further entitled to receive minimum royalty payments starting in 2028 of $5.0 million, subject to certain conditions. The royalty rate is also subject to an adjustment mechanism with reference to certain production thresholds. • Gold Stream: Franco-Nevada originally partnered with Osisko Bermuda Limited (“Osisko”) to provide a $750 million syndicated financing package to SolGold, on a 70%/30% basis. Following the 50% buyback, Franco-Nevada will provide a total of $262.5 million and Osisko a total of $112.5 million of funding. Franco-Nevada will provide pre-construction funding of $35 million and Osisko $15 million of which the first two tranches have been funded with the final tranche, subject to development milestones. Franco-Nevada and Osisko will make the remaining funding available towards construction once the project is fully funded and further derisked, including a minimum equity commitment. • Franco-Nevada will receive attributable gold deliveries equal to 7.0% of gold produced in concentrate until 262,500 oz of gold have been delivered. Thereafter, 4.2% of gold produced in concentrate for the remaining life of mine. JCC will receive 20% of the spot gold price for each ounce of gold delivered. In February 2024, SolGold announced an updated prefeasibility study on the Cascabel project for the Alpala deposit (the “2024 PFS”). The 2024 PFS contemplates a phased underground block cave and outlined a Mineral Reserve containing 9.4 Moz of gold, 3.2 Mt of copper, and 28.0 Moz of silver (540 Mt at 0.54 g/t gold, 0.60% copper and 1.6 g/t silver), for an initial 28-year mine life and reflects the exploitation of only 18% of the Alpala M&I Resource. The initial capital cost has decreased compared to previous scenarios, as the phased approach gradually scales up operations to achieve a production rate of 12 Mtpa expanding to 24 Mtpa in year six of the mine life, and will extract high-grade ore, averaging approximately 1.45% copper equivalent for the first ten years of production. Average production of approximately 123 kt of copper, 277 koz of gold and 794 koz of silver per year is expected over the life of the project. JCC has indicated that it plans to complete its own technical and economic optimization studies ahead of any construction decision. Exploration has yielded encouraging results on the broader Cascabel concessions with the identification of a highly mineralized system at TAM, which is located approximately 6 km northeast of the Alpala deposit, offering an excellent opportunity to provide additional mill feed and the potential for an initial open pit. The Stream would provide meaningful GEO growth while increasing Franco-Nevada’s precious metal exposure and total asset diversification. Based on the 2024 PFS, stream and royalty contributions to Franco- Nevada are expected to average approximately 30,000 GEOs per year over the first 10 years of full production. 0.4% Copper Equivalent 1.0% Copper Equivalent Royalty Claim Area 0.1% Copper Equivalent Pacific Ocean Argentina Bolivia Peru Brazil Colombia Chile Cascabel Ecuador Alpala Rocafuerte Alpala Camp Tandayama America Frontier Transverse Hwy Aguinaga Site Office 0.5% NSR Cascabel (Alpala) Gold Stream 0.5% NSR kilometer 1 0 N Alpala Cross Section - Looking West Alpala Upper Zone S High-grade core Alpala Northwest Alpala Deeps 3Bt M&I 10.7 Mt Cu @ 0.35% 26.8 Moz Au @ 0.28 g/t 91.3 Moz Ag @ 0.94 g/t 540 Mt Reserves 3.2 Mt Cu @ 0.6% 9.4 Moz Au @ 0.54 g/t 28 Moz Ag @ 1.6 g/t N >0.70% Cu Eq >1.50% Cu Eq >0.15% Cu Eq +1500 m +1250 m +1000 m +750 m +500 m +250 m 0 m -250 m -500 m -750 m +1500 m +1250 m +1000 m +750 m +500 m +250 m 0 m -250 m -500 m -750 m One of the largest copper-gold development projects in the world Underexplored land package with anomalies identified on the concession Most recent operator mine life of 28 years which represents only 18% of M&I Resources TSX / NYSE: FNV Franco-Nevada Corporation ★ 41 40 ★ Franco-Nevada Corporation TSX / NYSE: FNV South & Central America South & Central America
C O B R E P A N A M Á Advanced Location: Panama, Central America | Operator: First Quantum Minerals Ltd. | Precious Metals: Au & Ag | Stream: Gold and Silver Cobre Panamá is one of the world’s largest copper-gold-silver porphyry mines and is 90% owned by First Quantum Minerals Ltd. (“First Quantum”) and 10% by Korea Mine Rehabilitation & Mineral Resources Corp. (“KOMIR”). 2025 2024 2023 Revenue to Franco-Nevada ($ million) $ 38.3 $ 0.1 $ 248.9 M&I Resources (koz Au) 1,2 Inf. Resources (koz Au) 1,2 P&P Reserves (koz Au) 1,2 M&I Resources (Moz Ag) 1,2 Inf. Resources (Moz Ag) 1,2 P&P Reserves (Moz Ag) 1,2 M&I Royalty Ounces (000s) 2,3 Inf. Royalty Ounces (000s) 3 P&P Royalty Ounces (000s) 3 1 Cobre Panamá has been a material mining project in prior years but is currently on Preservation and Safe Management. Due to the status of Cobre Panamá, Mineral Resources and Mineral Reserves are being reported separately and are not included in the Mineral Resources and Mineral Reserves table 2 Please refer to the tables on page 134 for a breakout of grade and tonnages by Mineral Resource category for Cobre Panamá as at December 31, 2025; all M&I categories are inclusive of Mineral Reserves 3 For 2025, Franco-Nevada estimates that P&P royalty ounces, M&I royalty ounces and Inf royalty ounces would be 2,324 koz, 2,635 koz and 404 koz, respectively (4,153 koz, 4,738 koz and 736 koz, respectively in 2024 and 4,468 koz, 4,673 koz and 745 koz, respectively in 2023) assuming $4,500/oz gold and $75.00/oz silver ($2,800/oz gold and $31.00/oz silver, $1,950/oz gold and $22.50/oz silver in 2023). For 2025 Royalty Ounce calculation, Franco-Nevada assumed an estimated gold recovery rate of 56% and an estimated silver recovery rate of 48% and has estimated that approximately 77% of the gold and 84% of the silver Mineral Resources and Mineral Reserves are subject to our stream interest. The stream interest has been factored by different ongoing payments and a 72% factor was applied to obtain a Royalty Ounce for the P&P category, a 68% factor was applied for Royalty Ounces in the M&I category and a 50% factor was applied for Royalty Ounces in the Inf. category FNIC, a wholly owned subsidiary of Franco-Nevada, contributed a total of $1.36 billion to the construction of Cobre Panamá since 2015. Franco-Nevada has two precious metals streams on Cobre Panamá. Each stream has slightly different terms as described below but both streams are indexed to the copper in concentrate shipped until certain specific thresholds of gold and silver deliveries are met: • Fixed Payment Stream – Effective since 2015 and applies to First Quantum’s original 80% interest in Cobre Panamá. The ongoing payment is $457.35 oz of gold and $6.86 oz of silver with a 1.5% annual inflation factor. • Floating Payment Stream – Effective March 2018, FNIC added a new precious metals stream which increased its coverage to 100% of the ownership of the Cobre Panamá operation. The Floating Payment Stream applies to First Quantum’s 10% indirect interest acquired from LS-Nikko Copper Inc. and KOMIR’s 10% indirect interest. The ongoing payment is 20% of the spot price for the Mineral Reserve life as of 2018 and higher thereafter. Cobre Panamá commenced production in February 2019. In 2023, Cobre Panamá produced approximately 330 kt of copper and achieved record copper production to the end of October before ramping down operations in November. Franco-Nevada sold 128,599 GEOs from the mine in 2023, compared to 123,769 GEOs in 2022. In October 2023, the National Assembly of Panama approved a revised concession contract for the Cobre Panamá mine through a new law, Law 406. Following this approval, widespread protests occurred in Panama resulting in the National Assembly enacting an indefinite mining moratorium in Panama. In late November 2023, the Supreme Court of Justice of Panama declared Law 406 unconstitutional and stated that the effect of the ruling was that the revised concession contract purportedly no longer existed. In November 2023, the mine was placed on preservation and safe management (“P&SM”). In July 2024, a new government under President Mulino took office. President Mulino has stated his government will discuss the mine’s long-term future including an environmental audit of the Cobre Panamá mine. First Quantum discontinued their ICC arbitration proceedings and suspended their FTA arbitration on March 31, 2025, and Franco-Nevada agreed to suspend its arbitration proceeding on June 18, 2025. On May 30, 2025, the Government of Panamá (the “GOP”) approved and formally instructed the execution of the P&SM plan for Cobre Panamá, authorized the import of fuel and the restart of Cobre Panamá’s power plant, and authorized the export of the 122,520 dry metric tonnes of copper concentrate that had been stored at site since the suspension of operations. As a result Franco-Nevada received 11,208 GEOs in stream deliveries in 2025 and approximately 935 GEOs subsequent to year-end, in February 2026. In October 2025, Panamá’s Ministry of Environment (“MiAmbiente”) issued the order for SGS Global to proceed with the integral audit of Cobre Panamá, covering environmental, social, legal, and fiscal compliance aspects of the mine. The audit is anticipated to be concluded in Q2 2026. On April 7, 2026, the GOP approved the removal, processing and export of approximately 38 Mt of stockpiled ore at the Cobre Panamá mine that was extracted prior to the suspension of operations. First Quantum estimates that processing of the stockpiles could commence three months after receiving official regulatory approval, would require one year to process, and is expected to produce approximately 70 kt of copper which would result in the delivery of approximately 23,100 gold oz and 265,000 silver oz to Franco-Nevada in H2 2026 and 2027. Timing of the receipt of such deliveries will depend on First Quantum’s processing schedule which will be carried out in close coordination with the GOP and in compliance with the approved P&SM. Cobre Panamá Gold and Silver Stream kilometer 4 0 N Concession Boundary Pits Camp Caribbean Sea Punta Rincón River Caimito Plant Site Concession Boundary Power Transmission 230 kv line Port and Powerplant Balboa Pit Colina Pit Valle Grande Pit Botija Pit Brazo Pit Medio Pit Botija Abajo Pit Cobre Panamá Panama City Panama Canal Pacific Ocean Caribbean Sea Concession Boundary Pits Camp Plant Site Concession Boundary Power Transmission 230 kv line Balboa Pit Colina Pit Valle Grande Pit Botija Pit Brazo Pit Medio Pit Botija Abajo Pit Cobre Panamá Panama City Panama Canal Pacific Ocean Caribbean Sea Cobre Panamá Gold and Silver Stream kilometer 4 0 N Concession Boundary Pits Camp Caribbean Sea Punta Rincón River Caimito Plant Site Concession Boundary Power Transmission 230 kv line Port and Powerplant Balboa Pit Colina Pit Valle Grande Pit Botija Pit Brazo Pit Medio Pit Botija Abajo Pit Cobre Panamá Panama City Panama Canal Pacific Ocean Caribbean Sea Floating Payment Stream Summary Terms: Delivery Period 1 Delivery Period 2 Delivery Period 3 Au oz delivered 0 to 202,000 202,001 to 429,047 > 429,047 Delivery terms 30 oz Au per 1 mm lbs Cu 20.25 oz Au per 1 mm lbs Cu 15.8% of Au in concentrate Ag oz delivered 0 to 2,460,500 2,460,501 to 7,432,750 > 7,432,750 Delivery terms 344 oz Ag per 1 mm lbs Cu 444 oz Ag per 1 mm lbs Cu 15.5% of Ag in concentrate Ongoing Payment The ongoing payment for deliveries will be 20% of the spot price of gold and silver until 604,000 oz of gold and 9,618,000 oz of silver have been delivered. Thereafter, the ongoing payment will increase to 50% of the spot price of gold and silver. Fixed Payment Stream Summary Terms: Delivery Period 1 Delivery Period 2 Delivery Period 3 Au oz delivered 0 to 808,000 808,001 to 1,716,188 > 1,716,188 Delivery terms 120 oz Au per 1 mm lbs Cu 81 oz Au per 1 mm lbs Cu 63.4% of Au in concentrate Ag oz delivered 0 to 9,842,000 9,842,001 to 29,731,000 > 29,731,000 Delivery terms 1,376 oz Ag per 1 mm lbs Cu 1,776 oz Ag per 1 mm lbs Cu 62.1% of Ag in concentrate Ongoing Payment The ongoing payment for deliveries will be based on a fixed gold and silver price (subject to inflation adjustment) until 1,341,000 oz of gold and 21,510,000 oz of silver have been delivered. Thereafter, the ongoing payment will be the greater of the fixed price or 50% of the spot price of gold and silver. Before production halt, employed 7,000 workers and contributed 5% of Panama’s GDP Potential to be one of the largest copper producers (approx. 1.5% of global production) Assuming a return to full production, Cobre Panamá could contribute 150k–175k GEOs per year TSX / NYSE: FNV Franco-Nevada Corporation ★ 43 42 ★ Franco-Nevada Corporation TSX / NYSE: FNV South & Central America South & Central America
N U E V A U N I Ó N ( R E L I N C H O ) Advanced Location: Chile, South America | Operator: Teck Resources Limited / Newmont Corporation | Metals: Cu, Au & Mo | Royalty: NSR: 1.5% Franco-Nevada has a 1.5% NSR royalty covering the Relincho property that is part of the NuevaUnión project being advanced by 50/50 joint venture partners, Teck and Newmont. 2025 2024 2023 Revenue to Franco-Nevada ($ million) $ − $ − $ − M&I Resources (Mlbs Cu) 1 15,980 16,068 16,068 Inf. Resources (Mlbs Cu) 1 5,752 5,752 5,752 P&P Reserves (Mlbs Cu) 1 11,989 12,078 12,078 M&I Royalty Ounces (000s) 1,2 218 273 346 Inf. Royalty Ounces (000s) 2 90 111 141 P&P Royalty Ounces (000s) 2 156 196 248 1 Please refer to the tables on pages 126–134 for a breakout of grade and tonnages by Mineral Resource category; all M&I categories are inclusive of Mineral Reserves 2 For Royalty Ounce calculation, Franco-Nevada estimates 100% of the Mineral Resources and Mineral Reserves are subject to our royalty interest and estimates a rate of 1.275% (which factors a NSR smelting charge of 15%) and excludes the first four years of production from estimates. Copper has been converted to Royalty Ounces assuming $5.50/lb ($4.25/lb in 2024, $3.75/lb in 2023) The NuevaUnión project was formed in 2015 combining Teck’s Relincho project with Newmont’s La Fortuna (formerly El Morro) deposit, located approximately 40 km apart in the Atacama region of Chile. Franco-Nevada’s 1.5% NSR is subject to a maximum price of $6.00/lb copper and threshold price of $1.50/lb copper, inflation adjusted. No royalty is paid if the average price for the quarter is less than the threshold price and royalty payments commence four years after commercial production. Franco-Nevada acquired the royalty through its acquisition of Lumina Royalty Corp. in December 2011. Anglo American and Teck Resources agreed to a merger in September 2025, which is expected to close later this year. NuevaUnión is one of the largest undeveloped copper-gold-molybdenum projects in the Americas. A preliminary economic assessment disclosed by Teck in 2015 contemplated a conveyor to transport ore from the La Fortuna site to a single line mill and concentrator facility at the Relincho site. A 2018 prefeasibility study outlined a 36-year mine life, with a three-phase development approach assuming life of mine average production of 251 kt of copper equivalent production. Phase 1 (Years 1, 2 and 3) would see mining and a processing facility at the Relincho site assuming processing of 104 ktpd. In Phase 2 (Years 4 to 18), mining activities transfer back to Relincho with an expansion to the processing facilities increasing processing to 208 ktpd. A feasibility study was also completed in 2020, with further optimization work conducted. Work in 2025 advanced select technical and strategic activities, which will continue in 2026 with a focus on establishing a cost-effective path forward. Community engagement and investment activities will continue in 2026. NuevaUnión (Relincho), Chile Royalty Area Proposed Pit Iquique Antofagasta La Serena Santiago Copiapo Relincho Chile Argentina Chile Bolivia Candelaria Marte-Lobo El Morro El Alto Cerro Casali Andacollo Regalito Pacific Ocean Proposed Mill NuevaUnión (Relincho) 1.5% NSR kilometer 10 0 N 1.5% NSR C E N T R O G O L D ( G U R U P I ) Advanced Location: Brazil, South America | Operator: G Mining Ventures Corp. | Precious Metals: Au | Royalty: NSR: 0–1% Franco-Nevada holds a sliding scale NSR royalty (1% at greater than $400/oz gold) on the CentroGold (Gurupi) project located in the State of Maranhão in northern Brazil. G Mining Ventures acquired CentroGold (Gurupi) from BHP Group Limited (“BHP”) in 2024. The Gurupi Project, located in northeastern Brazil, has an Indicated Resource of 43.5 Mt at 1.3 g/t for 1.83 Moz of gold and Inf. Resource of 18.5 Mt at 1.3 g/t for 770 koz of gold, as of December 2025. The 2026 exploration budget for Gurupi totals $21 million, supporting resource definition drilling, resumption of regional exploration and advancement of the Environmental and Social Impact Assessment (“ESIA”), which is expected to be filed in H2 2026. In addition, G Mining Ventures anticipates publishing an updated resource and complete a PEA in H2 2026. A prefeasibility study, completed in July 2019 by Oz Minerals Limited, the prior owner before selling to BHP in 2023, envisioned a 10-year mine life with average annual gold production of 100–120 koz of gold per year with 190–210 koz of gold per year in the first two years of production. For Royalty Ounce calculation, Franco-Nevada estimates 100% of Mineral Resources and Mineral Reserves are subject to our royalty interest and estimates an average rate of 1.0% is applicable P S J C O B R E M E N D O C I N O Advanced Location: Argentina, South America | Operator: Zonda Metals GmbH & Alberdi Energy | Precious Metals: Au | Royalty: NSR: 7.5% on Au PSJ Cobre Mendocino (formerly San Jorge) is a copper-gold porphyry project located in west-central Argentina, in the province of Mendoza approximately 110 km northwest of the provincial city of Mendoza and 240 km northeast of Santiago, Chile. In April 2015, Aterra Investments Ltd. and Solway Industries Ltd. acquired the property from Coro Mining Corp. In Q1 2025, Zonda Metals GmbH and Alberdi Energy acquired control of the project and are re-evaluating the project scope under Argentina’s large investment incentive regime (RIGI), which offers tax benefits and foreign exchange stability for 30 years, among other advantages. The mine is expected to produce 40 kt of copper concentrates annually over a 16-year life and contemplates an initial capital investment of approximately $559 million. In December 2025, the project EIS was approved, leading the way for an updated feasibility study which is expected in late 2026. Construction is contemplated to begin in 2027, requiring an estimated 18 to 24 months, with initial production planned for 2029. Franco-Nevada received annual minimum payments of $1.25 million per year for a 10-year period which ended in 2021 and maintains a 7.5% NSR on all gold produced from the property, having acquired the royalty through its acquisition of Lumina Royalty Corp. in December 2011. For Royalty Ounce calculation, Franco-Nevada estimates 100% of gold Mineral Resources and Mineral Reserves are subject to our royalty interest and estimates an average rate of 7.5% is applicable C A L C A T R E U Advanced Location: Argentina, South America | Operator: Patagonia Gold Corp. | Precious Metals: Au & Ag | Royalty: NSR: 2.5% Franco-Nevada has a 2.5% NSR on the Calcatreu property located in the Province of Rio Negro in Argentina. In December 2017, Patagonia Gold Corp. (“Patagonia Gold”) acquired the property from Pan American Silver. The Calcatreu deposit contains an Indicated Mineral Resource of 9.8 Mt at 2.1 g/t gold and 19.8 g/t silver for 669 koz of gold and 6.3 Moz of silver and an Inf. Mineral Resource of 8.1 Mt at 1.3 g/t gold and 13.1 g/t silver for 348 koz of gold and 3.4 Moz of silver. Following the receipt of final permits in Q4 2024, Patagonia Gold commenced construction of the Calcatreu heap leach facility in the first quarter of 2025. Mining activities began in August 2025 with topsoil removal, followed by the first production blast in September 2025. As of March 2026, leaching activities began following the completion of construction, commissioning of key infrastructure including the carbon-in-column (CIC) circuit, and the placement of mineralized material on the heap leach pad. During the second and third quarters of 2025, Patagonia Gold completed over 1,770 meters of core drilling across the Belen, Lucy, Nelson Central, and NVS targets to test for near-mine mineralization extensions and an updated technical report is scheduled for release in the second quarter of 2026. M&I Resources could support production for 15 years and Inf. Resources for a further 8 years. For Royalty Ounce calculation, Franco-Nevada estimates 100% of Mineral Resources and Mineral Reserves are subject to our royalty interest and estimates an average rate of 2.5% is applicable. Silver has been converted assuming $4,500/oz gold and $75.00/oz silver One of the largest undeveloped Cu-Au-Mo projects in the Americas Joint venture combines Relincho and La Fortuna to one project Project synergies to significantly reduce capital expenditure The operator currently has a 36-year mine plan. Inf. Resources could support an additional 3 years of production TSX / NYSE: FNV Franco-Nevada Corporation ★ 45 44 ★ Franco-Nevada Corporation TSX / NYSE: FNV South & Central America South & Central America
V I Z C A C H I T A S Advanced Location: Chile, South America | Operator: Los Andes Copper Limited | Metals: Cu, Mo & Ag | Royalty: NSR: 0.51% –2% Vizcachitas is located in the Andes in Central Chile at low altitude and in the same region as a number of other large porphyry deposits. Franco-Nevada has a 0.51%–2% NSR encompassing a 230 km 2 area. Los Andes Copper is developing its 100% owned Vizcachitas copper- molybdenum project in Valparaiso, within Chile’s prolific central copper belt. Vizcachitas is expected to be one of Chile’s next major copper mines, currently hosting Mineral Reserves of 9.6 billion pounds of copper and 365 Mlbs of molybdenum (1,220 Mt at 0.36% Cu and 136 ppm Mo). A pre-feasibility study was completed in February 2023, targeting a 26-year mine life producing approximately 335 Mlbs of copper per annum (with higher production of approximately 400 Mlbs of copper per annum for the first 8 years). Los Andes Copper is advancing the project, with potential first production in 2031. Franco-Nevada holds an effective 1.02% open pit NSR and 0.51% underground NSR covering the San Jose core claim of the Vizcachitas Project, and also holds a 2% open pit NSR and 1% underground NSR on certain concessions that form part of the extended Vizcachitas Project. For Royalty Ounce calculation, Franco-Nevada estimates 100% of the Mineral Resources and Mineral Reserves are subject to our royalty interest and estimates a rate of 0.87% is applicable for the copper Royalty Ounces (which factors in a NSR smelting charge of 15%). Copper has been converted assuming $4,500/oz gold and $5.50/lb copper Courageous Lake Goldfields Canadian Malartic Cariboo Eagle Red Mountain Valentine Gold Monument Bay Brucejack Eskay Creek Island Gold Musselwhite Hemlo Greenstone Detour Lake Timmins West Porcupine Sudbury Macassa (Kirkland Lake) Golden Highway Red Lake (McFinley) Magino Ontario Ontario Ring of Fire Crawford Carol Lake Producing Advanced Exploration Producing Advanced Exploration Mining Assets Precious Metals Diversified Casa Berardi Côté Gold Wawa Kerr-Addison Spences Bridge (Westhaven) Scottie Redstone (Coates Lake) Fenelon Martiniere New Prosperity AurMac Canada E L A L T O Exploration Location: Chile, South America | Operator: Barrick Gold Corporation | Metals: Au & Cu | Royalty: NSR: 2.941% (Au) / 0.588% (Cu) Franco-Nevada has a 2.941% NSR (Au) / 0.588% NSR (Cu) on the Chilean portion of Barrick’s El Alto project (formerly Pascua-Lama) which straddles the border between Chile and Argentina. Barrick’s El Alto project is one of the largest gold endowments globally, with 21 million gold ounces of M&I Resources (433 Mt at 1.53 g/t gold). Barrick received an exploration permit in January 2026 approving a two-year, $35 million exploration program at El Alto (consisting of 63 boreholes), with work expected to commence after Q2 2026. For Royalty Ounce calculation, Franco-Nevada estimates 80% of the gold Mineral Resources and Mineral Reserves are subject to our royalty interest and estimates a rate of 2.941% is applicable V O L C A N Advanced Location: Chile, South America | Operator: Tiernan Gold Corporation | Precious Metals: Au | Royalty: NSR: 1.5–3% Franco-Nevada has a 1.5% NSR on the entire 530 km 2 land package, and an incremential 1.5% NSR on the exploration concessions. Volcan is a large high-quality resource with 9.8 Moz of gold M&I Resources (463 Mt at 0.66 g/t gold) and 1.2 Moz of gold Inf. Resources (75 Mt at 0.52 g/t gold) located in the prolific Maricunga Gold Belt which hosts a number of operating mines with over 100 Moz of gold of past and present gold resources. Hochschild Mining spun the asset into Tiernan Gold Corporation (“Tiernan”) in 2022 and Tiernan achieved a public listing through an RTO transaction, which Franco-Nevada contributed C$5 million to, in December 2025. The transaction provided C$53M in cash that supports Tiernan’s strategy pivoting to an engineering-led, execution-focused phase and fully funding Tiernan to complete advanced engineering studies and support submission of an EIS. In addition, Tiernan completed a PEA for Volcan in 2025, which outlined a 14-year mine life project producing c.330 kozpa on average for the first 10 years. For Royalty Ounce calculation, Franco-Nevada estimates 100% of the Mineral Resources and Mineral Reserves are subject to our royalty interest and estimates a rate of 1.5% is applicable TSX / NYSE: FNV Franco-Nevada Corporation ★ 47 46 ★ Franco-Nevada Corporation TSX / NYSE: FNV South & Central America
D E T O U R L A K E Producing Location: Ontario, Canada | Operator: Agnico Eagle Mines Limited | Precious Metals: Au | Royalty: NSR: 2% Franco-Nevada has a 2% NSR royalty that covers an area of 140 km 2 of the Abitibi greenstone belt located 185 km northeast of Cochrane, Ontario including the Detour Lake mine. 2025 2024 2023 Revenue to Franco-Nevada ($ million) $ 49.0 $ 31.9 $ 25.9 M&I Resources (koz Au) 1 35,732 34,310 37,883 Inf. Resources (koz Au) 1 6,168 6,605 2,717 P&P Reserves (koz Au) 1 18,575 19,051 19,928 M&I Royalty Ounces (000s) 1,2 715 686 758 Inf. Royalty Ounces (000s) 2 123 132 54 P&P Royalty Ounces (000s) 2 372 381 399 1 Please refer to the tables on pages 126–134 for a breakout of grade and tonnages by Mineral Resource category; all M&I categories are inclusive of Mineral Reserves 2 For Royalty Ounce calculation, Franco-Nevada estimates 100% of the Mineral Resources and Mineral Reserves are subject to our royalty interest and estimates a rate of 2.0% is applicable From 1983 through 1999, Placer Dome Inc. operated an underground mine on the property producing approximately 1.8 Moz of gold. Detour Gold Corporation (“Detour Gold”) drilled out a large open pittable resource and developed the current open pit mine with first production in 2013. Kirkland Lake Gold Ltd. (“KLG”) acquired Detour Gold in 2020 and Agnico Eagle Mines Limited (“Agnico Eagle”) and KLG merged in February 2022, with the combined company continuing as Agnico Eagle. Franco-Nevada’s royalty includes all the Mineral Resources and Mineral Reserves on the property, except Detour Lake Zone 58N (approximately 0.67 Moz) which sits to the south of the main mineralized trend. Production at Detour Lake was 692,675 oz of gold in 2025, compared with 671,950 oz of gold in 2024. This growth was driven by optimized mill equipment and higher throughput levels. Production for Detour Lake is anticipated to be between 700–730 koz of gold per year in 2026, 610–640 koz in 2027 and 590–620 koz in 2028. Lower production in 2027 and 2028 is due to lower gold grades expected in the mining sequence; however, the mill continues to target a throughput rate of 29 Mtpa by 2028. In June 2024, Agnico Eagle released the results of a technical study reflecting the potential for a concurrent underground operation at Detour Lake. Development of the underground project is advancing, with the exploration ramp having commenced in July 2025. Agnico Eagle expects to reach production of 1.0 Mozpa in 2031 for approximately 14 years and is evaluating the potential for a third processing line which could lift annual production above the 1.0 Mozpa level. KLG and Agnico Eagle have both had tremendous exploration success drilling extensions of the Detour Lake deposit. Total Mineral Resources have expanded from 21.9 Moz at year end 2020 to 41.9 Moz at year end 2025. The successful completion of the drilling program on a high-grade mineralized corridor in the West Pit zone has further strengthened confidence in the Detour Lake underground project. Exploration for 2026 is budgeted at $34.2 million for 175,000 metres of drilling to further convert Inf. Mineral Resources and extend the mineralized trend to the west. Detour Lake, Ontario North Pit Detour Lake Mine Quebec Ontario Mine Property Block D West Pit Gowest Property Main Pit Other Quebec royalty claims not shown Block E Zone 58N Block A Block B Block C North Pit Sunday Lake Deformation Zone Sunday Lake Deformation Zone Lower Detour Lake Deformation Zone Mineralization Mineral Reserve Pit Outline Mineral Resource Pit Outline 0.5-1% NSR 2% NSR 2% NSR 2% NSR 2% NSR 2% NSR 2% NSR 2% NSR Quebec Detour Lake Ontario Mineral Resource Pit Outline Mineral Reserve Pit Outline Mined Out Pit UG Development/Potential UG Pits FNV Royalties Detour Lake 2% NSR kilometer 0 5 N kilometer 0 1 West Pit West Pit Extension Open Open Main Pit Saddle Zone Saddle Zone Long Section North & West Pits West Pit Extension Main Pit Plan to grow production to 1 Mozpa level by 2031 and sustain for 14 years Evaluating the potential to lift production above the 1 Mozpa level Ongoing exploration success extending mineralized trend to the west The operator currently has a 27-year mine plan. M&I Resources could support production for 36 years and Inf. Resources for a further 6 years TSX / NYSE: FNV Franco-Nevada Corporation ★ 49 48 ★ Franco-Nevada Corporation TSX / NYSE: FNV Canada Canada
H E M L O Producing Location: Ontario, Canada | Operator: Hemlo Mining Corp. | Precious Metals: Au | Royalty: NSR: 3% / NPI: 50% The Hemlo gold mine has been in production for over 30 years and is located adjacent to the Trans-Canada Highway near Marathon, Ontario. 2025 2024 2023 Revenue to Franco-Nevada ($ million) $ 51.7 $ 16.4 $ 22.7 M&I Resources (koz Au) 1 656 3,400 3,200 Inf. Resources (koz Au) 1 281 620 620 P&P Reserves (koz Au) 1 473 1,600 1,700 M&I Royalty Ounces (000s) 1,2 228 180 120 Inf. Royalty Ounces (000s) 2 98 33 23 P&P Royalty Ounces (000s) 2 165 85 64 1 Please refer to the tables on pages 126–134 for a breakout of grade and tonnages by Mineral Resource category; all M&I categories are inclusive of Mineral Reserves. For 2025, the Mineral Resources and Mineral Reserves for the Interlake claim are presented. For 2023 and 2024, Mineral Resources and Mineral Reserves included the entire Hemlo deposit, as a breakout was not available 2 For Royalty Ounce calculation, Franco-Nevada estimates 100% of the publicly reported Mineral Resources and Mineral Reserves for Interlake are on its royalty ground (Franco-Nevada estimated 20% of the total Hemlo Mineral Resources and Mineral Reserves were on royalty ground in 2024 and 2023) and estimates a rate of 34.8% (5.3% in 2024, 3.75% in 2023 on the total Hemlo Mineral Resources and Mineral Reserves) is applicable when factoring our NSR and NPI interests. Please see page 18 for our methodology on calculating Royalty Ounces for an NPI Hemlo Mining Corp. (“Hemlo Mining”) acquired the operation from Barrick in November 2025 and operates the asset, including the underground mine and the currently inactive open pit. Franco-Nevada has both a 3% NSR royalty and a 50% NPI royalty on the Interlake claims which is a portion of the western down-dip underground extension, principally the Lower C Zone, of the Hemlo ore body as shown in the longitudinal schematic. Mining on the royalty property began in late 2008, but revenues were limited to the 3% NSR royalty. The 50% NPI portion of the royalty began paying in the third quarter of 2012 after the upfront capital costs had been recovered by Barrick. Hemlo produced 143,458 oz of gold in 2025, with 45,235 oz coming from the Interlake claims, versus 143 koz of gold in 2024. All-in sustaining cost, which is important to take into consideration with respect to the NPI royalty, increased from $1,769/oz in full-year 2024 to $1,925/oz for the nine months ended September 30, 2025 under Barrick. In 2025, Franco-Nevada received $47.5 million in revenue from the NPI at an average gold price of $3,350/oz. Hemlo Mining expects to release 2026 production and cost guidance midway through 2026; however, its 2025 technical report estimated 2026 production at Hemlo to be approximately 131 koz with an all-in sustaining cost of $1,538/oz. Using the same 2025 technical report, it is estimated that approximately 446 koz over a 10-year period would be mined from the Interlake claims. Hemlo Mining is evaluating the optimal scope and timing to re-establish open pit operations via a push back of the Williams pit. Hemlo Mining also initiated a 130,000 metre exploration drilling program which is expected to serve as the foundation for an updated technical report to be released in H2 2027 and plans to increase the underground mining rate to maximize the hoisting capacity which currently operates at approximately 60% capacity. Hemlo, Ontario Quebec Ontario Hemlo Long Section ‘C’ Zone Pit Williams Shaft & Mill Surface Mined Area 3% NSR + 50% NPI ‘C’ Zone ‘B’ Zone 9975 9765 9555 9450 9240 9160 Mined Area Williams Mine Franco-Nevada Royalty Ground Hemlo 3% NSR / 50% NPI C Ô T É G O L D Producing Location: Ontario, Canada | Operator: IAMGOLD Corporation (70%) Sumitomo Metal Mining Co. Ltd. (30%) | Precious Metals: Au | Royalty: GMR: 7.5% In 2025, Franco-Nevada acquired a 7.5% Gross Margin Royalty on the Côté Gold mine, located approximately 125 km southwest of Timmins, Ontario. 2025 2024 2023 Revenue to Franco-Nevada ($ million) $ 50.5 $ − $ − M&I Resources (koz Au) 1 18,156 − − Inf. Resources (koz Au) 1 2,165 − − P&P Reserves (koz Au) 1 7,041 − − M&I Royalty Ounces (000s) 1,2 1,067 − − Inf. Royalty Ounces (000s) 2 127 − − P&P Royalty Ounces (000s) 2 414 − − 1 Please refer to the tables on pages 126–134 for a breakout of grade and tonnages by Mineral Resource category; all M&I categories are inclusive of Mineral Reserves 2 For Royalty Ounce calculation, Franco-Nevada estimates 100% of the Mineral Resources and Mineral Reserves are subject to our royalty interest and estimates a rate of 5.88% is applicable when factoring in a margin of 78.3% (based on an estimated cash cost of $975/oz Au) The Côté Gold mine is operated through a joint venture and owned by IAMGOLD Corporation (“IAMGOLD”) (70%) and Sumitomo Metal Mining Co. Ltd. (“Sumitomo”) (30%). The allowable deductions on the Gross Margin Royalty include cash operating costs, but exclude all capital, exploration, depreciation and other non-cash costs. IAMGOLD and Sumitomo hold an option, exercisable at their discretion, to buy down up to 50% of the royalty at Franco-Nevada’s attributable cost in two equal tranches of 25%. The cost to repurchase the tranches are as follows: (i) the initial 25% buydown option for an internal rate of return equal to the Secured Overnight Financing Rate (“SOFR”) plus 1.10%, exercisable within two years of closing, and (ii) the additional 25% buydown option cost for an internal rate of return equal to 10%, following exercise of the initial option, exercisable within three years of closing. Both 25% options are subject to a minimum such that the exercise price shall be the greater of the calculated value or 25% of Franco-Nevada’s Royalty purchase price ($262.5 million). In June 2025, the Côté Gold mine achieved nameplate throughput capacity of 36 ktpd and produced 399,800 gold ounces for the full calendar year. Since acquiring the royalty at the end of May 2025, Franco-Nevada generated $51 million in revenue in 2025 at an average gold price of approximately $3,800/oz. Production at the mine is expected to increase to between 390–440 koz in 2026 on a 100% basis, with cash costs (excluding royalties) guided between $900/oz and $1,050/oz sold. As of year-end 2025, combined M&I Mineral Resources reached 18.2 Moz (689.4 Mt at 0.82 g/t) on a 100.00% basis, an approximately 12% increase from year-end 2024, driven largely by the conversion of Inf. Mineral Resources at Gosselin following a 53,750-meter drilling program. Inf. Mineral Resources as of December 31, 2025 total an additional 2.2 Moz (100.6 Mt at 0.67 g/t). IAMGOLD expects to release an expansion plan study in Q4 2026 which will outline an increase to the plant throughput by approximately 40% to over 50 ktpd, incorporating both the Côté and Gosselin deposits together as a single pit. 7.5% GMR 5.9% GMR Jack Rabbit Clam Lake 4.5% GMR 5.6% GMR 7 .5% GMR Resource Pit Côté Gosselin Côté Gold 7.5 GMR 2 0 kilometers N Mineral Resources >1.0 g/t Au Mineral Resources >0.3 g/t Au FNV Royalties FNV Royalties Targets Quebec Ontario Côté Gold Third largest gold deposit in Canada Nameplate capacity reached in June 2025 Mill expansion study expected by the end of 2026 The operator currently has a 16-year mine plan. M&I Resources could support production for 37 years and Inf. Resources for a further 4 years Renewed focus under new operator 130,000 m drilling program with updated technical report expected H2 2027 Profit royalties provide more leverage to gold prices The operator currently has a 10-year mine plan. M&I Resources could support production for 15 years and Inf. Resources for a further 6 years TSX / NYSE: FNV Franco-Nevada Corporation ★ 51 50 ★ Franco-Nevada Corporation TSX / NYSE: FNV Canada Canada
P O R C U P I N E Producing Location: Ontario, Canada | Operator: Discovery Silver Corp. | Precious Metals: Au | Royalty: NSR: 4.25% Franco-Nevada acquired a 4.25% net smelter return royalty on the producing Porcupine Complex in Timmins, Ontario in January 2025. 2025 2024 2023 Revenue to Franco-Nevada ($ million) $ 28.2 $ − $ − M&I Resources (koz Au) 1 3,929 − − Inf. Resources (koz Au) 1 12,493 − − P&P Reserves (koz Au) 1 − − − M&I Royalty Ounces (000s) 1,2 160 − − Inf. Royalty Ounces (000s) 2 281 − − P&P Royalty Ounces (000s) 2 − − − 1 Please refer to the tables on pages 126–134 for a breakout of grade and tonnages by Mineral Resource category; all M&I categories are inclusive of Mineral Reserves 2 For Royalty Ounce calculation, Franco-Nevada estimates 100% of the Mineral Resources and Mineral Reserves are subject to our royalty interest and estimates a rate of 2.25% plus an additional 2.0% on all minerals until royalty payments equal 72 koz of gold (attributable solely to the 2.0% NSR) Franco-Nevada acquired the royalty covering the full Porcupine Complex as part of a comprehensive financing transaction to support Discovery Silver Corp. (“Discovery Silver”) acquiring the complex from Newmont. The royalty consists of two tranches: (i) a 2.25% net smelter return royalty in perpetuity on all minerals; and, (ii) a 2.0% net smelter return royalty on all minerals until the earlier of: a) royalty payments equal to 72 koz of gold (attributable solely to the 2.0% NSR) or b) a cash payment equal to a pre-tax annual IRR of 12% in reference to a US$100 million attributable purchase price In addition to the royalty, Franco-Nevada provided a US$100 million senior secured loan available to be drawn for a period of two years from closing and c.US$49 million in equity of Discovery Silver. In September, 2025, after arranging a credit facility with a syndicate of commercial banks, Discovery Silver terminated the loan, which remained undrawn as of the date of termination. In April 2025, Discovery Silver completed the acquisition of the complex, forecasting a 22-year mine life with average annual gold production of 285 koz per year over the next 10 years. Discovery Silver expects to produce between 260–300 koz of gold in 2026 compared to 234 koz produced in 2025, reflecting higher output at Hoyle Pond and Borden, as well as increased production from open pit sources, including both Pamour and Hollinger. An updated technical report for the Porcupine complex is expected in late 2026. There is significant expansion potential at the complex, including the Dome open pit project which alone hosts a further 11.0 Moz of gold in Inf. Resources not currently in the mine plan. A study on the Dome mine and mill is targeted for completion in late 2026, which could add an additional 200–250 koz per year to the mine plan. Discovery Silver reported strong exploration results at all operations in 2025, including multiple high-grade intersections from resource conversion and extension drilling at Hoyle Pond and Borden, favourable drill results within and along strike of current resources at Pamour, and encouraging results from district exploration drilling at Owl Creek. Exploration drilling in 2026 is set to target resource conversion and expansion, confirming and upgrading Inf. Mineral Resources, and district exploration. In March 2026, Discovery Silver announced the acquisition of Glencore’s Kidd Operations. The acquisition supports Discovery’s vision of doubling gold production in Timmins to over half a million ounces per year. The added Kidd milling capacity, including the addition of at least one new gold circuit, is expected to be sufficient for future planned tonnage from Pamour, Borden and Hoyle Pond, as well as for processing mineralization from TVZ. This configuration would then allow the Dome mill to process mineralization from the adjacent Dome mine following an anticipated resumption of mining operations. Existing Timmins West 2.25% Royalty Area 180 km to Borden West Timmins Thunder Creek 144 Gap Zone West Cache Buffalo Ankerite Timmins Porcupine Redstone Bell Creek Hollinger OP Crusher Mill Dome OP Pamour OP Hoyle Pond Kidd Met Site Whitney Aquarius 101 Borden Royalty Area Borden Chapleau N kilometer 10 0 101 Internal Haul Road Discovery Silver asset Open Pit Mine 3rd party asset Discovery Silver Lease Application Discovery Silver License Porcupine Royalty Area 4.25% NSR N kilometer 5 0 G R E E N S T O N E Producing Location: Ontario, Canada | Operator: Equinox Gold Corp. | Precious Metals: Au | Royalty: NSR: 3% Franco-Nevada acquired a 3% NSR on Greenstone as part of its acquisition of a portfolio of approximately 20 royalties from Barrick in November 2013. 2025 2024 2023 Revenue to Franco-Nevada ($ million) $ 22.3 $ 9.2 $ − M&I Resources (koz Au) 1 7,918 7,918 7,008 Inf. Resources (koz Au) 1 2,763 2,763 3,072 P&P Reserves (koz Au) 1 5,700 5,700 5,539 M&I Royalty Ounces (000s) 1,2 238 238 210 Inf. Royalty Ounces (000s) 2 83 83 92 P&P Royalty Ounces (000s) 2 171 171 166 1 Please refer to the tables on pages 126–134 for a breakout of grade and tonnages by Mineral Resource category; all M&I categories are inclusive of Mineral Reserves 2 For Royalty Ounce calculation, Franco-Nevada estimates 100% of the Mineral Resources and Mineral Reserves are subject to our royalty interest and estimates a rate of 3.0% is applicable The Greenstone mine is operated by Equinox Gold Corp. (“Equinox Gold”). Equinox Gold consolidated 100% ownership of the property in May 2024. An updated technical report was released in March 2026 (which has an effective date of December 31, 2025 and supersedes the Mineral Reserve and Mineral Resource in the table above), outlining a total P&P Mineral Reserve of 5.33 Moz of gold (179 Mt at 0.93 g/t). The March 2026 updated technical report outlined a 27 ktpd processing facility and open pit mining operation with an initial mine life of 19 years. Under this new plan, gold production is expected to average 320 koz per annum over a 10-year period (2026 to 2036). Equinox Gold achieved commercial production at Greenstone in November 2024, having produced a total of 111,717 oz of gold during its first partial year of operations in 2024. In 2025, the mine produced 223,843 oz of gold, which was in line with its revised guidance of 220–260 koz. For 2026, Equinox Gold expects Greenstone to produce between 250–300 koz of gold as it continues to ramp up toward full design capacity. The underground potential at the Greenstone mine represents a significant organic growth opportunity for Equinox Gold, though it is not yet included in the current mine life economics. The higher-grade underground resources could potentially extend the mine’s life and increase annual production, with potential for the mill throughput to be increased towards 30 ktpd. Salsberg Ashmore McKelvie Lindsey Parent Errington Ontario Greenstone Mosher Shaft SP Zone Hardrock Geraldton Other Royalty Claims Other Royalty Claims FNV Royalties Mineralized zones Excluded from Royalty Greenstone 3% NSR kilometer 3 0 N 3% NSR Producing gold operation from a well-established complex Extensive exploration program and expansion potential Operated by a proven management team in the region The operator currently has a 22-year mine plan. Inf. Resources could support production for a further 44 years Commercial production achieved in November 2024 Expected to produce 320 koz per annum during the first ten years Underground potential outside of the initial mine life The operator currently has a 19-year mine plan. M&I Resources could support production for 25 years and Inf. Resources for a further 9 years TSX / NYSE: FNV Franco-Nevada Corporation ★ 53 52 ★ Franco-Nevada Corporation TSX / NYSE: FNV Canada Canada
M A C A S S A ( K I R K L A N D L A K E ) Producing Location: Ontario, Canada | Operator: Agnico Eagle Mines Limited | Precious Metals: Au | Royalty: NSR: 1.5–5.5% / NPI: 20% Franco-Nevada has various royalties covering approximately 170 km 2 of the Larder Lake and Main Breaks in the historic Kirkland Lake gold camp of Ontario. 2025 2024 2023 Revenue to Franco-Nevada ($ million) $ 16.2 $ 10.0 $ 6.3 M&I Resources (koz Au) 1 4,047 3,933 3,856 Inferred Resources (koz Au) 1 3,618 3,292 3,144 P&P Reserves (koz Au) 1 2,200 2,074 2,137 M&I Royalty Ounces (000s) 1,2 68 66 64 Inferred Royalty Ounces (000s) 2 66 59 57 P&P Royalty Ounces (000s) 2 35 32 33 1 Please refer to the tables on pages 126–134 for a breakout of grade and tonnages by Mineral Resource category; all M&I categories are inclusive of Mineral Reserves. The table above is the sum of reported Agnico Eagle Mineral Resources and Mineral Reserves 2 For Royalty Ounce calculation, Franco-Nevada estimates 100% of the Mineral Resources and Mineral Reserves are subject to our royalty interest and estimates a rate of 1.5% is applicable to Macassa and a rate of 2.0% is applicable to Amalgamated Kirkland (AK), Anoki-McBean and Upper Canada Agnico Eagle is the largest landowner in the Kirkland Lake camp following its merger with Kirkland Lake Gold in 2022. Agnico Eagle operates the Macassa mine which includes production from the Main Break, ’04 Break, the high-grade South Mine Complex (“SMC”) and the AK deposit. Historically, shaft capacity at the Macassa #3 Shaft was limited to approximately 2,250 tpd. With the commissioning of #4 Shaft in 2023, ore hoisting capacity at the complex has increased to 4 ktpd. Franco-Nevada’s Kirkland Lake royalty interests with Agnico Eagle include: • An overlying 1.5% NSR on Agnico Eagle’s properties surrounding and including the Macassa mine • An underlying 20% profit-based royalty immediately to the southwest of the SMC as shown in the inset of the schematic • A 2% NSR on AK, Upper Canada, Anoki-McBean, Canadian Kirkland and the surrounding land packages • An underlying 2% NSR royalty on the extension of Amalgamated Kirkland (“AK”) • An underlying 2–3% NSR on claims to the west of current operations In 2025, Macassa produced 312,729 oz of gold compared to 279,384 oz of gold in 2024. This increase was primarily due to higher gold grades in the mining sequence and productivity gains from the new ventilation infrastructure and #4 Shaft, which were completed in 2023. Production in 2026 is forecast to be between 305–325 koz of gold, with 2027 and 2028 forecast to be between 315–335 koz of gold, and 320–340 koz of gold, respectively. Agnico Eagle expects to begin processing ore from the AK zone, through the La Ronde facility in Q2 2026. AK is forecast to contribute approximately 45 koz in 2026 and between 50–60 koz annually in 2027 and 2028. These amounts are included in the total production forecast above. Franco-Nevada’s multiple royalties at Macassa include a 2% NSR on the AK deposit, a 1.5% NSR on the Near Surface (“NSUR”). Both royalties apply in an area of overlap known as the AK extension. Agnico Eagle is advancing plans to increase mill processing capacity to 2,150 tpd by the end of 2027. Underground exploration in 2025 totalled 210,679 m, with drilling confirming that the SMC zone continues to grow to the west and at depth, while the Main Break is being extended to the east at approximately 2,000 m below surface. Agnico Eagle expects to drill an addition 202,000 m at Macassa in 2026. Franco-Nevada also holds a 2% NSR royalty, covering claims held by Agnico Eagle from its acquisition of Osisko Mining Corporation in April 2014, on the Upper Canada, Anoki-McBean and Canadian Kirkland deposits. Work is ongoing to evaluate the potential to develop Upper Canada and Anoki-McBean as potential ore feed to existing milling infrastructure in the region. S U D B U R Y Producing Location: Ontario, Canada | Operator: Magna Mining Inc. | Precious Metals: PGM & Au | Stream: 50% Precious Metal Stream Franco-Nevada has precious metals streams on McCreedy West, Levack and Podolsky in the Sudbury basin of Ontario. 2025 2024 2023 PGM Revenue to FNV ($ million) $ 10.1 $ 6.9 $ 13.4 Gold Revenue to FNV ($ million) $ 4.8 $ 3.0 $ 4.2 Total Revenue to FNV ($ million) $ 14.9 $ 9.9 $ 17.6 PGM M&I Resources (koz PGM) 1 517 814 n/a PGM Inf. Resources (koz PGM) 1 113 110 n/a PGM P&P Reserves (koz PGM) 1 75 − n/a Gold M&I Resources (koz Au) 1 75 167 n/a Gold Inf. Resources (koz Au) 1 16 18 n/a Gold P&P Reserves (koz Au) 1 10 − n/a M&I Royalty Ounces (000s) 1,2 104 24 24 Inf. Royalty Ounces (000s) 2 19 − − P&P Royalty Ounces (000s) 2 15 24 24 1 Please refer to the tables on pages 126–134 for a breakout of grade and tonnages by Mineral Resource category; all M&I categories are inclusive of Mineral Reserves. For 2023, KGHM did not provide public estimates for Mineral Resources and Mineral Reserves. Previous estimates had not been updated in numerous years and thus Franco-Nevada chose not to continue to report these figures 2 For Royalty Ounce calculation, Franco-Nevada estimates 100% of the Mineral Resources and Mineral Reserves from the precious metals contained in ore produced from the footwall portions of each mine covered by the streams (5 years of mining was assumed from McCreedy West in 2024 and 2023 prior to the latest LOM plan being issued). Each are subject to our 50% stream interest to which a 73% margin factor has been applied based on assumed ongoing payments of $1,200/ounce Au of the spot price for McCreedy West. Platinum and palladium have been converted to Royalty Ounces assuming $4,500/ounce Au, $2,000/ounce Pt and $1,650/ounce Pd ($2,800/ounce Au, $950/ounce Pt and $950/ounce Pd in 2024, $1,950/ounce Au, $800/ounce Pt and $900/ounce Pd in 2023). Note that this stream interest is calculated based on contained ounces in ore as there are no losses associated to metallurgical recoveries in the calculation of the Royalty Ounces Franco-Nevada is entitled to purchase 50% of the precious metals contained in ore produced from the footwall portions of each mine subject to ongoing payments per ounce. The streams are calculated based on contained precious metals in the delivered ore rather than payable metals and were acquired as part of Franco-Nevada’s acquisition of Gold Wheaton Gold Corp. (“Gold Wheaton”) in 2011. At the time of acquisition, the mines were operated by Quadra FNX Mining Ltd. (“Quadra FNX”) which was subsequently acquired by KGHM International Ltd. (“KGHM”) in 2012. Magna Mining Inc. (“Magna”) acquired Levack (Morrison Deposit), Podolsky and McCreedy West from KGHM in February 2025. The footwall deposits at each mine are primarily rich in palladium followed by platinum and gold. Magna does not have processing facilities in Sudbury and sells the ore to third parties for processing. McCreedy West Mine: The stream agreement applies to the PM and 700 deposits at the McCreedy West mine. McCreedy West stopped mining the PM deposit in 2011 and Franco-Nevada agreed to renegotiate the existing contract with KGHM with mining restarted in 2018. In 2021, KGHM approved an updated life of mine plan which extended mining operations at the McCreedy West mine for another five years. To support this extension of operations in mid-2021, Franco-Nevada agreed to increase its purchase price per GEO, from $800/oz to 60% of the prevailing monthly average gold spot price during periods when monthly average gold prices exceed $1,333/oz subject to a cap of $1,200/oz. In Q1 2026 Magna released its initial Mineral Reserve which supports a 3-year production profile to 2028. McCreedy is expected to be the primary source of Sudbury revenue to Franco-Nevada in 2026, with the Q1 2026 technical report indicating production of up to 6,000 gold equivalent ounces attributable to Franco-Nevada. Levack (Morrison Deposit) Mine: This mine was operated between 2007 and 2019 and is currently on care and maintenance. Franco-Nevada’s stream covers the Morrison Deposit, Rob’s Zone and the 1900 Zone. In 2025, drilling at Levack targeted the near surface Keel Footwall Cu Zone. Drilling at the R2 Footwall Zone has intersected high-grade copper-rich massive sulphides, and underground development has resumed to provide platforms for further delineation drilling. A Preliminary Economic Assessment for Levack is scheduled for completion in Q3 2026. Podolsky Mine: The stream agreement applies to the 2000 and North deposits at the Podolsky mine which operated between 2008 and 2013. The mine is currently on care and maintenance and is part of Magna’s long-term pipeline of past-producing properties. Quebec Ontario Sudbury kilometer 5 0 N Sudbury 50% Precious Metals Stream Podolsky Levack (Morrison Deposit) McCreedy West Strathcona Mill Creighton Nickel Rim South Totten Coleman Copper Cliff Smelter Clarabelle Mill Sudbury Sudbury Igneous Complex Chelmsford Formation Onaping & Onwatin Formations Current and Former Mines Mill Smelter Stream Properties Quebec Ontario Kirkland Lake Teck Twp. Otto Twp. Bernhardt Twp. Teck Twp. Teck Twp. Grenfell Twp. Teck Twp. Lebel Twp. Kirkland Lake Swastika Macassa #3 Shaft Macassa #2 Shaft Gracie West Teck-Hughes Lakeshore Kirkland Minerals 2% NSR AK Extension South Mine Complex Kirkland Lake West (KLW) Wright- Hargreaves Macassa #4 Shaft Macassa #1 Shaft Amalgamated Kirkland (AK) Macassa Overlying 1.5% NSR 2% NSR – AK and surrounding land package Fault Mineralized Breaks Gold Showings Mine Shafts Excluded from Royalty 20% NPI 3% NSR 2% NSR 2% NSR 2% NSR 2% NSR 2% NSR 2% NSR Anoki-McBean 24 M oz. Kirkland Main Break King Kirkland Dobie Biroco 180 East 13 M oz. Larder Lake Break Esker Upper Beaver Swastika Kirkland Lake Upper Canada Amalgamated Kirkland (AK) 66 kilometer 0 1 Macassa (Kirkland Lake) 1.5–5.5% NSR / 20% NPI N Renewed focus on exploration under new operator The operator currently has a 3-year mine plan Mill optimization to increase processing to 2,150 tpd by end of 2027 Large land position in historical mining area covering multiple known deposits Exploration potential on royalty ground at AK and Upper Canada The operator currently has a 7-year mine plan. M&I Resources could support production for 13 years and Inf. Resources for a further 11 years TSX / NYSE: FNV Franco-Nevada Corporation ★ 55 54 ★ Franco-Nevada Corporation TSX / NYSE: FNV Canada Canada
M U S S E L W H I T E Producing Location: Ontario, Canada | Operator: Orla Mining Ltd. | Precious Metals: Au | Royalty: NPI: 5% / NSR: 2% Franco-Nevada has a 5% NPI royalty that covers all of the original leased lands at the Musselwhite operation and a 2% NSR on the projected NW extension of the orebody. 2025 2024 2023 Revenue to Franco-Nevada 1 ($ million) $ 11.6 $ 3.2 $ 2.8 M&I Resources (koz Au) 2 2,032 1,767 1,800 Inf. Resources (koz Au) 2 299 190 200 P&P Reserves (koz Au) 2 1,526 1,473 1,500 M&I Royalty Ounces (000s) 2,3 65 42 28 Inf. Royalty Ounces (000s) 3 10 4 3 P&P Royalty Ounces (000s) 3 49 35 24 1 Revenue to Franco-Nevada represents the actual NPI revenue paid and earned for each year 2 Please refer to the tables on pages 126–134 for a breakout of grade and tonnages by Mineral Resource category; all M&I categories are inclusive of Mineral Reserves 3 For Royalty Ounce calculation, Franco-Nevada estimates 100% of the Mineral Resources and Mineral Reserves are subject to our royalty interest and estimates a rate of 3.18% (2.35% in 2024, 1.58% in 2023) is applicable assuming an all in cost of $1,637/ounce ($1,484/ounce in 2024, $1,335/ounce in 2023). Please see page 18 for our methodology on calculating Royalty Ounces for an NPI The area is estimated to cover 120 km 2 in northwestern Ontario, 480 km north of Thunder Bay. The royalty also covers an area of interest surrounding the property as shown in the schematic. Franco-Nevada’s Musselwhite interest is a profit royalty which first becomes payable when historical capital and operational costs had been recovered by the operator in 2011. In September 2019, Franco-Nevada acquired a 2% NSR from Premier on property adjoining Musselwhite and covering approximately 6.3 km 2 of the projected northwest extension of the Musselwhite mine. In February 2025, Orla Mining Ltd. (“Orla”) acquired Musselwhite and the surrounding property from Newmont. Based on the December 2024 technical report issued by Orla, Musselwhite has a mine life until 2030 with average annual gold production of 202 koz at an all-in sustaining cost of $1,269/oz. For the full 2025 year, Musselwhite produced 236,908 oz of gold, versus 212 koz of gold in 2024 and all-in sustaining costs were $1,618/oz in 2025 (from April 1, 2025 onward), versus $1,541/oz in 2024. For 2026, Orla has issued guidance of 230–240 koz of gold production at an all-in sustaining cost of $1,650/oz to $1,850/oz. In Q1 2026, the mine produced 62,985 oz at a mill head grade of 6.29 g/t, putting it on track to meet or exceed its annual target. Significant opportunities exist to optimize the operation and extend mine life through known extensions of the ore body. Orla’s 2026 plan includes 15,600 metres of deep directional drilling aimed at further delineating the Lynx and PQ Extension stacked mineralized zones. These zones have now been confirmed to be continuous for at least 2 km beyond current operations. In addition, Orla is evaluating near-mine surface targets including Camp Bay, which is covered by Franco-Nevada’s royalty, to assess the potential for satellite sources of mill feed. B R U C E J A C K Producing Location: British Columbia, Canada | Operator: Newmont Corporation | Precious Metals: Au & Ag | Royalty: NSR: 1.2% In 2013, Franco-Nevada purchased an existing 1.2% NSR royalty covering Newmont Corporation’s (“Newmont”) Brucejack gold project in northwestern British Columbia. 2025 2024 2023 Revenue to Franco-Nevada ($ million) $ 9.8 $ 7.2 $ 5.9 M&I Resources (koz Au) 1,2 3,500 2,500 3,600 Inf. Resources (koz Au) 1,2 2,500 3,100 4,000 P&P Reserves (koz Au) 1,2 2,900 1,900 3,100 M&I Royalty Ounces (000s) 1,2,3 42 30 43 Inf. Royalty Ounces (000s) 2,3 30 37 48 P&P Royalty Ounces (000s) 2,3 35 23 37 1 Please refer to the tables on pages 126–134 for a breakout of grade and tonnages by Mineral Resource category; all M&I categories are inclusive of Mineral Reserves 2 Does not include silver Mineral Resources or Mineral Reserves 3 For Royalty Ounce calculation, Franco-Nevada estimates that 100% of the remaining Mineral Resources and Mineral Reserves are subject to our royalty interest and estimates a rate of 1.2% is applicable The mine was developed by Pretium Resources Inc. (“Pretium”) and commenced production in 2017. Newcrest Mining Limited (“Newcrest”) acquired Pretium in early 2022, with Newmont acquiring Brucejack through its acquisition of Newcrest in 2023. Brucejack produced 231 koz of gold in 2025 versus 258 koz in 2024. For 2026, Newmont is expecting Brucejack to produce approximately 260 koz of gold, representing an increase driven by improved stope availability and higher ore throughput. The project includes two principal deposits, the Valley of the Kings and the West Zone and as of December 31, 2025 has a 11-year reserve life with additional upside from resources and exploration. Exploration drilling continues to reveal significant mineralization beyond the current Mineral Resource, most notably with the 2025 discovery of the Dozer Zone, which is covered by Franco-Nevada’s royalty. This new discovery, which is a key focus for the 2026 growth program, returned high-grade intercepts including 20.90 meters at 154 grams per tonne. In addition to the Dozer Zone, significant mineralization has been expanded in the HBX Domain and at Golden Marmot, both of which are also covered by Franco-Nevada’s royalty. Other near-mine targets on royalty ground that remain prospective for resource growth include the Bridge Zone, Shore Zone, Gossan Hill Zone, SG Zone, Bonanza Zone, and the western portion of the Flow Dome Zone. Covered by Royalty Brucejack Property Excluded from Royalty West Zone Gossan Hill Zone Hanging Glacier Zone Bonanza Zone Bridge Zone Shore Zone SG Zone Snowfield Golden Marmot Zone Brucejack Mine Valley of the Kings kilometer 0 2 N Brucejack 1.2% NSR 1.2% NSR Vancouver British Columbia Stewart Brucejack Property Flow Dome Zone Brucejack Lake Musselwhite, Ontario kilometer 3 1.5 0 N Musselwhite 5% NPI / 2% NSR Leased Lands Historical Unpatented Lands Deposits Outside Boundary 5% NPI Quebec Ontario Musselwhite Main Mine Trend Mill Outside Boundary 5% NPI Opapimiskan Lake Karl Zeemal Area PQD North Saddle Lynx Zone 5% NPI 5% NPI 5% NPI 5% NPI 5% NPI 5% NPI Canoe Zone Camp Zone West Anticline Zone Bay Zone 2% NSR 2% NSR Zeemel Lake Numerous exploration targets on the property High-grade results on royalty ground from newly discovered Dozer Zone The operator currently has a 11-year mine plan. M&I Resources could support production for 13 years and Inf. Resources for a further 10 years Renewed focus under new operator NPI leverage to the gold price Large land package with additional royalty covering projected northwest extension of Musselwhite The operator currently has a 5-year mine plan. M&I Resources could support production for 9 years and Inf. Resources for a further 1 year TSX / NYSE: FNV Franco-Nevada Corporation ★ 57 56 ★ Franco-Nevada Corporation TSX / NYSE: FNV Canada Canada
FNV Royalties Island Gold Royalty Resource Pit Reserves + Resources Magino 3% NSR kilometer 2 0 N Granodiorite Resource Pit Magino Royalty Area 3% NSR 3% NSR 0.62% NSR Granodiorite 3% NSR Island Gold (Alamos) Royalty Area Quebec Ontario Magino M A G I N O Producing Location: Ontario, Canada | Operator: Alamos Gold Inc. | Precious Metals: Au | Royalty: NSR: 3% Franco-Nevada holds an aggregate 3% NSR on the Magino gold mine in Ontario, approximately 14 km southeast of the town of Dubreuilville. 2025 2024 2023 Revenue to Franco-Nevada ($ million) $ 9.7 $ 5.6 $ 1.3 M&I Resources (koz Au) 1 4,580 3,913 4,557 Inf. Resources (koz Au) 1 338 1,177 843 P&P Reserves (koz Au) 1 3,141 2,008 2,361 M&I Royalty Ounces (000s) 1,2 137 117 137 Inf. Royalty Ounces (000s) 2 10 35 25 P&P Royalty Ounces (000s) 2 94 60 71 1 Please refer to the tables on pages 126–134 for a breakout of grade and tonnages by Mineral Resource category; all M&I categories are inclusive of Mineral Reserves 2 For Royalty Ounce calculation, Franco-Nevada estimates 100% of the Mineral Resources and Mineral Reserves are subject to our royalty interest and estimates a rate of 3.0% is applicable (3.0% in 2024, 3.0% in 2023) Alamos Gold Inc. (“Alamos”), who operates the adjacent Island Gold underground mine which Franco-Nevada holds a separate royalty on, acquired Argonaut Gold Inc. (“Argonaut Gold”) in 2024. The aggregate 3% NSR applies to the Magino mine and all of Argonaut Gold’s regional exploration properties prior to the Alamos acquisition, totaling 45 km 2 . Magino is a past producing underground gold mine. The new mine achieved commercial production in November 2023, as a conventional open pit mining and milling operation with a nameplate mill throughput capacity of 10 ktpd. Under Alamos, Magino and Island Gold production has been combined into the Island Gold District, with combined production forecast to be between 290–330 koz in 2026, 380–420 koz in 2027 and 470–510 koz in 2028. Alamos released an updated Island Gold District (IGD) Expansion Study in February 2026. The Expansion Study finalized plans to increase total mill throughput at the Magino mill to 20 ktpd by early 2028. This expansion will support processing rates of 3 ktpd of high-grade underground ore principally from Island Gold and 17 ktpd from the Magino open pit, with the Island Gold mill expected to be shut down in early 2028 once the Magino mill expansion is complete. Combined production is expected to increase to 534 koz of gold annually over 10 years post expansion. It is estimated that Magino will contribute approximately 146 kozpa of gold post ramp up in 2028 and will run until 2044. Exploration targets include high-grade underground potential, such as the Elbow Zone, prospective structures and host rock on trend of Magino located on royalty grounds. Exploration in 2025 successfully focused on expanding mineralization to the east of Magino and in 2026 the exploration program will continue to focus on defining new Mineral Reserves and Resources near existing infrastructure. In addition to the royalties on Magino and Island Gold, Franco-Nevada also owns royalties that cover a number of regional exploration claims which expand our exposure to this prospective region. These include a 2% NSR on the Edwards property and a 0.75% NSR on the adjacent Cline Lake property, both located along strike on the same geologic structure as Magino. Alamos’ 2026 regional program includes 16,000 meters of surface drilling targeting high grade mineralization at Cline and Edwards, following 2025 highlights such as 178.07 g/t gold over 3.54 meters at Cline-Pick. FNV Royalties Island Gold Royalty Resource Pit Reserves + Resources Magino 3% NSR kilometer 2 0 N Granodiorite Resource Pit Magino Royalty Area 3% NSR 3% NSR 0.62% NSR Granodiorite 3% NSR Island Gold (Alamos) Royalty Area Quebec Ontario Magino L I O R C Producing Location: Newfoundland and Labrador, Canada | Operator: Rio Tinto plc | Metals: Iron Ore | Royalty: GORR: 0.7% Iron Ore, IOC Equity 1.5% Franco-Nevada holds 6.3 million common shares (a 9.9% equity investment) in Labrador Iron Ore Royalty Corporation (“LIORC”). 2025 2024 2023 Revenue to Franco-Nevada ($ million) $ 7.0 $ 13.8 $ 12.1 M&I Resources (Mt Iron Ore) 1,752 1,785 1,931 Inf. Resource (Mt Iron Ore) 662 665 811 P&P Reserves (Mt Iron Ore) 923 966 1,077 M&I Royalty Ounces (000s) 1,2 103 169 296 Inf. Royalty Ounces (000s) 2 39 63 124 P&P Royalty Ounces (000s) 2 54 91 165 1 Please refer to the tables on pages 126–134 for a breakout of grade and tonnages by Mineral Resource category; all M&I categories are inclusive of Mineral Reserves 2 For Royalty Ounce calculation, calculation based on overriding royalty interest only and takes into account moisture, mass recovery, and allowable deductions. Refer to LIORC’s annual report for additional information The position was acquired over a number of years for a total investment of C$93 million, representing an average cost of C$14.72 per share. Dividends received to date has fully recouped our investment by 2021. The investment in LIORC functions similar to a royalty given the flow through of revenue generated from LIORC’s underlying 7% gross overriding royalty interest (0.7% attributable), C$0.10 per tonne commission (C$0.01 per tonne attributable), and 15.1% equity interest (1.5% attributable) in Iron Ore Company of Canada’s (“IOC”) Carol Lake mine, operated by Rio Tinto plc (“Rio Tinto”). LIORC normally pays cash dividends from net income derived from IOC to the maximum extent possible, while maintaining appropriate levels of working capital. Over the past five years (2021–2025), cash flow from operations at LIORC has averaged c.58% from the royalty and commission with the balance from IOC dividends from the 15.1% equity interest. IOC produces high grade +65% Fe iron ore concentrate for sale and pellets with a reserve-only c.20-year mine life and a large mineral resource supporting further extensions (approximately an additional 30 years of mine life). IOC has nominal capacity of 23.3 Mtpa (combined concentrate and pellets). The operation had 2025 attributable sales of 15.7 Mt and Rio Tinto has provided 2026 guidance of saleable production between 15 million and 18 Mt. It is expected that IOC will continue to focus on maximizing pellet production in 2026. In 2025, total capital expenditures at IOC were $303 million, below the forecast of $342 million due to project timing, including planned track and culvert replacements and the deferment of locomotive purchases. In 2026, capital expenditures at IOC are forecast by IOC to be $290 million, including $53 million of growth and development projects. IOC benefits from integrated infrastructure, including the mine, concentrator/ pellet facilities, railway, and a port at Sept-Îles, Quebec. IOC has a long history as a supplier of high quality, low impurity, premium iron ore and pellets which has typically received premium prices from the European steel making industry. LIORC, Newfoundland and Labrador Mill expansion to 20,000 tpd by 2028 The operator currently has a 19-year mine plan. M&I Resources could support production for 31 years and Inf. Resources for a further 2 years Producer of high-quality pellets and fines Fully integrated from mine to port, operated by Rio Tinto +50 year track record The operator currently has a 19-year reserve life. M&I Resources could support an additional 17 years of production, with Inf. Resources supporting a further 14 years TSX / NYSE: FNV Franco-Nevada Corporation ★ 59 58 ★ Franco-Nevada Corporation TSX / NYSE: FNV Canada Canada
I S L A N D G O L D Producing Location: Ontario, Canada | Operator: Alamos Gold Inc. | Precious Metals: Au | Royalty: NSR: 0.62% In 2020, Franco-Nevada acquired an existing 0.62% NSR on the Goudreau Lake claims totaling 58 hectares covering the core of the Island Gold mine in western Ontario. 2025 2024 2023 Revenue to Franco-Nevada ($ million) $ 2.0 $ 1.2 $ 0.8 M&I Resources (koz Au) 1 5,731 2,886 2,441 Inferred Resources (koz Au) 1 1,061 3,774 3,682 P&P Reserves (koz Au) 1 5,141 2,285 1,725 M&I Royalty Ounces (000s) 1,2 20 13 11 Inferred Royalty Ounces (000s) 2 3 11 10 P&P Royalty Ounces (000s) 2 18 11 9 1 Please refer to the tables on pages 126-134 for a breakout of grade and tonnages by Mineral Resource category; all M&I categories are inclusive of Mineral Reserves 2 For Royalty Ounce calculation, Franco-Nevada estimates 57% of the Mineral Reserves (80% in 2024, 80% in 2023) and 56% Mineral Resources (75% in 2024, 75% in 2023) are subject to our royalty interest and estimates a rate of 0.62% is applicable The underground mine is operated by Alamos who acquired the operation in 2016. In the near term, Franco-Nevada expects a portion of Island Gold production to come from the royalty claims and it is estimated that approximately 56% of the inclusive Mineral Resources and 57% of the Mineral Reserves on the property are covered by Franco-Nevada’s royalty claims. Under Alamos, production for Island Gold and the adjacent Magino mine have been combined into the Island Gold District. Combined gold production from both Magino and Island Gold is expected to be between 290–330 koz in 2026, 380–420 koz in 2027 and 470–510 koz in 2028. The Island Gold mill currently continues to process approximately 1,265 tpd of high-grade ore, with excess underground production being blended with open pit ore at the Magino mill. Alamos released an updated Island Gold District (IGD) Expansion Study in February 2026 which finalized plans to increase total mill throughput at the Magino mill to 20 ktpd by early 2028. This expansion will support processing rates of 3 ktpd of high-grade underground ore from Island Gold and 17 ktpd from the Magino open pit. Once the 20 ktpd expansion is complete, the Island Gold mill will be shut down and decommissioned, with all district ore processed through the centralized Magino facility. Combined production is expected to increase to 534 koz of gold annually over 10 years post expansion. The Phase 3+ expansion at Island Gold is on track for completion in Q4 2026, with the shaft sinking having reached 1,350 m (98% of total depth) by early 2026. Mining rates are expected to reach 2 ktpd following the completion of the Phase 3+ shaft, increasing to 2.4 ktpd by 2027 and 3 ktpd by 2029. It is estimated that Island Gold will contribute approximately 340 kozpa of gold post ramp up and will run until 2040. Alamos continued to have exploration success at the Island Gold District in 2025, and 48,000 m of surface exploration drilling are being budgeted in 2026 targeting the area between the Island Gold and Magino deposits, as well as the down-plunge extension of the Island Gold deposit below a depth of 1,500 m. Franco-Nevada holds additional royalties in the Island Gold mining camp, including a 2% NSR royalty on the Edwards property located 4 km northeast of the Island Gold mine and a 0.75% NSR royalty on the Cline Lake property immediately adjacent to Edwards. Both of Franco-Nevada’s additional royalties in the mining camp are along strike and on the same geologic structure as the Island Gold mine. Alamos’ 2026 regional exploration program includes 16,000 m of surface drilling with a focus on following up on high-grade mineralization intersected at Cline and Edwards, including a 2025 highlight of 178.07 g/t gold over 3.54 m at Cline-Pick. FNV Royalties Mineral Resources UG Development Mineral Reserves Island East Island East Northern Zone Island Main Island Main Island West Island West Island Gold 0.62% NSR N metre 500 0 Oblique Longitudinal Section Shaft Quebec Ontario Island Gold T I M M I N S W E S T Producing Location: Ontario, Canada | Operator: Pan American Silver Corp. | Precious Metals: Au | Royalty: NSR: 2.25% Franco-Nevada’s Timmins West 2.25% NSR royalty covers a large land package of approximately 130 km 2 to the west of the City of Timmins, Ontario. 2025 2024 2023 Revenue to Franco-Nevada ($ million) $ 4.2 $ 4.1 $ 4.1 M&I Resources (koz Au) 1 1,152 1,067 652 Inf. Resources (koz Au) 1 546 383 79 P&P Reserves (koz Au) 1 846 868 467 M&I Royalty Ounces (000s) 1,2 9 8 15 Inf. Royalty Ounces (000s) 2 3 2 2 P&P Royalty Ounces (000s) 2 7 7 11 1 Please refer to the tables on pages 126–134 for a breakout of grade and tonnages by Mineral Resource category; all M&I categories are inclusive of Mineral Reserves. For 2025 and 2024, Mineral Resources and Mineral Reserves include both Timmins West and Bell Creek. For 2023, Mineral Resources and Mineral Reserves include Timmins West only. For 2022 and 2023, Mineral Resources and Mineral Reserves include Timmins West only 2 For Royalty Ounce calculation, Franco-Nevada estimates 38% of the Mineral Reserves (37% in 2024, 100% in 2023), 33% of the M&I Mineral Resources (35% in 2024, 100% in 2023) and 20% of the Inf. Mineral Resources (24% in 2024, 100% in 2023) are subject to our royalty interest and estimates a rate of 2.25% is applicable (2.25% in 2024, 2.25% in 2023) The Timmins West property hosts the Timmins, Thunder Creek and 144 Gap deposits as well as the Gold River Trend exploration zone. Franco-Nevada acquired the royalty from Lake Shore Gold Corp. (“Lake Shore Gold”) in 2012. Lake Shore Gold was acquired by Tahoe Resources Inc. (“Tahoe Resources”) in April 2016, which was subsequently acquired by Pan American in February 2019. Under Pan American Silver, public reporting for both the Timmins West and Bell Creek underground mines has been consolidated into its Timmins operations (Franco-Nevada does not have a royalty on Bell Creek). Ore from both the Timmins West and Bell Creek mines is processed at the Bell Creek mill. Pan American Silver produced 103,600 oz of gold from its Timmins operations in 2025 versus 123,700 oz of gold in 2024. Pan American expects to produce between 105–115 koz of gold from its Timmins operations in 2026, reflecting mine sequencing into higher-grade zones. Based on 2025 production, Franco-Nevada estimates that Timmins West will account for approximately 50% of Timmins production in 2026. Pan American Silver holds a significant land position in the Timmins Camp. The operations have a history of extending mine life through exploration success. Recent exploration success at the Samson Zone southwest of the 144 Gap deposit demonstrates significant upside potential for the property. Bell Creek Mine & Mill Destor-Porcupine Fault Burrows Benedict Fault Mattagami River Fault Bell Creek Complex Timmins Deposit Thunder Creek Deposit Gold River Trend 144 Gap Zone Deposit Timmins West Timmins Dome Mine Hollinger McIntyre Hoyle Pond Pamour Mine Quebec Ontario Timmins West Timmins West 2.25% NSR kilometer 20 0 N Deposits UG Mine Shaft Excluded from Royalty FNV Royalties 101 2.25% NSR FNV Royalties Mineral Resources Mineral Reserves Island East Island East Northern Zone Island Main Island Main Island West Island West Island Gold 0.62% NSR N metre 500 0 Oblique Longitudinal Section Shaft Quebec Ontario Island Gold Potential for regional synergies Exploration success has extended the mine life Large land package providing exploration upside High grade operation, operational synergies with Magino Phase 3+ expansion expected to be complete in Q4 2026 Strong exploration potential in Island Gold mining camp The operator currently has a 15-year mine plan. M&I Resources could support production for 17 years and Inf. Resources for a further 3 years TSX / NYSE: FNV Franco-Nevada Corporation ★ 61 60 ★ Franco-Nevada Corporation TSX / NYSE: FNV Canada Canada
C A S A B E R A R D I Producing Location: Quebec, Canada | Operator: Orezone Gold Corporation | Precious Metals: Au | Stream: Gold In March 2026, Franco-Nevada entered into a $100 million gold stream financing with Orezone Gold Corporation to support its acquisition of the Casa Berardi Gold Mine and other Quebec assets, including Heva-Hosco from Hecla Mining. 2025 2024 2023 Revenue to Franco-Nevada ($ million) $ − $ − $ − M&I Resources (koz Au) 1 2,340 − − Inf. Resources (koz Au) 1 493 − − P&P Reserves (koz Au) 1 1,158 − − M&I Royalty Ounces (000s) 1,2 102 − − Inf. Royalty Ounces (000s) 2 20 − − P&P Royalty Ounces (000s) 2 55 − − 1 Please refer to the tables on pages 126–134 for a breakout of grade and tonnages by Mineral Resource category; all M&I categories are inclusive of Mineral Reserves 2 For Royalty Ounce calculation, Franco-Nevada estimates 100% of the Mineral Resources and Mineral Reserves are subject to our stream interests and that the gold stream consists of fixed deliveries of 6,500 ounces per year for the first five years, followed by variable deliveries of 5.0% of gold produced from Casa Berardi, and 2.5% of gold produced from Heva-Hosco. The stream interests have been factored by ongoing payments of 20% of the spot price of gold The gold stream consists of fixed deliveries of 6,500 oz per year for the first five years, followed by variable deliveries of 5.0% of gold produced from Casa Berardi and other Quebec assets, and 2.5% of gold produced from Heva-Hosco. Gold ounces delivered will be subject to an ongoing payment of 20% of spot price. Casa Berardi has a long history of production, having produced >3.2 Moz of gold over 30 years of operations. Casa Berardi historically has been predominantly an underground mine, producing on average 141 koz of gold from 2006–2016 with sustained investment in underground exploration and development. More recently, Hecla increasingly shifted focus to open pit mining, resulting in lower annual production of 105 koz of gold over the last five years. Orezone completed the acquisition of Casa Berardi in March 2026, and is focused on optimizing the current mine plan, including increasing underground production utilizing established infrastructure. Investment in underground exploration and development is underway, with initial targeting of down plunge extensions of high-grade mineralization to commence in Q2 2026. The exploration program will be incrementally expanded, with the goal of achieving 80,000–100,000 meters of drilling per annum over the next several years, aiming to increase underground head grade and overall production. Orezone plans to publish an updated mine plan and economic study in Q4 2026. Casa Berardi hosts 1.2 Moz in P&P Mineral Reserves (15.5 Mt at 2.32 g/t gold), 2.3 Moz in M&I Mineral Resources inclusive of reserves (25.3 Mt at 2.88 g/t gold) and 0.5 Moz Inf. Resources (3.0 Mt at 5.1 g/t gold). In addition, Heva-Hosco hosts a large resource base of 1.2 Moz of gold M&I Mineral Resources (30.3 Mt at 1.19 g/t gold) and 0.6 Moz of gold Inf. Mineral Resources (14.6 Mt at 1.27 g/t gold). Heva-Hosco is located ~150 km southeast of Casa Berardi, along the Cadillac-Larder Lake fault, which hosts multiple large scale gold mines including LaRonde (~20 km away) and Canadian Malartic (~45 km away). Quebec Ontario Casa Berardi Area of Interest Mining Licenses Exploration Licenses Mineralization Projection Lac Germain 160 EMCP Principal WMPC Casa Berardi Fault Ontario Quebec Casa Berardi Gold Stream kilometers 10 0 N Heva-Hosco ~150 km C A N A D I A N M A L A R T I C Producing Location: Quebec, Canada | Operator: Agnico Eagle Mines Limited | Precious Metals: Au | Royalty: GR: 1.5% In 2011, Franco-Nevada purchased a 1.5% gross royalty on part of the Canadian Malartic gold project located in Quebec’s Abitibi mining district. 2025 2024 2023 Revenue to Franco-Nevada ($ million) $ 3.0 $ 2.3 $ 1.6 M&I Resources (koz Au) 1 7,378 7,437 7,853 Inf. Resources (koz Au) 1 7,490 4,686 3,545 P&P Reserves (koz Au) 1 7,148 7,180 7,609 M&I Royalty Ounces (000s) 1,2 31 27 26 Inf. Royalty Ounces (000s) 2 70 46 37 P&P Royalty Ounces (000s) 2 28 24 25 1 Please refer to the tables on pages 126–134 for a breakout of grade and tonnages by Mineral Resource category; all M&I categories are inclusive of Mineral Reserves 2 For Royalty Ounce calculation, Franco-Nevada estimates 26% of the Mineral Reserves (22% in 2024, 21% in 2023), 28% of the M&I Mineral Resources (24% in 2024, 22% in 2023) and 62% of the Inf. Mineral Resources (65% in 2024, 70% in 2023) are subject to our royalty interest and estimates a rate of 1.5% is applicable The royalty covers seven claims on the property including the central portion of the open pit and portions of the East Gouldie deposit, as shown in the schematic. Royalty payments are expected to fluctuate annually based on the location of mining relative to the royalty property. In 2023, the ownership of Canadian Malartic was consolidated under Agnico Eagle as part of the acquisition of Yamana’s Canadian assets. Canadian Malartic produced 642,612 oz of gold in 2025 versus 2024 production of 655,654 oz of gold, on a 100% basis. Gold production in 2026 is estimated to be between 575–605 koz and is forecast to be between 640–670 koz and 720–750 koz, in 2027 and 2028 respectively. From 2026 to 2028, production is expected to be sourced from the Barnat pit and increasingly supplemented by ore from Odyssey and low-grade stockpiles. Franco-Nevada estimates that roughly 17% of the Mineral Reserves of the open pit complex are subject to our royalty interest. The Odyssey underground project hosts three main zones: East Gouldie, East Malartic, and Odyssey (which is further sub-divided into Odyssey North, Odyssey South and Odyssey Internal). The project which is accessing Odyssey South and the upper deposits by ramp and the deeper mineralization including East Gouldie by shaft, supports a mine life to at least 2042. Production from East Gouldie is expected to start in Q1 2026. Odyssey is expected to contribute approximately 120 koz of gold in 2026, approximately 240 koz of gold in 2027 and approximately 450 koz of gold in 2028 as mining activities ramp-up. Post 2029, Odyssey is expected to produce an average of 545,400 oz of gold per year. One of Franco-Nevada’s royalty claims covers a portion of the Odyssey South extension and two of Franco-Nevada’s royalty claims cover a portion of East Gouldie, as seen in the schematic below. It is estimated that Franco-Nevada’s East Gouldie claims now cover approximately 28% of the East Gouldie reserve with infill and step-out drilling to the west of the East Gouldie zone continuing to support continuity and scale. Once the Canadian Malartic complex transitions fully to underground, expected in 2029, the mill will have excess capacity. Agnico Eagle is advancing a fill-the-mill strategy involving a potential second shaft at Odyssey, the Marban satellite open pit, and the Wasamac underground project, with the vision of reaching 1 Moz of annual gold production starting in 2033. Franco-Nevada’s royalty does not apply to Marban or Wasamac. In 2025, exploration drilling at Odyssey totaled 233,754 metres, successfully extending the East Gouldie deposit laterally to the east and west. In 2026, 190,700 metres of drilling is planned at Canadian Malartic. Exploration will continue to focus on lateral extensions at East Gouldie and the Eclipse zone, along with infill and extension drilling at Odyssey North and South. Canadian Malartic 1.5% GR Mill Malartic (town site) Hwy 117 deviation Rail line Rail line East Gouldie Barnat Pit Canadian Malartic Pit East Malartic Jeffrey Pit Sheehan Odyssey Jupiter Odyssey South Odyssey North Gouldie FNV Royalties Quartz Veins Mineralized Envelopes Open Pit Quebec Ontario Canadian Malartic 1.5% GR 1.5% GR 1.5% GR 1.5% GR 1.5% GR 1.5% GR kilometer 1 0 N Renewed focus and funding from new operator with strong track-record Optimized mine plan expected by end of 2026 Large drill program planned to unlock significant upside potential Long-life asset transitioning to underground production Technical evaluation advancing for second shaft at Odyssey New discoveries at East Gouldie extended further onto royalty ground The operator currently has a 17-year mine plan. Inf. Resources could support production for a further 17 years TSX / NYSE: FNV Franco-Nevada Corporation ★ 63 62 ★ Franco-Nevada Corporation TSX / NYSE: FNV Canada Canada
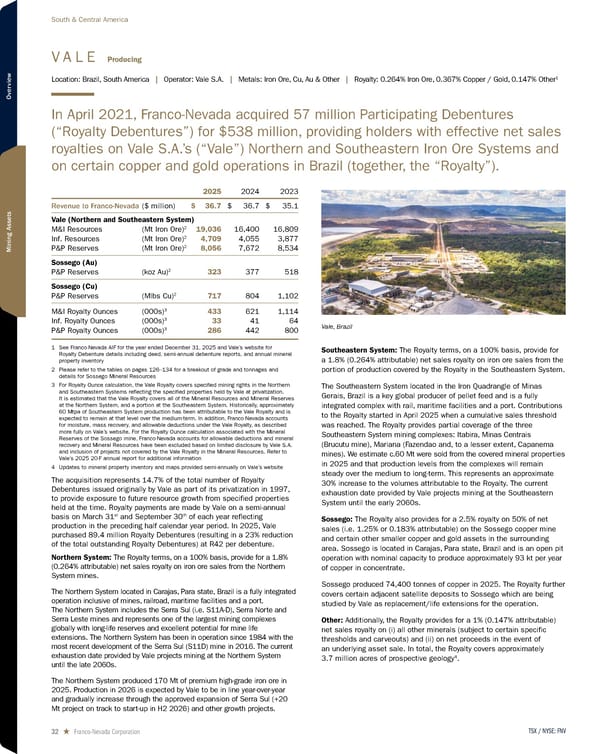
V A L E N T I N E G O L D Producing Location: Newfoundland, Canada | Operator: Equinox Gold Corp. | Precious Metals: Au | Royalty: NSR: 3% Franco-Nevada holds a 3% NSR on the Valentine Lake Gold Camp in central Newfoundland. 2025 2024 2023 Revenue to Franco-Nevada ($ million) $ 2.4 $ − $ − M&I Resources (koz Au) 1 4,027 3,955 3,955 Inf. Resources (koz Au) 1 1,079 1,100 1,100 P&P Reserves (koz Au) 1 2,700 2,700 2,700 M&I Royalty Ounces (000s) 1,2 121 119 119 Inf. Royalty Ounces (000s) 2 32 33 33 P&P Royalty Ounces (000s) 2 81 81 81 1 Please refer to the tables on pages 126–134 for a breakout of grade and tonnages by Mineral Resource category; all M&I categories are inclusive of Mineral Reserves 2 For Royalty Ounce calculation, Franco-Nevada estimates 100% of the Mineral Resources and Mineral Reserves are subject to our royalty interest and estimates a rate of 3.0% is applicable (3.0% in 2024, 3.0% in 2023) In June 2025, Equinox Gold Corp. (“Equinox”) acquired Calibre Mining Corporation (“Calibre”) and is now ramping up the Valentine Gold project to nameplate capacity by Q2 2026. First gold pour was achieved in September 2025, ahead of schedule, followed by commercial production achieved in November 2025. Production guidance for 2026 is 150–200 koz gold. Equinox is actively advancing Phase 2 studies and engineering, aimed at increasing annual production by 25% to approximately 225 kozpa gold by increasing mill throughput from 2.5 Mtpa to 4.5 Mtpa, 4.5 Mtpa to 5.0 Mtpa. This expansion is larger than the initial contemplated expansion to 4.0 Mtpa. Construction for Phase 2 is expected to begin Q3 2026 following Board of Directors approval, with targeted completion by H2 2028. The Valentine Gold project comprises a series of mineralized deposits along a 32 km trend representing high grade open pits totalling 4.0 Moz of M&I Mineral Resources and 1.1 Moz of Inf. Mineral Resources. Excellent ongoing drilling results indicate resource expansion potential, including the most recent new gold discovery, the Minotaur Zone, located 8 km northwest of the mill. Drilling in 2025 also encountered continuous gold mineralization in the Frank Zone, located along trend southwest of the Leprechaun pit. In 2026, Equinox is targeting a 100 km drill program across the land package, focusing on the Frank and Minotaur zones, along with resource expansion and additional greenfield discoveries. Valentine Gold Property Teck Resources Duck Pond Mine Millertown Buchans Buchans Junction Deer Lake Corner Brook Springdale Grand Falls Badger Stephenville Buchans Millertown Duck Pond Mine Granite Canal Substation Valentine Lake Thrust Fault Marathon Deposit Leprechaun Deposit Victory Deposit Sprite Deposit Frank Zone Powerline Granite Canal Hydro Facility Berry Zone Quebec Ontario Valentine Gold Newfoundland Valentine Gold 3% NSR kilometer 20 0 N Marathon Gold Corporation N kilometer 0 75 G O L D E N H I G H W A Y Advanced Location: Ontario, Canada | Operator: Agnico Eagle Mines Limited | Precious Metals: Au | Royalty: NSR: 0.25–10% Franco-Nevada has multiple NSR royalties ranging from 0.25% to 10% over the Destor-Porcupine mineral trend just east of Timmins, Ontario spread over more than 120 km and estimated to cover over 340 km 2 . 2025 2024 2023 Revenue to Franco-Nevada ($ million) $ − $ − $ − M&I Resources (koz Au) 1 2,728 2,728 2,978 Inf. Resources (koz Au) 1 1,421 1,421 1,421 P&P Reserves (koz Au) 1 – – – M&I Royalty Ounces (000s) 1,2 155 155 160 Inf. Royalty Ounces (000s) 2 90 90 90 P&P Royalty Ounces (000s) 2 – − – 1 Please refer to the tables on pages 126–134 for a breakout of grade and tonnages by Mineral Resource category; all M&I categories are inclusive of Mineral Reserves. Mineral Resources and Mineral Reserves are the sum of Golden Highway - Holt Complex (which includes Holt, Holloway and Taylor), Golden Highway – Hislop and Golden Highway - Aquarius 2 For Royalty Ounce calculation, Franco-Nevada estimates 100% of the Mineral Resources and Mineral Reserves are subject to our royalty interest and estimates rates of: Holt 10%; Holloway 3%; Taylor 1%; Hislop 4%; Aquarius 2% Kirkland Lake Gold (“KLG”) acquired St Andrew Goldfields in 2016, consolidating Holt, Holloway, and Taylor into the Holt Complex for reporting purposes, all of which have fed the Holt mill for processing. The Holt Complex suspended operations in April 2020. In August 2020, KLG and Newmont entered into a strategic alliance agreement, granting Newmont an option on certain mining and mineral rights related to the Holt property. In 2022, Agnico Eagle and KLG merged, continuing as Agnico Eagle (see pages 48, 54 and 63 for additional assets operated by Agnico Eagle). Agnico Eagle refers to the combined projects as the Timmins East project and in 2026 noted that it is actively reviewing historical mining and exploration data to rank targets for potential diamond drilling. Franco-Nevada has royalties on the following key properties in the trend: Holt: The Holt mine has been the main producing asset and includes the 3 ktpd Holt mill. Any potential redevelopment of the Timmins East project would require upgrades to the existing processing facility. Franco-Nevada has a sliding scale NSR royalty beginning at 2% when the gold price is less than or equal to $500/oz and increasing in 1% increments for each $100/oz increase in the gold price, to a maximum of 10%. Taylor: The Taylor mine (1% NSR) produced between November 2015 and April 2020. Exploration potential at Taylor exists along strike and at depth of current Mineral Resources. Holloway: The Holloway mine is located immediately north of the Holt property with ore historically processed at the Holt mill. The Holloway mine was placed on care and maintenance at the end of 2016 due to limited economic viability. In 2019, Franco-Nevada agreed to reduce the royalty at Holloway to a flat 3% NSR from the previous sliding scale royalty in an effort to improve the economics of the operation. The mine resumed operations in early 2019, prior to the current suspension. Hislop: Franco-Nevada has a 4% NSR on the Hislop mine which is located approximately 50 km to the west of the Holt mill. The open pit Mineral Reserves for the Hislop open pit were fully depleted in 2014. Aquarius: Franco-Nevada holds a 1–2% sliding scale NSR (2% when gold price is greater than $1,000/oz) on the majority of claims surrounding and including the Aquarius deposit. 101 Stoughton Matheson Porcupine Timmins Frederick House Lake Night Hawk Lake Kenogamisis Lake Holt Mine Jonpol Ross Mine Apollo Black Fox Ludgate Porcupine Peninsula Royal Oak Bell Creek Owl Creek Delnite Aunor Paymaster Dome McIntyre Hollinger Pamour #1 Matheson Stock Taylor Cody Macklem Bond Currie Carr Beatty Bowman Hislop Guibord 11 11 ONR Destor-Porcupine Fault Zone Pipestone Fault Cook Barnet Thackeray Harker Garrison Rand Michaud Munro McCool Frecheville Lamplugh Lake Abitibi 101 Marriot Holloway Holloway Mine Broulan Reef Hallnor Hoyle Pond Kinross 1060 Zone Kidd Creek Golden Highway 0.25–10% NSR kilometer 20 0 N Present or past producing mine Holloway Royalty 3% NSR 0.5-2.5% NSR Stoughton Royalty 1-2% NSR Aquarius Royalty 1% NSR Taylor Royalty 4% NSR Hislop Royalty Central Timmins Royalty Claims 0.25-1% NSR 1% NSR Stock Mine and Mill Royalty Holt Royalty Sliding scale Zone 7 Royalty Sliding scale German Lake Abitibi Quebec Ontario Golden Highway Multiple NSR royalties covering a large land position in the Destor-Porcupine mineral trend The Holt Complex could return to production following resolution of the royalty burden on certain claims Mine achieved first production ahead of budget with full ramp up expected in mid-2026 Advancing studies to further increase mill throughput from to 4.5–5.0 Mtpa, larger than initially contemplated Ongoing exploration success The operator currently has a 12-year mine plan. M&I Resources could support production for 19 years and Inf. Resources for a further 5 years TSX / NYSE: FNV Franco-Nevada Corporation ★ 65 64 ★ Franco-Nevada Corporation TSX / NYSE: FNV Canada Canada
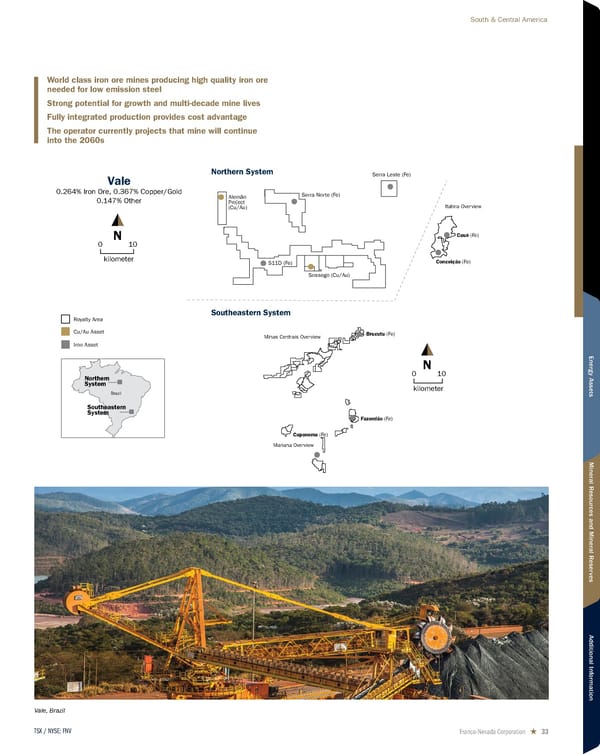
E S K A Y C R E E K Advanced Location: British Columbia, Canada | Operator: Skeena Resources Limited | Precious Metals: Au & Ag | Royalty: NSR: 2.5% Franco-Nevada holds a 2.5% NSR on the past-producing Eskay Creek gold-silver project in British Columbia’s Golden Triangle. 2025 2024 2023 Revenue to Franco-Nevada ($ million) $ − $ − $ – M&I Resources (koz Au) 1 4,380 4,380 4,380 Inf. Resources (koz Au) 1 67 67 67 P&P Reserves (koz Au) 1 3,336 3,336 3,336 M&I Resources (Moz Ag) 1 107.0 107.0 107.0 Inf. Resources (Moz Ag) 1 0.9 0.9 0.9 P&P Reserves (Moz Ag) 1 88.0 88.0 88.0 M&I Royalty Ounces (000s) 1,2 154 139 140 Inf. Royalty Ounces (000s) 2 2 2 2 P&P Royalty Ounces (000s) 2 120 108 109 1 Please refer to the tables on pages 126–134 for a breakout of grade and tonnages by Mineral Resource category; all M&I categories are inclusive of Mineral Reserves 2 For Royalty Ounce calculation, Franco-Nevada estimates 100% of the Mineral Resources and Mineral Reserves are subject to our royalty interest and estimates a rate of 2.5% is applicable (2.5% in 2024, 2.5% in 2023). Silver has been converted assuming $4,500/oz gold and $75.00/oz silver ($2,800/oz gold and $31.00/oz silver, $1,950/oz gold and $22.50/oz silver in 2023) Eskay Creek was the highest-grade gold mine in the world when in production with the operator, Barrick Gold Corp., producing 3.3 Moz of gold and 160.0 Moz of silver at average grades of 45 g/t gold and 2,224 g/t silver from 1994–2008. In November 2023, the current owner of the property, Skeena Resources Limited (“Skeena”), announced a positive definitive feasibility study, outlining average annual production of 324 koz of gold equivalent production over an initial 12-year mine life. The definitive feasibility study was based on P&P Mineral Reserves of 4.6 Moz gold equivalent (39.8 Mt at 2.6 g/t gold and 69 g/t silver). The study indicated a high-grade open pit and a flotation plant producing higher grade saleable concentrate. In early-2026, Skeena Resources announced receipt of the Environmental Management Act (“EMA”) Permit from the BC Ministry of Environmental and Parks, which completed the permitting process and represents the final regulatory approval required to advance Eskay Creek. The permit was jointly approved with the Tahltan central Government. As of March 2026, the project was 49% complete with first production remaining on schedule for the second quarter of 2027. Eskay Deeps 23 22 NEX 21 East 21A West KSM (Seabridge) FNV Royalties Area of Interest Deposits Excluded from Royalty Eskay Creek 2.5% NSR kilometer 5 0 N 2.5% NSR 2.5% NSR 2.5% NSR 2.5% NSR Vancouver British Columbia Stewart Eskay Creek R E D L A K E ( M C F I N L E Y ) Advanced Location: Ontario, Canada | Operator: Evolution Mining Limited | Precious Metals: Au | Royalty: NSR: 2% Franco-Nevada has a 2% NSR (subject to a buyback of 0.5%) on the water claims, which cover the majority of Mineral Reserves, of the McFinley orebody in Red Lake, Ontario. Evolution Mining Limited (“Evolution Mining”) acquired Battle North Gold Corporation (previously Rubicon Minerals Corp), taking ownership of the Bateman gold project (previously known as the Phoenix project) in 2021, that was principally focussed on exploiting the McFinley orebody. The consolidated Red Lake operation, under the ownership of Evolution Mining, consists of the Red Lake, Campbell, Cochenour, HG Young and McFinley mining areas. Rubicon developed the Phoenix project with completion of an 1,800 tonnes per day mill (the “Bateman” mill) in 2015, although later that same year shut down underground activities to review its geologic model as the gold mineralization was more geologically complex than anticipated and the contained gold ounces estimated were materially reduced. While Battle North Gold conducted substantial work to better understand the orebody at McFinley, Evolution is currently prioritizing ore processing through the Campbell and Red Lake mills, targeting higher margin mining areas such as the Campbell Young Dickenson decline. In the medium term, ore from the McFinley area is expected to be trucked to either the Red Lake or Campbell processing facilities, while the Bateman mill remains a potential option for future expansion. In the near term, deposits not subject to Franco-Nevada’s royalty are likely to take precedence for processing over material from the McFinley orebody. For Royalty Ounce calculation, Franco-Nevada estimates 100% of the Mineral Resources and Mineral Reserves are subject to our royalty interest and estimates a rate of 1.5% is applicable in anticipation that Evolution Mining exercises its right to repurchase 0.5% of the 2.0% NSR E A G L E Advanced Location: Yukon, Canada | Operator: PricewaterhouseCoopers Inc. | Precious Metals: Au | Royalty: NSR: 1–1.5% Franco-Nevada has a 1% NSR on the Eagle Gold deposit and a 1.5% NSR on the Lynx properties (part of the Dublin Gulch claim) located in central Yukon. In June 2024, Victoria Gold Corp. (“Victoria Gold”) suspended operations at the Eagle Gold mine due to a heap leach pad failure. In August 2024, PricewaterhouseCoopers Inc. (“PwC”) was appointed as the receiver of all the assets, undertakings and property of Victoria Gold, which included the Eagle Gold mine. A formal sale process for Victoria Gold’s assets, including the Eagle Gold mine, commenced in June 2025. Prior to the receivership, Victoria Gold produced 29,580 oz of gold in Q1 2024. Franco-Nevada’s royalty is estimated to cover the entire Eagle deposit and a small portion of the satellite Olive deposit. The 1.5% NSR on the Lynx properties is subject to a C$15,000 annual advance royalty payment and is capped at C$1,500,000. Mineralization at Eagle has been drill tested to a depth of 850 meters and remains open at depth. Victoria Gold explored the broader land package in 2023 targeting Lynx (on royalty ground) as well as Raven (not on royalty ground). For Royalty Ounce calculation, Franco-Nevada estimates 100% of the Mineral Resources and Mineral Reserves are subject to our royalty interest and estimates a rate of 1.0% is applicable Fully-permitted project. Financed through development. In full construction with production targeted by Q2 2027 The operator currently has a 12-year mine plan. M&I Resources could support production for 15 years TSX / NYSE: FNV Franco-Nevada Corporation ★ 67 66 ★ Franco-Nevada Corporation TSX / NYSE: FNV Canada Canada
G O L D F I E L D S Advanced Location: Saskatchewan, Canada | Operator: Fortune Bay Corp. | Precious Metals: Au | Royalty: NSR: 2% The Goldfields project consists of two gold deposits, the Box and Athona deposits, located approximately 13 km south of Uranium City in northern Saskatchewan. Franco-Nevada holds a 2% NSR royalty that covers both deposits. Brigus Gold Corp., which previously advanced the project, was acquired by Primero Mining Corp. in 2014. The Goldfields project was not part of the acquisition and was subsequently spun out into Fortune Bay Corp. (“Fortune Bay”). In September 2025, Fortune Bay released the results of an updated Preliminary Economic Assessment (“PEA”) for the Box and Athona deposits. The study outlines a conventional open - pit mining operation with a standard free milling flowsheet producing 896 koz of gold over a 14-year mine life. An updated Mineral Resource accompanying the September 2025 PEA outlines an Indicated Mineral Resource of approximately 1.0 Moz of gold (24.0 Mt at 1.28 g/t) and an Inf. Mineral Resource of approximately 0.2 Moz of gold (7.4 Mt at 0.90 g/t). Mineralization at both the Box and Athona deposits remains open at depth. In January 2026, Fortune Bay announced that it was advancing the Goldfields project through permitting and engineering activities, with the objective of progressing toward a Pre - Feasibility Study. For Royalty Ounce calculation, Franco-Nevada estimates 100% of Mineral Resources and Mineral Reserves are subject to our royalty interest and estimates a rate of 2.0% is applicable C O U R A G E O U S L A K E Advanced Location: Northwest Territories, Canada | Operator: Seabridge Gold Inc. | Precious Metals: Au | Royalty: NSR: 1.02% The Courageous Lake project is an advanced-stage gold development project located in the Northwest Territories, Canada. In January 2024, Seabridge Gold Inc. (“Seabridge”) released the results of an updated pre-feasibility study for the Courageous Lake project, superseding the previous study completed in 2012. The study estimates Mineral Reserves of 2.8 Moz of gold (33.9 Mt at 2.61 g/t at the FAT deposit) and projects average annual production of 201 koz of gold over a mine life of 12.6 years. The pre-feasibility study outlines an updated open - pit mine plan with a less capital-intensive design, a lower strip ratio, higher average grade and a smaller mine footprint relative to the prior study. The PFS contemplates a single open - pit mining operation with on - site processing, including pressure oxidation and cyanide leaching of flotation concentrate to produce gold doré. The mine plan utilizes less than 30% of the project’s M&I gold resources, providing potential for future mine life extensions. This project covers approximately 2 km of a greenstone belt that stretches 53 km, and the FAT deposit is one of Canada’s largest undeveloped gold deposits by reserves. The property also hosts the Walsh Lake deposit, an Inf. Mineral Resource of approximately 4.1 Mt at 4.18 g/t gold, located approximately 10 km south of the larger FAT deposit. Earlier metallurgical testing indicated that the Walsh Lake material is free-milling. Based on these factors, the Walsh Lake deposit could be mined prior to constructing the processing plant required for the larger, refractory FAT deposit thereby improving the overall economics of the Courageous Lake project. Seabridge also published a Preliminary Economic Assessment (“PEA”) in 2024, demonstrating the potential to extend the asset’s mine life by an additional 15.9 years at 205 koz of gold per year through the inclusion of additional resources. In December 2025, Seabridge announced its intention to spin out the Courageous Lake project into a dedicated public company, Valor Gold Corp., which would assume operatorship upon completion of the transaction. For Royalty Ounce calculation, Franco-Nevada estimates 100% of Mineral Resources and Mineral Reserves are subject to our royalty interest and estimates an average rate of 1.02% is applicable M O N U M E N T B A Y Advanced Location: Manitoba, Canada | Operator: ONGold Resources Ltd. | Precious Metals: Au | Royalty: NSR: 2–3% In December 2024, ONGold Resources Ltd. (“ONGold”) acquired the Monument Bay project from Agnico Eagle, who previously acquired the project as part of the acquisition of Yamana’s Canadian assets. As of April 2026, Agnico Eagle currently maintains a 12% share ownership in ONGold following the transaction. The Monument Bay project is located in Manitoba, approximately 570 km northeast of Winnipeg adjacent to the Ontario border and consists of 136 contiguous claims. Franco-Nevada holds a 2% NSR royalty on the first 1.0 Moz produced and a 3% NSR on any additional production. Yamana acquired the project from Mega Precious Metals Inc. in 2015 and in 2018, Yamana signed an Exploration Agreement with Red Sucker Lake First Nations in relation to the Monument Bay exploration site. In both 2020 and 2021, Yamana focused on exploring high-grade extensions of the main mineralized structure and on targets surrounding the Twin Lakes shear zone. Agnico Eagle reported an Indicated Mineral Resource of 1.8 Moz of gold (36.6 Mt at 1.52 g/t) and an Inf. Mineral Resource of 1.8 Moz of gold (41.9 Mt at 1.32 g/t) as of year-end 2022. In February 2025, the Red Sucker Lake First Nations invited ONGold to resume exploration on the project and field work was restarted in July 2025 under a framework agreement and the community’s consultation protocol. Throughout 2025, ONGold completed a ground Induced Polarization survey and a comprehensive field evaluation of 38 targets, confirming the Main Deposit, AZ/Central Zone, and the Mid-East Zone as high priorities, all of which are covered by Franco-Nevada’s royalty. In early 2026, the company concluded a strategic re-logging and infill sampling program of 83 historical drill holes (11,400 meters), yielding significant results such as 14.59 g/t gold over 9.6 meters. As of March 2026, ONGold initiated an updated NI 43-101 Mineral Resource for gold and tungsten, which will incorporate newly recovered tungsten assays to enhance project value. For Royalty Ounce calculation, Franco-Nevada estimates 100% of Mineral Resources and Mineral Reserves are subject to our royalty interest and estimates an average rate of 2.0% is applicable for the first 1.0 Moz produced and 3.0% on any additional ounces C R A W F O R D Advanced Location: Ontario, Canada | Operator: Canada Nickel Company Inc. | Metals: Ni, Co, Fe, Cr & PGM | Royalty: NSR: 2% Canada Nickel Company is advancing its Crawford nickel-cobalt sulphide project near Timmins, Ontario where Franco-Nevada holds a 2% NSR on all metals. Crawford represents one of the largest undeveloped nickel sulphide resources globally, containing 1,715 Mt of P&P Reserves at a grade of 0.22% nickel for 3.8 Mt of contained nickel. Crawford is the second project to be advanced under the Province of Ontario’s new One Project, One Process (“1P1P”) framework, which is designed to streamline the permitting process and timeline. Canada Nickel completed a bankable feasibility study for a large-scale open pit mining project in 2023. The study outlined a multi-phase operation ramping up from 60–120 ktpd of milling capacity to produce up to 48 ktpa of nickel over a 41-year mine life. The mine would also produce cobalt, chrome, iron and PGMs. Canada Nickel is advancing the project through the permitting process and has attracted investments from Anglo American, Agnico-Eagle, Samsung SDI and the Taykwa Tagamou Nation. Federal review of the Crawford Impact Statement is complete, with Canada Nickel targeting receipt of federal permits and full financing package in 2026. For Royalty Ounce calculation, Franco-Nevada estimates 100% of the Mineral Resources and Mineral Reserves are subject to our royalty interest and estimates a rate of 2.0% is applicable. Franco-Nevada has also applied an NSR smelting charge of 30%. Nickel has been converted to Royalty Ounces assuming $7.39/lb ($7.89/lb in 2024, $7.89/lb in 2023) TSX / NYSE: FNV Franco-Nevada Corporation ★ 69 68 ★ Franco-Nevada Corporation TSX / NYSE: FNV Canada Canada
R I N G O F F I R E Exploration Location: Ontario, Canada | Operator: Wyloo Metals Pty Ltd | Metals: Cr, Ni, Cu & PGM | Royalty: NSR / GR: 1–3% In April 2015, Franco-Nevada acquired royalty rights in the Ring of Fire mining district of Ontario and in December 2019 acquired a 1% gross royalty on the Eagle’s Nest nickel, copper and PGM deposit. 2025 2024 2023 Revenue to Franco-Nevada ($ million) $ – $ – $ – Ring of Fire (Cr) M&I Resource (Tonnes millions) 1 193 193 193 Inf. Resource (Tonnes millions) 1 55 55 55 P&P Reserves (Tonnes millions) 1 – – – Eagle’s Nest (PGM) M&I Resource ( koz PGM ) 1 1,408 1,408 1,408 Inf. Resource ( koz PGM ) 1 943 943 943 P&P Reserves ( koz PGM ) 1 – – – Eagle’s Nest (Ni) M&I Resource ( Mlbs Ni ) 1 375 375 375 Inf. Resource ( Mlbs Ni ) 1 249 249 249 P&P Reserves ( Mlbs Ni ) 1 – – – M&I Royalty Ounces (000s) 1,2 293 336 200 Inf. Royalty Ounces (000s) 2 86 99 61 P&P Royalty Ounces (000s) 2 – − – 1 Please refer to the tables on pages 126–134 for a breakout of grade and tonnages by Mineral Resource category; all M&I categories are inclusive of Mineral Reserves 2 For the Ring of Fire Royalty Ounce calculation, Franco-Nevada estimates 100% of the Mineral Resources are subject to our royalty interest and estimates a dollar per tonne value of $6.65/ tonne. For the Eagle’s Nest Royalty Ounce calculation, Franco-Nevada estimates 100% of the PGM and nickel Mineral Resources and Mineral Reserves are subject to our royalty interest and estimates an average rate of 1.0% is applicable for PGM and 0.7% for nickel (which factors a NSR smelting charge of 30%). PGM ounces are converted into Royalty Ounces assuming $2,000/ounce Pt ($950/ounce Pt in 2024, $850/ounce Pt in 2023) and $1,650/ ounce Pd ($950/ounce Pd in 2024, $900/ounce Pd in 2023) and nickel has been converted to Royalty Ounces assuming $7.39/lb ($7.89/lb in 2024, $7.89/lb in 2023). Copper Mineral Resources and Mineral Reserves are not included in the Royalty Ounce calculation The 2015 funding package allowed Noront Resources Ltd. (“Noront”) to acquire mining claims from Cliffs Natural Resources Inc. (“Cliffs”) in the Ring of Fire mining district, 500 km northeast of Thunder Bay. Franco-Nevada secured royalty rights over an estimated 1,000 km 2 area, offering long-term exposure in a potential new mining camp to one of the largest chromite resources globally, in addition to nickel, copper, and PGM deposits. Franco-Nevada holds a 3% royalty over the Black Thor chromite deposit, a 2% royalty over all of Noront’s property in the region (excluding the Eagle’s Nest deposit, see below), 2% on certain other properties previously being advanced by Cliffs, and a number of other third-party exploration royalties. In December 2019, Franco-Nevada acquired a 1% gross royalty on Noront’s Eagle’s Nest nickel, copper and PGM deposit, for $3.8 million. Eagle’s Nest currently has over 283 kt of contained nickel (15.7 Mt at 1.80% nickel) of high-grade nickel mineralization in Measured, Indicated and Inf. Mineral Resources, with significant copper, palladium and platinum content. Based on the current mine plan, Eagle’s Nest is forecasting an initial 15-year mine-life using selective underground mining methods at a rate of 3 ktpd. In 2022, Noront was acquired by Wyloo Metals Pty Ltd (“Wyloo Metals”), who are advancing the projects. In December 2022, Wyloo Metals (now known as Ring of Fire Metals) signed a Memorandum of Understanding with Webequie First Nation, and in February 2026 the Marten Falls First Nation filed an environmental assessment for a key access road linking its community to the provincial highway network. The Government of Ontario has awarded plans to start construction of 2 of the 3 road sections in June and August 2026. The Eagle’s Nest project also continues to be advanced, with the Federal government determining an impact assessment for the project is not required. Timing for construction and start of production at Eagle’s Nest is linked to the timeline of the current proposed road projects and infrastructure corridor. Ontario’s Bill 5, passed in June 2025, provides certain exemptions that could fast track the development of the Ring of Fire. Royalty licences 2% GR (Cr), 2% NSR (other) Wyloo licences Ring of Fire 1–3% NSR/GR kilometer 20 0 N Royalty licences 2–3% GR (Cr), 2–3% NSR (other) Thunderbird Blue Jay Black Label Black Thor Eagle’s Nest 1% GR Blackbird Eagle 2 Triple J Quebec Ontario Ring of Fire C A R I B O O Advanced Location: British Columbia, Canada | Operator: Osisko Development Corp. | Precious Metals: Au | Royalty: NSR: 3% Osisko Development Corp. (“Osisko Development”) is advancing the Cariboo Gold project in east-central British Columbia. Osisko Development mined the initial Bonanza Ledge II project, located within the Cariboo Gold project, briefly in 2021 and 2022. The Bonanza Ledge II Mineral Resource included the BC Vein, Bonanza Ledge, and KL Zone deposits. Franco-Nevada’s 3% NSR covers the KL Zone, which has an Indicated Mineral Resource of 47 koz of gold (0.5 millions tonnes at 2.80 g/t) and an Inf. Mineral Resource of 205 koz (2.5 Mt at 2.53 g/t). Franco-Nevada’s 3% royalty interest also includes the Williams Claims which are about 5 km southeast of Bonanza Ledge. The Bonanza Ledge II project was placed on care and maintenance in 2022 to prioritize the Cariboo Gold project feasibility study, which was released in 2023. Following the 2023 study, Osisko Development released an Optimized Feasibility Study in Q2 2025, which replaced the previous two-phase approach with a single-phase development plan. This updated plan envisions a 4,900 tonne per day operation with a 10-year mine life, yielding an average of 190 koz of gold annually (peaking at 223 koz). The current plan does not envision mining on Franco-Nevada’s royalties; however, the process plant and related infrastructure has been designed to accommodate potential future throughput expansions. In July 2025, Osisko Development entered into a US$450 million senior secured project loan facility with Appian Capital Advisory for the project and beyond the debt facility, has completed several equity financings. The project is in early construction, with Osisko Development targeting a final investment decision for full-scale construction in 2026. Following a positive decision, the feasibility study envisioned a 24-month build period with 2028 expected to be the first full year of commercial production. To support potential future throughput expansions, Osisko launched a 70,000 meter exploration program in late 2025 to test high-grade vein corridors at depth (down to 800 meters) and regional targets along the 12-kilometer strike length, including the KL Zone and Williams Creek target. Systematic drilling is planned to advance southeast from the Lowhee Zone toward the KL Zone and Williams Creek target, with results expected in Q4 2026. Franco-Nevada has not included Cariboo in Royalty Ounce estimates R E D M O U N T A I N Advanced Location: British Columbia, Canada | Operator: Cambria Gold Mines Inc. | Precious Metals: Au | Royalty: NSR: 1% / Production Payment Franco-Nevada has a 1% NSR as well as a $10/oz production payment on gold produced in excess of 1.85 Moz from the Red Mountain project near Stewart, B.C. Franco-Nevada acquired the royalty as part of the Barrick royalty portfolio in 2013. In 2019, Ascot Resources Ltd. (“Ascot”) acquired IDM Mining and its 100%-owned Red Mountain project and a revised feasibility study was released in 2020. In February 2026, Ascot was renamed Cambria Gold Mines Inc. (“Cambria”). The 2020 study envisioned feed from four deposits (Big Missouri, Silver Coin, Premier, and Red Mountain) being processed at the 2,500 tpd Premier mill, which is approximately 23 km southeast of the Red Mountain deposit. The Premier mill required refurbishment as it had been on care and maintenance for over 20 years, and while first gold was poured in April 2024, operations were suspended in September 2024 due to mine development delays and insufficient ore feed. Under Ascot, P&P Mineral Reserves of 0.5 Moz of gold (2.5 Mt at 6.52 g/t) were reported for Red Mountain. The project contains an inclusive M&I Mineral Resource of 0.78 Moz of gold (3.2 Mt at 7.63 g/t) and an Inf. Mineral Resource of 0.07 Moz of gold (0.4 Mt at 5.32 g/t). Following the completion of a C$175 million refinancing in January 2026, the company announced a restructuring in February 2026, during which Ascot was rebranded as Cambria and a new management team was appointed. Cambria’s new strategy pivots the mining sequence to access Red Mountain ore first, viewing its rapid development as the key to successfully recommissioning the centralized Premier mill. Under the revised mine plan, Red Mountain is expected to provide the majority of the mill feed, potentially blended with mineralization from other nearby deposits. Under this revised strategy, construction of the Red Mountain access road is scheduled to begin in H1 2026, subject to regulatory approval, supported by an updated feasibility study expected to be completed by Q3 2026. For Royalty Ounce calculation, Franco-Nevada estimates 100% of Mineral Resources and Mineral Reserves are subject to our royalty interest and estimates an average rate of 1.0% is applicable Royalty concession estimated to cover over 1,000 km² Permitting for the access road is ongoing TSX / NYSE: FNV Franco-Nevada Corporation ★ 71 70 ★ Franco-Nevada Corporation TSX / NYSE: FNV Canada Canada
N E W P R O S P E R I T Y Exploration Location: British Columbia, Canada | Operator: Taseko Mines Limited | Precious Metals: Au | Stream: Gold Stream 22% Franco-Nevada holds the right to acquire a 22% life of mine gold stream for $350 million on the New Prosperity project in British Columbia, owned by Taseko Mines Ltd. (“Taseko”). The deposit is one of the largest undeveloped copper gold porphyry deposits in Canada, hosting a M&I Mineral Resource of approximately 13 Moz of gold (1,010 Mt at 0.41 g/t) and 5.3 billion pounds of copper (1,010 Mt at 0.24%). A historical technical report outlines a 33-year mine life, with Franco-Nevada estimating potential contributions under its gold stream of approximately 62 kozpa. Under the streaming agreement, Franco-Nevada would make ongoing payments equal to the lesser of $400/oz (subject to inflation adjustments) or the prevailing gold price for each ounce delivered. In June 2025, Taseko announced an agreement with the T ŝ ilhqot’in Nation and the Province of British Columbia that provides a potential pathway to development, including the contribution of a 22.5% equity interest in the project to a trust for the benefit of the T ŝ ilhqot’in Nation and the initiation of a joint land use planning process. Franco-Nevada views the recent agreement with the T ŝ ilhqot’in Nation as a positive development and has included the historic resource in this Asset Handbook on page 134. However, the New Prosperity Technical Report has not been updated since 2009. While Franco-Nevada has estimated the potential Royalty Ounces related to New Prosperity based on the historical assessment, caution is advised when assessing the reliability of such resources. Royalty Ounces for New Prosperity were not included in our Royalty Ounce totals due to the uncertainty surrounding its development. For 2025, Franco-Nevada estimates that P&P royalty ounces, M&I royalty ounces and Inf royalty ounces would be 1,469 koz, 1,776 koz and 0 koz, respectively. For Royalty Ounce calculation, Franco-Nevada estimates it will receive 22% of gold produced and the stream interest has been factored by 89% to reflect $4,500/oz gold and $400/oz gold ongoing payments (subject to inflation adjustments) F E N E L O N / M A R T I N I E R E Exploration Location: Quebec, Canada | Operator: Wallbridge Mining Company Limited | Precious Metals: Au | Royalty: NSR: 1% (Fenelon), 2% (Martiniere) Franco-Nevada holds a 1% NSR on the Fenelon project and a 2% NSR on the Martiniere project located along the Detour-Fenelon Gold Trend in Quebec. Both projects are operated by Wallbridge Mining Company Limited (“Wallbridge”), with Martiniere sitting roughly 50 km east of the Detour Lake mine and Fenelon an additional 30 km east of Martiniere. The royalties were acquired by Franco-Nevada in September 2020 as part of a portfolio of 24 royalties from Freeport-McMoRan Inc. In March 2025, Wallbridge released an updated Preliminary Economic Assessment for the Fenelon property. The study outlined a 16-year mine life based on a production rate of 3 ktpd. The underground project is expected to yield average annual life of mine production of 107 koz of gold, with higher output of 127 koz of gold per year during the first five years. The Mineral Resource at Fenelon consists of a total Indicated Mineral Resource of 1.75 Moz of gold (15.09 Mt at 3.62 g/t), alongside an Inf. Mineral Resource of 1.65 Moz of gold (15.03 Mt at 3.41 g/t). At the Martiniere deposit, Indicated Mineral Resources currently consist of 346 koz of gold (4.70 Mt at 2.29 g/t), with an Inf. Mineral Resource of 387 koz of gold (3.87 Mt at 3.11 g/t). While Martiniere was not included in the March 2025 PEA, Wallbridge has 17,000 meters of drilling planned in 2026 with the objective of targeting a system expansion and evaluation of scale beyond current resources. For Royalty Ounce calculation, Franco-Nevada estimates 100% of Mineral Resources and Mineral Reserves are subject to our royalty interest and estimates a rate of 1.0% is applicable for Fenelon and 2.0% is applicable for Martiniere W A W A Exploration Location: Ontario, Canada | Operator: RPX Gold Inc. | Precious Metals: Au | Royalty: NSR: 1.5% Franco-Nevada holds a 1.5% NSR on the Wawa project, with an option to purchase an additional 0.5% upon a board-approved construction decision and completed feasibility study. RPX Gold Inc. recently completed a Preliminary Economic Assessment (PEA) for the Wawa project in Q1 2026. The 2026 Mineral Resource includes an Indicated Mineral Resource of 1.2 Moz (22.91 Mt at 1.69 g/t gold) and an Inf. Mineral Resource of 0.5 Moz (9.95 Mt at 1.59 g/t gold) across its open pit and underground deposits. The 2026 PEA outlines a 9 year life of mine operating at an average run-of-mine production rate of 2 ktpd. The phased development plan begins with three years of open pit mining yielding an average of 48 koz annually, before transitioning to an underground operation yielding an average of 74 koz annually. For Royalty Ounce calculation, Franco-Nevada estimates 100% of Mineral Resources and Mineral Reserves are subject to our royalty interest and estimates an average rate of 1.5% is applicable S P E N C E S B R I D G E ( W E S T H A V E N ) Exploration Location: British Columbia, Canada | Operator: Westhaven Gold Corp. | Precious Metals: Au | Royalty: NSR: 2% Franco-Nevada holds a 2% NSR (which is subject to a 0.5% buyback option), covering the Spences Bridge Gold Belt, which encompasses Westhaven Gold Corp.’s (“Westhaven”) four projects: Shovelnose, Prospect Valley, Skoonka, and Skoonka North. Westhaven released an updated PEA for the Shovelnose property in March 2025 and subsequently launched a drill campaign in early 2026. The high-grade underground mineral resource consists of a total Indicated Mineral Resource of 0.7 Moz (3.4 Mt at 6.1 g/t gold), alongside an Inf. Mineral Resource of 0.2 Moz (2.3 Mt at 3.7 g/t gold) (South Zone) and <0.1 Moz (0.06 Mt at 3.4 g/t gold) (Franz Zone). The 2025 PEA outlines an 11.1-year mine life based on a 1 ktpd production rate. The underground project is expected to yield average annual life of mine production of 56 koz of gold and 313 koz of silver. For Royalty Ounce calculation, Franco-Nevada estimates 100% of Mineral Resources and Mineral Reserves are subject to our royalty interest and estimates an average rate of 2.0% is applicable. Silver has been converted assuming $4,500/oz gold and $75.00/oz silver K E R R - A D D I S O N Exploration Location: Ontario, Canada | Operator: Gold Candle Ltd. | Precious Metals: Au | Royalty: NSR: 1% Gold Candle Ltd. (“Gold Candle”), a privately funded exploration company, is advancing the historic Kerr-Addison Project located in Virginiatown in McGarry Township, roughly 35 km east of Kirkland Lake along the Larder Lake Cadillac Break in Ontario. Gold Candle is aggressively exploring the near-mine and regional targets of the past-producing Kerr-Addison property. The updated 2025 Mineral Resource encompasses an open pit and underground resource totaling an Indicated Mineral Resource of 3.3 Moz (69.2 Mt at 1.5 g/t gold) and an Inf. Mineral Resource of 2.5 Moz (55.6 Mt at 1.3 g/t gold) The company is conducting mining, metallurgical, and environmental trade-off studies to support an inaugural Preliminary Economic Assessment scheduled for Q3 2026. The initial project phase is expected to focus on an open pit mine plan. For Royalty Ounce calculation, Franco-Nevada estimates 100% of Mineral Resources and Mineral Reserves are subject to our royalty interest and estimates an average rate of 1.0% is applicable TSX / NYSE: FNV Franco-Nevada Corporation ★ 73 72 ★ Franco-Nevada Corporation TSX / NYSE: FNV Canada Canada
United States Castle Mountain Mesquite Nevada Stibnite Gold Stillwater Sterling Robinson Bald Mountain Marigold Goldstrike Gold Quarry South Arturo Nevada South Railroad EaglePicher Copper World Project Copper Creek Producing Advanced Exploration Producing Advanced Exploration Mining Assets Precious Metals Diversified Granite Creek Arthur Gold Archimedes Mineral Point Cove Midas Sleeper Lone Tree R E D S T O N E ( C O A T E S L A K E ) Exploration Location: Northwest Territories, Canada | Operator: Redbed Resources Corp. | Precious Metals: Cu & Ag | Royalty: NSR: 3–4% Franco-Nevada holds a 3–4% sliding scale NSR (4% when copper price is greater than $1.00/lb) on the Coates Lake deposit located in the Redstone Copper belt in Northwest Territories, Canada. The Coates Lake deposit is a high-grade stratiform copper deposit containing a historic resource of 1.3 Mt of copper and 12.1 Moz of silver (33.4 Mt at 3.92% copper and 11.3 g/t silver). Mineralization has been demonstrated over a 6 km strike length with IP chargeability anomalies extending for a further 4 km towards the north. The deposit is open to the north, west and south and drill ready targets have been identified which may lead to significant expansion of known areas of mineralization in the future. Franco-Nevada has not included Redstone (Coates Lake) in Royalty Ounce estimates due to the historical nature of the resource A U R M A C Exploration Location: Yukon, Canada | Operator: Banyan Gold Corp. | Precious Metals: Au | Royalty: 1% NSR (Net of 5% Buyback) AurMac is in the Tombstone Gold Belt proximal to other precious metals mines and projects. Franco-Nevada has a 1% NSR (net of 5% buyback in favour of Banyan for C$10M) encompassing a 92 km 2 area, covering AurMac’s entire resource. Banyan Gold is advancing its 100% owned AurMac project located in the Mayo Mining district. AurMac hosts a significant resource base, with Indicated Mineral Resources of 2.3 Moz of gold (113 Mt at 0.63 g/t gold) and Inf. Mineral Resources of 5.5 Moz of gold (281 Mt at 0.60 g/t gold). The resource remains open in all directions and at depth, with potential for further expansion. Results from the 2025 drill program, which focused on optimizing economic parameters for an upcoming PEA (expected in H2-2026) by targeting conversion of block model waste into ore, have been positive and supports Banyan’s goal to delineate a high-grade starter pit of ~5 Moz at above 1 g/t gold targeting potential production of >300 kozpa of gold for over 20 years. A 40,000 meter drill program is currently underway, focused on expanding the mineralized envelope of the Airstrip and Powerline deposits, following up on high grade gold and high grade silver zones. Banyan Gold is targeting a resource update in Q2 2026 along with a maiden PEA in H2 2026. Franco-Nevada acquired the royalty on AurMac as part of a broader royalty portfolio (encompassing 5 other royalties) from Victoria Gold as part of its receivership process. For Royalty Ounce calculation, Franco-Nevada estimates 100% of Mineral Resources and Mineral Reserves are subject to our royalty interest and estimates an average rate of 1.0% is applicable (6.0% subject to a 5.0% buydown at the operator’s election) S C O T T I E Exploration Location: British Columbia, Canada | Operator: Scottie Resources Corp. | Precious Metals: Au | NSR: 2% Scottie Resources Corp. (“Scottie Resources”) is advancing the Scottie Gold Mine Project located in the Stewart Mining Camp within British Columbia’s Golden Triangle. Scottie Resources released a PEA in Q4 2025 and officially selected lead engineers for a Feasibility Study in March 2026. The 2025 Maiden Mineral Resource outlines an Inf. Resource of 0.7 Moz (3.6 Mt at 6.1 g/t gold) across open pit and underground targets. The PEA outlines a 7-year mine life based on a nominal average production rate of 1 ktpd. The project envisions a high-margin Direct-Ship Ore strategy that utilizes XRF ore-sorting to deliver a gold-bearing concentrate to Asian smelters. The operation is expected to average approximately 65,400 oz of gold annually. For Royalty Ounce calculation, Franco-Nevada estimates 100% of Mineral Resources and Mineral Reserves are subject to our royalty interest and estimates an average rate of 2.0% is applicable Franco-Nevada Corporation ★ 75 TSX / NYSE: FNV TSX / NYSE: FNV 74 ★ Franco-Nevada Corporation Canada
S O U T H A R T U R O Producing Location: Nevada, United States | Operator: Nevada Gold Mines LLC | Precious Metals: Au | Royalty: GR: 4–9% with AMR South Arturo consists of a series of sediment hosted Carlin-style gold deposits adjacent to and including the former Dee gold mine, 60 km northwest of Elko, Nevada. 2025 2024 2023 Revenue to Franco-Nevada ($ million) $ 37.8 $ 6.7 $ 2.4 M&I Resources (koz Au) 1,2 n/a n/a n/a Inf. Resources (koz Au) 1 n/a n/a n/a P&P Reserves (koz Au) 1 n/a n/a n/a M&I Royalty Ounces (000s) 2,3 n/a n/a n/a Inf. Royalty Ounces (000s) 3 n/a n/a n/a P&P Royalty Ounces (000s) 3 n/a n/a n/a 1 Please refer to the table on page 77 for the Carlin Trend Mineral Resources and Mineral Reserves which include South Arturo 2 All M&I categories are inclusive of Mineral Reserves 3 Please refer to the table on page 77 for the Carlin Trend Royalty Ounce calculation which includes South Arturo The mine is located in close proximity to Nevada Gold Mines’ Goldstrike operations where the ore is processed at the refractory facilities. Franco-Nevada holds a sliding scale gross royalty (4–9%) on production from South Arturo. Franco-Nevada estimates a 4% royalty rate for oxide mineralization and a 6% royalty rate for non-oxide. During 2025, mining occurred at the underground, El Niño deposit, and the Phase 1 open pit. Franco-Nevada received 9,747 GEOs in 2025 compared to 2,756 GEOs in 2024 as Phase 1 was the primary open pit asset for the Nevada Gold Mines Carlin operations. Nevada Gold Mines continues to work on optimizing the life of mine plan for the deposit which will be a combination of open pit and underground mining. The March 2025 Carlin Technical Report shows underground mining at El Niño completing in 2026 and open pit mining completing in 2027. Franco-Nevada expects another strong year of GEOs contribution from South Arturo in 2026. The El Niño ore is expected to be processed as it is mined while the lower grade open pit ore will be stockpiled and processed over time as processing capacity is available. South Arturo Pacific Ocean Oregon Idaho Utah Nevada California Arizona Mexico South Arturo 4–9% GR with AMR Royalty Property Pits Excluded from Royalty Exploration Targets Dee Phase 1 Pit Phase 3 Pit Phase 2: Open pit completed El Nino U/G: Currently developing East Dee Target South Hinge Target 4–9% GR 4–9% GR mile 1 0 N G O L D S T R I K E Producing Location: Nevada, United States | Operator: Nevada Gold Mines LLC | Precious Metals: Au | Royalty: NSR: 2–4% / NPI: 2.4–6% Franco-Nevada holds royalties covering the majority of the Nevada Gold Mines LLC (“Nevada Gold Mines”) Goldstrike complex. Carlin Trend 2025 2024 2023 M&I Resources (koz Au) 1,2 24,390 24,390 26,016 Inf. Resources (koz Au) 1,2 9,431 9,268 10,081 P&P Reserves (koz Au) 1,2 14,309 15,447 15,772 M&I Royalty Ounces (000s) 1,3 304 280 354 Inf. Royalty Ounces (000s) 3 118 106 137 P&P Royalty Ounces (000s) 3 179 177 215 1 Please refer to the tables on pages 126–134 for a breakout of grade and tonnages by Mineral Resource category for Carlin Trend; all M&I categories are inclusive of Mineral Reserves 2 Under the Nevada Gold Mines joint venture, Barrick now reports Goldstrike, Gold Quarry and South Arturo as part of the Carlin operation category. Mineral Resources and Mineral Reserves include Goldstrike, Gold Quarry and South Arturo as well as other properties where Franco-Nevada has no royalties or stream interests 3 For Royalty Ounce calculation, Franco-Nevada estimates 24% of the Carlin Trend Mineral Resources and Mineral Reserves (28% in 2024, 34% in 2023) are subject to our royalty interests on Goldstrike, Gold Quarry and South Arturo and estimates an average royalty rate of 5.2% is applicable (4.1% in 2024, 4.0% in 2023) Goldstrike 2025 2024 2023 Total NSR Revenue to FNV ($ million) $ 12.3 $ 8.6 $ 4.4 Total NPI Revenue to FNV ($ million) $ 10.5 $ 10.8 $ 8.7 Total Revenue to FNV ($ million) $ 22.8 $ 19.4 $ 13.1 M&I Resources (koz Au) 1 n/a n/a n/a Inf. Resources (koz Au) 1 n/a n/a n/a P&P Reserves (koz Au) 1 n/a n/a n/a M&I Royalty Ounces (000s) 2,3 n/a n/a n/a Inf. Royalty Ounces (000s) 3 n/a n/a n/a P&P Royalty Ounces (000s) 3 n/a n/a n/a 1 Please refer to the table above for the Carlin Trend Mineral Resources and Mineral Reserves which include Goldstrike 2 All M&I categories are inclusive of Mineral Reserves 3 Please refer to the table above for the Carlin Trend Royalty Ounce calculation which includes Goldstrike The Goldstrike complex is located on the Carlin Trend, about 60 km northwest of the town of Elko, Nevada and includes the open pit Betze-Post mine, as well as the underground operations of Meikle and Rodeo immediately to the north. Mining activity commenced on the property in 1976 and, since 1987, has been operated by Barrick. Franco-Nevada holds both NSR (2–4%) and NPI (2.4–6%) royalties at Goldstrike as well as royalties at Gold Quarry and South Arturo which cover over 50% of the reported Carlin Mineral Reserves. The Mineral Reserves estimated above include Goldstrike open pit stockpiles subject to both NSR and NPI royalties. The royalties vary depending on the claim blocks, operating costs and capital investments, as shown in the schematic. As a result, royalty payments can vary substantially on a quarterly basis. In 2019, Barrick (61.5%) and Newmont (38.5%) combined their significant assets across Nevada to create the Nevada Gold Mines joint venture. Under this joint venture, Goldstrike is reported as part of the Carlin operation category by Barrick. Barrick announced 2025 production of 687 koz of gold from its 61.5% share of Carlin interests. Nevada Gold Mines noted that Carlin gold production for 2025 was 11% lower compared to 2024 due to lower underground grades mined, more Cortez ore displacing lower grade Carlin stockpiles and less leach pad production due to sequencing of the Gold Quarry open pit. Barrick has reported 2026 production guidance of 600–670,000 gold ounces from its 61.5% share of Carlin. Franco-Nevada anticipates 2026 Goldstrike royalty payments to be similar to 2025 as royalties on the underground material are expected to offset less stockpile production. Weimer 4% NSR Goldstrike Open Pit Mine Goldstrike Underground Mine Meikle/Rodeo SPLC Lease 6% NPI Bazza 2% NSR Bazza Strip 2% NSR 2.4% NPI Royal 3% NSR Extension 5% NPI 4% NSR Corbett 2% NSR Pandora 2% NSR Rodeo Creek 4% NSR Above 4600’ Post 5% NPI 4% NSR SJ 6% NPI Gold Bug 5% NPI 4% NSR Goldstrike 5% NPI 4% NSR Goldstrike Pacific Ocean Oregon Idaho Utah Nevada California Arizona Mexico Goldstrike Open Pit Mine FNV Royalties Goldstrike Underground mine Goldstrike 2–4% NSR / 2.4–6% NPI mile 0 1 N Focus asset for NGM with substantial invested capital Profit royalties provide more leverage to gold prices Current operator mine life of 18 years Significant GEO contributor in 2026 Close proximity to Goldstrike processing facilities The operator currently has a 2-year mine plan TSX / NYSE: FNV Franco-Nevada Corporation ★ 77 76 ★ Franco-Nevada Corporation TSX / NYSE: FNV United States United States
B A L D M O U N T A I N Producing Location: Nevada, United States | Operator: Kinross Gold Corporation | Precious Metals: Au | Royalty: NSR / GR: 0.875–5% The Bald Mountain mine lies within the Southern Ruby Mountains of northeastern Nevada along the southern extension of the prolific Carlin Trend, 110 km southeast of Elko. 2025 2024 2023 Revenue to Franco-Nevada ($ million) $ 20.6 $ 16.8 $ 11.7 M&I Resources (koz Au) 1 3,773 3,856 4,175 Inf. Resources (koz Au) 1 790 571 489 P&P Reserves (koz Au) 1 1,225 1,173 489 M&I Royalty Ounces (000s) 1,2 112 119 157 Inf. Royalty Ounces (000s) 2 21 14 18 P&P Royalty Ounces (000s) 2 26 23 19 1 Please refer to the tables on pages 126–134 for a breakout of grade and tonnages by Mineral Resource category; all M&I categories are inclusive of Mineral Reserves 2 For Royalty Ounce calculation, Franco-Nevada estimates 100% of Mineral Reserves (100% in 2024, 100% in 2023) and 99% of Mineral Resources (inclusive of Mineral Reserves) (99% of Mineral Resources inclusive of Mineral Reserves in 2024, 99% in 2023 exclusive of Mineral Reserves) are subject to our royalty interest and estimates an average rate of 2.15% is applicable for Mineral Reserves (1.92% in 2024, 3.79% in 2023), 3.01% is applicable for M&I Mineral Resources (inclusive of Mineral Reserves) (2.53% in 2024, 3.79% in 2023 exclusive of Mineral Reserves) and 2.72% is applicable for Inf. Mineral Resources (2.53% in 2024, 3.79% in 2023) Ore is sourced from multiple open pits over an estimated 600 km 2 property with processing at multiple conventional heap leaching facilities. Bald Mountain is the largest private mining land package in the U.S. It stretches 40 km north to south and 15 km east to west and is divided in three zones: North Zone, South Zone and JV Zone. Franco-Nevada’s Bald Mountain royalties cover a significant portion of the Bald Mountain property. Royalty rates range from 0.875%–5% NSR/GR. A detailed map of the royalties is shown in the schematic. At the end of 2015, Kinross Gold Corporation (“Kinross”) purchased from Barrick 100% of the North and South Zones while forming a 50/50 exploration joint venture partnership with Barrick on the JV Zone in between the North and South Zones. During 2018, Kinross acquired the remaining 50% portion of the JV Zone that it did not already own and is now the 100% owner of the full property. In 2025, 12.7 Mt of ore were placed on pads at Bald Mountain at a grade of 0.42 g/t versus 18.4 Mt of ore at a grade of 0.48 g/t in 2024. Bald Mountain produced 179,169 oz in 2025, comparable to the 181,047 oz produced in 2024. The decrease in ounces placed on the heap leach pads and grade were offset by the timing of ounces recovered from the heap leach pads. In December 2024, Kinross converted approximately 1.0 Moz to reserves, and made the decision to proceed with mining of Phase 1 at the Redbird pit. Following the success of Phase 1, in January 2026 the Company announced that it would be proceeding with the development of Redbird 2. The Redbird 2 project consists of Phase 2 of the Redbird pit along with five additional satellite pits that combined are expected to incrementally produce a total of approximately 640,000 gold oz. First production at Redbird 2 is expected in 2028, with average production of approximately 155,000 gold oz per year between 2028– 2031. This extends production at Bald Mountain until early 2032. The project leverages the existing infrastructure, equipment, and workforce at Bald Mountain, continuing the long history of successful open pit heap leach operations on the extensive land package of which Franco-Nevada royalties cover 99% of the 2025 year-end resource. With a M&I Resource of 145 Mt at a grade of 0.5 g/t containing 2.5M gold oz and a pipeline of high-quality targets, Kinross is exploring further opportunities for additional resource conversions and exploration success. S T I L L W A T E R Producing Location: Montana, United States | Operator: Sibanye Stillwater Limited | Precious Metals: PGM | Royalty: NSR: 5% The Stillwater complex in Eastern Montana is comprised of the Stillwater mine (West and East) and East Boulder mine and is operated by Sibanye Stillwater Limited (“Sibanye-Stillwater”). 2025 2024 2023 Revenue to Franco-Nevada ($ million) $ 15.4 $ 21.2 $ 26.1 M&I Resources (koz PGM) 1 39,800 38,100 44,100 Inf. Resources (koz PGM) 1 41,100 41,100 43,700 P&P Reserves (koz PGM) 1 19,400 19,000 26,300 M&I Royalty Ounces (000s) 1,3 675 570 886 Inf. Royalty Ounces (000s) 2,3 697 615 878 P&P Royalty Ounces (000s) 2,3 329 284 529 1 Please refer to the tables on pages 126–134 for a breakout of grade and tonnages by Mineral Resource category; all M&I categories are inclusive of Mineral Reserves 2 For Royalty Ounce calculation, Franco-Nevada estimates 98% of the Mineral Resources and Mineral Reserves are subject to our royalty interest 3 Given more significant smelting and refining charges, Franco-Nevada estimates an average rate of 4.50% is applicable (assuming 10% for charges) and PGM ounces converted into Royalty Ounces assuming $2,000/ounce Pt and $1,650/ounce Pd ($950/ounce Pt and $950/ounce Pd in 2024, $850/ounce Pt and $900/ounce Pd in 2023) Production began in 1986 at the Stillwater mine and in 2002 at the East Boulder mine. In 2014, the operator commenced the Blitz project which included developing a third access at Stillwater East. The production from the PGM orebodies is primarily palladium and platinum (“2E PGM”), representing 78% and 22%, respectively. Sibanye Gold Limited acquired Stillwater Mining Corporation in May 2017. Franco-Nevada has a 5% NSR royalty on all commercially recoverable metals produced from 810 of the 1,712 claims that cover the Stillwater complex. The amount of the royalty is reduced by permissible “onward processing” deductions, which have averaged between 10–15% of revenue over the last several years. Based on Franco-Nevada’s estimates, the NSR royalty currently covers 97% of the Stillwater Mineral Reserves and 100% of the East Boulder Mineral Reserves. Franco-Nevada’s royalty covers all current mining activity at Stillwater as the partial coverage only applies to Stillwater West, which was put on care and maintenance at the end of 2024. 2025 production decreased to 284,069 2E PGM ounces compared to 425,842 2E PGM ounces in 2024 due to restructuring of the operations in Q4 2024. The restructuring placed the Stillwater West mine on care and maintenance, with production focusing on lower volume, higher margin production from the East Boulder and Stillwater East mines. Production for 2026 is forecasted to be between 280 and 300 2E PGM koz as the operation continues to focus on lowering the cost structure to support sustained profitability. Sibanye-Stillwater announced in April 2026 plans to implement full in-stope mechanisation to drive productivity enhancements. This plan is expected to increase annual production to approximately 410 2E PGM kozpa by 2029 at unit costs of $1,000/2E PGM ounce. Stillwater West is expected to remain in care and maintenance during this period and provides future optionality and upside. The recent Section 45X tax credits as well as possible tariffs on Russian palladium could further support margins and production growth at the operations. The Stillwater and East Boulder reserves support a long mine life in excess of 35 years. Stillwater Wyoming AB SK MB North Dakota Nebraska Idaho Utah Colorado Montana South Dakota Stillwater Complex 5% NSR mile 0 1 N Franco- Nevada Royalty Franco- Nevada Royalty East Boulder Portal Site East Boulder Adit Stillwater Mill Site Camp Lake Boulder River East Boulder River Dry Fork Creek Lewis Gulch West Fork Stillwater Stillwater River Limit of Claims Sweetgrass Co. Park Co. Stillwater Co. Sweetgrass Co. County line Long Section (Not to scale) Plan View Stillwater East (Blitz) Stillwater West East Boulder Mine Non-Royalty mill area Lower Stillwater East (Lower Blitz) Current and future planned production layouts Franco-Nevada Royalty Land Large land package and significant exploration upside The operator currently has a 7-year mine plan. M&I Resources could support production for 24 years and Inf. Resources for a further 5 years FNV Royalties Excluded from Royalty Pits/Deposits * Subject to possible reduction by third-party royalty North Block South Block Galaxy Poker Flats Bida Saga Yankee Targets Lux/Vantage Targets Top Sage Flats Belmont Horseshoe 4% NSR 4% NSR 4% NSR 4% NSR 4% NSR * 4% NSR * 4% NSR * 4% NSR * 4% NSR * 4% NSR * 4% NSR * 0.875 to 1.75% NSR 2.418% NSR Royale 1%-5% GR Redbird 5 1 LJ Ridge Banghart South Ridge Rat North Duke South Duke 2/3 1%-5% GR Winrock Bald Mountain Oregon Idaho Utah Nevada California Arizona Mexico Pacific Ocean Bald Mountain 0.875–5% NSR / GR kilometer 2 0 N Only primary PGM producer in the U.S. Production likely to recover from current levels provided PGM prices remain robust The operator currently has a 35-year mine plan. M&I Resources could support production for 80 years and Inf. Resources for a further 83 years TSX / NYSE: FNV Franco-Nevada Corporation ★ 79 78 ★ Franco-Nevada Corporation TSX / NYSE: FNV United States United States
kilometers 1 0 N Reserves 8.91% NSR Resources Gold Quarry Pit Outline Tusc Pit Outline >0.3 g/t Au Gold Quarry 8.91% NSR 8.91% NSR FNV Royalties Gold Quarry Pacific Ocean Oregon Idaho Utah Nevada California Arizona MEXICO M A R I G O L D Producing Location: Nevada, United States | Operator: SSR Mining Inc. | Precious Metals: Au | Royalty: NSR: 1.75–5% / GR: 0.5–4% The Marigold mine is located 64 km southeast of Winnemucca, Nevada on the Battle Mountain-Eureka Trend and is operated by SSR Mining Inc. (“SSR Mining”). 2025 2024 2023 Revenue to Franco-Nevada ($ million) $ 9.6 $ 6.5 $ 11.2 M&I Resources (koz Au) 1 5,044 5,166 4,603 Inf. Resources (koz Au) 1 453 249 370 P&P Reserves (koz Au) 1 3,237 3,256 2,863 M&I Royalty Ounces (000s) 1,2 81 95 113 Inf. Royalty Ounces (000s) 2 3 5 9 P&P Royalty Ounces (000s) 2 58 60 70 1 Please refer to the tables on pages 126–134 for a breakout of grade and tonnages by Mineral Resource category; all M&I categories are inclusive of Mineral Reserves 2 For Royalty Ounce calculation, Franco-Nevada estimates 77% of the Mineral Reserves (81% in 2024, 96% in 2023), 74% of the M&I Mineral Resources (81% in 2024, 96% in 2023) and 50% of the Inf. Mineral Resources (81% in 2024, 96% in 2023) are subject to our royalty interest and estimates a rate of 2.34% is applicable for Mineral Reserves (2.28% in 2024, 2.55% in 2023), 2.19% is applicable for M&I Mineral Resources (inclusive of Mineral Reserves) (2.28% in 2024, 2.55% in 2023) and 1.49% is applicable for Inf. Mineral Resources (2.28% in 2024, 2.55% in 2023) The mine has been in continuous production since 1989 and is a large run-of-mine heap leach operation with several open pits. Marigold achieved 5.0 Moz of life of mine gold production in December 2024. Franco-Nevada has various royalties on the operation (1.75–5% NSR and 0.5–4% GR), as shown in the schematic, together covering a significant portion of the current Mineral Reserve base. In 2025, 19.3 Mt of ore were placed on pads at a grade of 0.39 g/t gold versus 27.7 Mt of ore placed on pads at a grade of 0.28 g/t gold in 2024. The mine produced 153,535 oz of gold versus 168,262 oz in 2024. 2026 gold production is expected to be between 170–200 koz. SSR Mining plans to invest $108M in sustaining capital at Marigold in 2026 primarily focused on fleet improvements to enable the development of a number of potentially significant mine life extension opportunities. An updated LOM production profile and technical report is expected within the next 12–18 months. Royalty payments to Franco-Nevada will fluctuate depending on where mining activity is occurring and are expected to increase in the medium term as mining moves onto higher royalty rate ground. SSR Mining’s strategy to advance brownfields targets proximal to existing infrastructure continues to yield encouraging results and the company plans to continue its exploration drilling in 2026 with a $48 million budget. The focus will be on oxide mineral reserve additions and conversion at Buffalo Valley, Mackay, Valmy and New Millennium. Franco-Nevada royalty ground covers Mackay and portions of the Valmy and New Millennium targets. Valmy Buffalo Valley and Trenton Canyon to the south. No FNV Royalty 5 North Pits 8 North Pit 8 South New Millennium Basalt & Antler Terry Zone North Terry Zone 1.75% NSR 1.75% NSR 1.75% NSR 1.75% NSR 5% NSR 5% NSR 5% NSR 5% NSR 5% NSR 5% NSR 5% NSR 5% NSR 5% NSR 5% NSR 5% NSR 5% NSR 3% NSR* 3% NSR* 3% NSR* 2.5%–4% GR* 2.5%–4% GR* 2.5%-4% GR* 2.5%–4% GR* 5% NSR 1.75% NSR Schematic Representation Only Valmy Mud Pits Red Dot Target Pit 2.5%– 4% GR* 0.5%–1.5% GR* Mackay Pit Marigold 1.75–5% NSR / 0.5–4% GR mile 1 0 Marigold Pacific Ocean Oregon Idaho Utah Nevada California Arizona MEXICO FNV Royalties Excluded from Royalty Pits * December 2009 Acquisition N G O L D Q U A R R Y Producing Location: Nevada, United States | Operator: Nevada Gold Mines LLC | Precious Metals: Au | Royalty: NSR: 8.91% 4 The Gold Quarry operation is part of the Nevada Gold Mines Carlin operations in north-central Nevada. 2025 2024 2023 Revenue to Franco-Nevada ($ million) $ 5.0 $ 3.0 $ 3.0 M&I Resources (koz Au) 1,2 n/a n/a n/a Inf. Resources (koz Au) 1 n/a n/a n/a P&P Reserves (koz Au) 1 n/a n/a n/a M&I Royalty Ounces (000s) 2,3 n/a n/a n/a Inf. Royalty Ounces (000s) 3 n/a n/a n/a P&P Royalty Ounces (000s) 3 n/a n/a n/a 1 Please refer to the table on page 77 for the Carlin Trend Mineral Resources and Mineral Reserves which include Gold Quarry 2 All M&I categories are inclusive of Mineral Reserves 3 Please refer to the table on page 77 for the Carlin Trend Royalty Ounce calculation which includes Gold Quarry 4 Current minimum ounce payments expected unless significant change to key parameters Gold Quarry is a large open pit mine that has been in production since 1985 supplying ore as part of an integrated mining and processing complex. In 2019, Barrick (61.5%) and Newmont (38.5%) combined their significant assets across Nevada to create Nevada Gold Mines as a joint venture. Under this joint venture, Barrick reports Gold Quarry under its Carlin operations category and Newmont reports Gold Quarry under its Nevada Gold Mines category. Franco-Nevada’s royalty interest covers only a portion of the Gold Quarry property, as shown in the schematic. The Gold Quarry royalty is an 8.91% NSR. Franco-Nevada’s interest increased by 1.62% in 2025 due to the acquisition of a third-party royalty during the year. NSR payments are based on production, backstopped by three minimum payment obligations. The annual minimum royalty payment calculation is tied to Mineral Reserves and stockpiles attributed to the Gold Quarry royalty property. If reserves, or production levels on royalty ground increase, it is possible Franco-Nevada would return to higher levels of annual royalty payments. Franco-Nevada has received 1,350 GEOs per year since 2021 based on these backstops and expects this to increase to 1,650 GEOs per year starting in 2026 due to the above mentioned incremental royalty interest acquired by Franco-Nevada in 2025. In the medium term, Franco-Nevada expects its royalty from Gold Quarry to be 1,650 GEOs per annum, as the cumulative prepaid ounces delivered by Gold Quarry exceeds the attributable Gold Quarry known Mineral Reserves, which represents the lowest level of the minimum payment obligations. Production growth expected in 2026 Continued resource expansion and encouraging exploration results The operator currently has a 7-year mine plan. M&I Resources could support production for 23 years and Inf. Resources for a further 2 years Annual minimum payment obligations Gold Quarry expected to be the open pit focus of Nevada Gold Mines’ Carlin operations beginning in 2027 Royalty registered on private lands The operator currently has a 11-year mine plan. M&I Resources could support production for 24 years TSX / NYSE: FNV Franco-Nevada Corporation ★ 81 80 ★ Franco-Nevada Corporation TSX / NYSE: FNV United States United States
M E S Q U I T E Producing Location: California, United States | Operator: Equinox Gold Corp. | Precious Metals: Au | Royalty: NSR: 0.5–2% Mesquite is a gold operation located in southeast California, 70 km northwest of Yuma, Arizona and 230 km east of San Diego, California. 2025 2024 2023 Revenue to Franco-Nevada ($ million) $ 5.5 $ 3.2 $ 3.1 M&I Resources (koz Au) 1 1,213 1,855 1,016 Inf. Resources (koz Au) 1 55 912 510 P&P Reserves (koz Au) 1 125 471 584 M&I Royalty Ounces (000s) 1,2 22 34 19 Inf. Royalty Ounces (000s) 2 1 17 9 P&P Royalty Ounces (000s) 2 2 9 11 1 Please refer to the tables on pages 126–134 for a breakout of grade and tonnages by Mineral Resource category; all M&I categories are inclusive of Mineral Reserves 2 For Royalty Ounce calculation, Franco-Nevada estimates 100% of the Mineral Resources and Mineral Reserves are subject to our royalty interest and estimates a rate of 1.85% is applicable The mine is an open pit, run-of-mine, heap leach operation. Franco-Nevada holds royalties on the entire Mesquite mine property that range from a 0.5–2% NSR, depending on the claim block, as shown on the schematic. Mesquite produced 85,998 oz of gold in 2025, an increase from 71,984 oz of gold produced in 2024 due to reaching the major ore source of the Ginger pit in March 2025 which had higher grades than the material mined in 2024. For 2026, Equinox Gold anticipates production of 70–80 koz of gold. Mining at Mesquite in 2026 will be focused on Brownie phase 4, Rainbow North and the Big Chief 8 pits. Equinox continues to work to extend the mine life at Mesquite through exploration and permitting with a $5 million to $10 million budget for 2026. Mesquite, California Brownie Big Chief Rainbow Vista 2% NSR 0.5% NSR 1% NSR Mesquite 0.5 –2% NSR Mesquite Pacific Ocean Oregon Idaho Utah Nevada California Arizona Mexico Royalty Property Pits mile 1 0 N C A S T L E M O U N T A I N Producing Location: California, United States | Operator: Equinox Gold Corp. | Precious Metals: Au | Royalty: NSR: 2.65 –4.65% The Castle Mountain mining property is located in California, close to the Nevada border and is in the historic Hart Mining District, 120 km south of Las Vegas, Nevada. 2025 2024 2023 Revenue to Franco-Nevada ($ million) $ 0.8 $ 1.3 $ 1.1 M&I Resources (koz Au) 1 5,575 5,638 5,638 Inf. Resources (koz Au) 1 1,422 1,422 1,422 P&P Reserves (koz Au) 1 4,105 4,168 4,168 M&I Royalty Ounces (000s) 1,2 157 159 159 Inf. Royalty Ounces (000s) 2 40 40 40 P&P Royalty Ounces (000s) 2 116 118 118 1 Please refer to the tables on pages 126–134 for a breakout of grade and tonnages by Mineral Resource category; all M&I categories are inclusive of Mineral Reserves 2 For Royalty Ounce calculation, Franco-Nevada estimates 100% of the Mineral Resources and Mineral Reserves are subject to our royalty interest and estimates a rate of 2.82% is applicable The Castle Mountain mine is operated by Equinox Gold and has land holdings that total greater than 40 km 2 of patented and unpatented claims. The mine was previously operated by Viceroy Gold and MK Resources and produced over 1.2 Moz of gold. Franco-Nevada holds a 2.65% NSR covering all the existing Castle Mountain mine and extending 10 miles from the boundary of the mine. In addition, Franco-Nevada acquired the ‘American Standard’ 2% NSR on the Pacific Clay claims, which comprise a portion of the JSLA pit in 2022. When combined with the 2.65% NSR, Franco-Nevada has a 4.65% NSR on the Pacific Clay claims. Redevelopment of Castle Mountain was planned in two phases. Small scale operations were initiated in Phase 1 while permits were progressed for Phase 2. In September 2024, mining operations at Castle Mountain were suspended to focus on Phase 2 permitting. Once permitted, Phase 2 is expected to produce approximately 220 kozpa of gold during a 12 plus year mine life. Equinox plans to issue an updated feasibility study in the second half of 2026. In June 2025, the Castle Mountain Expansion was accepted as a FAST-41 Project, and all federal permits are expected by the end of 2026 with an investment decision expected during the first half of 2027. The 2021 feasibility study showed a two-year construction period which would put first production from Phase 2 in 2029. Castle Mountain Mine Las Vegas Los Angeles Mexico California Nevada Oro Belle Mined Pit Jumbo Mined Pit JSLA Mined Pit South Waste Dump West Waste Dump Pacific Clay claims 4.65% NSR Heap Leach Pad 2.65% NSR Castle Mountain 2.65–4.65% NSR *Plus 10 Mile Area of Interest Royalty lands 2.65% NSR Pits Pacific Clay Claims 4.65% NSR 1,000 metre 0 2,000 N Largest operating gold mine in California Ongoing resource expansion and permitting to enable mine life extension The operator currently has a 2-year mine plan. M&I Resources could support production for 16 years and Inf. Resources for a further 1 year Permitting Phase 2 expansion to increase production to 220 koz per year Franco-Nevada’s royalty covers entire project area with a 10-mile area of interest The operator currently has a 14-year mine plan. M&I Resources could support production for 25 years and Inf. Resources for a further 6 years TSX / NYSE: FNV Franco-Nevada Corporation ★ 83 82 ★ Franco-Nevada Corporation TSX / NYSE: FNV United States United States
R O B I N S O N Producing Location: Nevada, United States | Operator: KGHM International Ltd. | Metals: Cu, Mo, Ag & Au | Royalty: NSR: 0.225% / other The Robinson open pit mining complex, operated by KGHM, produces copper, gold, silver and molybdenum and is located near Ely, Nevada. Franco-Nevada has three royalties covering the Robinson mine: 1. 0.225% NSR on all base metal and associated precious metal production; 2. 10% NSR on 51% of the gold production from the property in excess of 60 koz of gold per year; and 3. under a copper agreement, a price participation royalty on 51% of 40% of each pound of copper production from the property in excess of 130 Mlbs of copper produced per annum, multiplied by the spot price, less $1.00/lb adjusted for inflation (based on 1990 dollars). Amounts are only payable in any year in which the average price of copper during that year exceeds a $1.00/lb threshold, as adjusted for inflation (based on 1990 dollars). Franco-Nevada will likely only be paid on the base 0.225% NSR royalty for 2026 as production is expected to be below the royalty threshold level. In 2025, Robinson ceased extraction from Ruth West 5 (“RW5”) and is now mining from the Liberty pit as well as preparing Tripp-Veteran for mining. Liberty ore is of lower quality compared to RW5, which is expected to impact results in the coming quarters. Due to this, Franco-Nevada expects royalty revenue in 2026 to be slightly lower than 2025. Robinson currently has a 12-year mine life and Franco-Nevada expects annual royalty revenue to remain relatively consistent over that period. For Royalty Ounce calculation, Franco-Nevada estimates 100% of the gold and copper Mineral Resources and Mineral Reserves are subject to our royalty interest and estimates an average rate of 0.225% is applicable for gold and 0.1913% for copper (which factors a NSR smelting charge of 15%). Copper has been converted to Royalty Ounces assuming $5.50/lb ($4.25/lb in 2024, $3.75/lb in 2023) E A G L E P I C H E R Producing Location: Nevada, United States | Operator: US Silica Holdings, Inc. | Metals: De | Royalty: Production Payment EaglePicher is a diatomaceous earth operation in Pershing County, Nevada, located about 23 miles northwest of Lovelock. The royalty is based on a fixed payment per ton which fluctuates based on the average sales price from the prior year’s sales. The royalty covers approximately 15 km 2 of checkerboard lands. The intervening lands are public and EaglePicher holds unpatented placer claims on those lands as needed for mining. The mine has been in continuous operation since the 1950s with approximately 65% of production coming from Franco-Nevada land. The BLM approved an Environmental Assessment permit for the operation in 2024 which allows for additional disturbance and mine life extension. The current resource supports a mine life into the late 2030’s with exploration potential to further expand the mine life. The revenue received from EaglePicher in 2024 and 2025 was $463,000 and $613,000, respectively. Franco-Nevada has not included EaglePicher in Royalty Ounce estimates i - 8 0 G O L D A S S E T S Producing Location: Nevada, United States | Operator: i-80 Gold Corp. | Precious Metals: Au & Ag | Royalty: NSR: 1.5–3% In February 2026, Franco-Nevada acquired a 1.5% NSR which increases to 3% in 2031 on all minerals produced from Granite Creek, the Ruby Hill Property (including Archimedes and Mineral Point), Cove and Lone Tree. 2025 2024 2023 Revenue to Franco-Nevada ($ million) $ – $ – $ – M&I Resources (koz Au) 1 6,518 – – Inf. Resources (koz Au) 1 7,482 – – P&P Reserves (koz Au) 1 – – – M&I Resources (koz Ag) 1 127.7 – – Inf. Resources (koz Ag) 1 102.9 – – P&P Reserves (koz Ag) 1 – – – M&I Royalty Ounces (000s) 1,2 235 – – Inf. Royalty Ounces (000s) 2 269 – – P&P Royalty Ounces (000s) 2 – – – 1 Please refer to the tables on pages 126–134 for a breakout of grade and tonnages by Mineral Resource category; all M&I categories are inclusive of Mineral Reserves 2 For Royalty Ounce calculation, Franco-Nevada estimates 100% of the Mineral Resources and Mineral Reserves from Granite Creek, the Ruby Hill Complex (including Archimedes and Mineral Point), Cove and Lone Tree are subject to our royalty interest and estimates a rate of 1.5% is applicable which increases to 3.0% in 2031. Applicable production for both royalty rates has been approximated using the Q1 2025 PEA studies for each deposit The royalties also include a one-mile AOI beyond each property boundary. The royalty acquisition was part of i-80 Gold’s recapitalization plan to advance all projects through various stages of development and fund the refurbishment of the Lone Tree Autoclave plant. The Lone Tree Autoclave will be the only Autoclave in Nevada not owned by Nevada Gold Mines, giving i-80 Gold the ability to process refractory ore from underground development projects. Granite Creek – Producing: The Granite Creek property includes the currently producing underground operation and the advanced stage open pit resource. Ore from the underground is currently sold through a toll milling agreement until the Lone Tree Autoclave is refurbished, expected in 2028. The underground is expected to produce 30–40 koz of gold in 2026 and an updated feasibility study is expected mid-2026. Recent drilling at the South Pacific Zone demonstrates potential for resource expansion and will be advanced with a $10 million budget in 2026. The Granite Creek open pit resource will be advanced through permitting and technical studies through 2027 with construction starting in 2028 and first gold production in H2 2029. In addition to the interest acquired in February 2026, Franco-Nevada holds incremental NSR royalties ranging from 0.083% to 2.0% on the southern portions of the open pit resource. Archimedes and Mineral Point (part of the Ruby Hill Property) - Advanced: Construction commenced at the Archimedes underground in Q3 2025. Infill drilling of the deposit will be completed in Q2 2026 with first gold production expected in late 2026. Ore from Archimedes is planned to be sold through the same toll milling agreement as Granite Creek. A feasibility study is anticipated to be completed in Q1 2027, and ore will be sent to the Lone Tree Autoclave once refurbishment is complete. Mineral Point is a large oxide Au-Ag deposit with the potential to become one of Nevada’s largest open pit operations. In 2026, i-80 plans to perform ~131,000 meters of drilling with a $40 million to $45 million budget to update the Mineral Resource and provide data for a pre- feasibility/feasibility study, which is anticipated in H1 2027. Permitting and technical work will be advanced through 2029 with construction beginning in 2030 and first gold production estimated in H2 2031. Cove – Advanced: Cove is an underground resource and has high-grade brownfield gold deposits open for expansion. Permitting and technical work will be advanced through 2027 with construction beginning in 2028 and first gold production anticipated in H2 2029. Ore from Cove would be sent to the Lone Tree Autoclave for processing. In addition to the NSR, acquired as part of the Victoria Gold royalty portfolio in early 2026, Franco-Nevada holds cumulative production payment rights of C$5 million each, due upon production of 250,000, 500,000, 750,000 and 1,000,000 troy ounces of gold from the project. Lone Tree – Exploration: Lone Tree is a past producing open pit mine which ended mining activity in 2006. The property contains 428 koz of Indicated Mineral Resource and 2.8 Moz of Inf. Mineral Resource. i80 Gold Oregon Idaho Utah Nevada California Arizona Mexico Pacific Ocean Highway 50 Interstate 80 i-80 Gold Assets 1.5–3% NSR 25 0 kilometers N Lone Tree Granite Creek Cove Mineral Point and Archimedes Franco-Nevada Royalty Land Area of Interest ~200 kozpa AuEq by 2030 from 3 refractory deposits processed at Lone Tree Autoclave Additional 400 kozpa AuEq beyond 2030, anchored by Mineral Point and Granite Creek open pit Royalty covers expansive >250 km² land package with >16 Moz AuEq in total resources The operator currently has a 22-year mine plan TSX / NYSE: FNV Franco-Nevada Corporation ★ 85 84 ★ Franco-Nevada Corporation TSX / NYSE: FNV United States United States
S T I B N I T E G O L D Advanced Location: Idaho, United States | Operator: Perpetua Resources Corp. | Precious Metals: Au & Ag | Royalty: NSR: 1.7% Au, 100% Ag³ The Stibnite project is located in a historic mining town of the same name in Idaho, about 153 km northeast of Boise and is one of the highest grade open pit deposits in the U.S. 2025 2024 2023 Revenue to Franco-Nevada ($ million) $ − $ − $ − M&I Resources (koz Au) 1 6,320 6,317 6,317 Inf. Resources (koz Au) 1 1,611 1,611 1,611 P&P Reserves (koz Au) 1 4,819 4,816 4,816 M&I Royalty Ounces (000s) 1,2 131 123 107 Inf. Royalty Ounces (000s) 2 33 31 27 P&P Royalty Ounces (000s) 2 98 93 82 1 Please refer to the tables on pages 126–134 for a breakout of grade and tonnages by Mineral Resource category; all M&I categories are inclusive of Mineral Reserves 2 For Royalty Ounce calculation, Franco-Nevada estimates 100% of the Mineral Resources and Mineral Reserves are subject to our royalty interest and for gold estimates a rate of 1.70% is applicable and that for silver, all of the payable silver by-product revenue over the life of mine will be received. Silver has been converted assuming $4,500/oz gold and $75.00/oz silver 3 Silver royalty is based on the expected payable silver with certain adjustments related to antimony concentrates The project is being advanced by Perpetua Resources Corp. (“Perpetua Resources”), who have consolidated 107 km 2 of unpatented and patented claims. Franco-Nevada holds a 1.7% NSR on gold production and, pursuant to a subsequent transaction that closed in March 2024, will receive all the expected payable silver by-product revenue over the life of mine. In March 2026, Perpetua Resources released an updated technical report on the Stibnite project. The project is expected to have a 15-year mine life with average annual gold production of 296 koz per year. The first four years have an average annual gold production of 463 koz per year. Stibnite has Mineral Reserves of 4.8 Moz of gold and 6.4 Moz of silver (105 Mt at 1.43 g/t gold and 1.91 g/t silver). M&I Mineral Resources are 6.3 Moz of gold and 9.4 Moz of silver (148 Mt at 1.33 g/t gold and 1.97 g/t silver). Inf. Mineral Resources are 1.6 Moz of gold and 2.3 Moz of silver (52 Mt at 0.96 g/t gold and 1.40 g/t silver). There is potential to significantly increase Mineral Resources and Mineral Reserves at the project with advancement of high potential exploration targets. The United States Forest Service (“USFS”) issued the Final Record of Decision (“ROD”) authorizing the project in January 2025 and the final federal permits were issued in May 2025. Since receiving the federal permits, Perpetua has completed $527 million of equity financing, announced a $317 million strategic equity investment and private placement with Agnico Eagle and JPMorganChase, as well as advanced an application with the Export-Import Bank of the United States (“U.S. EXIM”) for a loan of up to $2.7 billion. Early works construction was announced in October 2025, and Perpetua expects to close the U.S. EXIM loan in 2026 which will allow for a final investment decision. Commercial operations are expected in 2029. Royalty Property Prospects Mineral Deposits Patented Claims under option Utah Nevada California Stibnite Gold Project Boise Cascade McCall Coeur d'Alene Salt Yellow Pine Deposit West End Deposit Hangar Flats Deposit Historic Tailings Blow-out Mule Rabbit Scout Garnet Ridgetop Cinnamid Saddle Fern Upper Midnight Stibnite Gold 1.7% NSR Au 100% NSR Ag mile 0 1 N C O P P E R W O R L D P R O J E C T Advanced Location: Arizona, United States | Operator: Hudbay Minerals Inc. | Metals: Cu, Mo, Ag & Au | Royalty: NSR: 2.085% Franco-Nevada has a 2.085% NSR royalty covering all metals, including copper, molybdenum, silver and gold extracted from the majority of claims covering the Copper World and East (formerly known as Rosemont) deposits in Pima County, approximately 30 miles southeast of Tucson, Arizona. 2025 2024 2023 Revenue to Franco-Nevada ($ million) $ − $ – $ – M&I Resource (Mlbs Cu) 1,3 11,097 11,100 11,157 Inf. Resource (Mlbs Cu) 1,3 1,940 1,957 1,940 P&P Reserves (Mlbs Cu) 1,3 4,585 4,585 4,583 M&I Royalty Ounces (000s) 1,2,3 246 305 380 Inf. Royalty Ounces (000s) 2,3 44 55 66 P&P Royalty Ounces (000s) 2,3 99 123 156 1 Please refer to the tables on pages 126–134 for a breakout of grade and tonnages by Mineral Resource category; all M&I categories are inclusive of Mineral Reserves 2 For Royalty Ounce calculation, Franco-Nevada estimates 100% (100% in 2024, 100% in 2023) of the Mineral Resources and Mineral Reserves are subject to our royalty interest and estimates a rate of 1.772% (which factors a NSR smelting charge of 15%) for floatation material and a rate of 2.085% for leach material. Copper has been converted to Royalty Ounces assuming $5.50/lb ($4.25/lb in 2024, $3.75/lb in 2023) 3 Does not include silver or molybdenum Mineral Resource and Mineral Reserve estimates Hudbay Minerals Inc. (“Hudbay”) is the operator of the asset following its acquisition of Augusta Resource Corporation in 2014. The Copper World Project includes seven new deposits discovered in 2021 (then referred to as the “Copper World deposits”), together with the East deposit (formerly known as the “Rosemont deposit”). The property is situated near a number of large producing copper mines. In November 2021, Franco-Nevada acquired an incremental 0.585% NSR royalty interest on the Copper World Project from certain private sellers. The royalty has identical terms as an existing 1.5% NSR royalty that Franco-Nevada held and covers the same land package, including the Copper World deposits. Hudbay is focused on advancing the Copper World Project which is on private land and has obtained all required permits. In September 2023, Hudbay released an enhanced pre-feasibility study for the Copper World Complex. The pre-feasibility study announced a Mineral Reserve of 385 million ore tonnes at 0.54% copper and a Mineral Resource of 1,205 million ore tonnes at 0.42% copper. The pre-feasibility study also announced Inf. Mineral Resources of 275 million ore tonnes at 0.32% copper. The pre-feasibility study reflects a two-phase mine plan with the first phase reflecting a standalone operation with processing infrastructure on Hudbay’s private land and mining occurring on portions of the deposits located on patented mining claims. The Copper World Project anticipates producing an average of approximately 85 kt of copper per year for 20 years. The second phase expands mining activities onto federal land and extends the mine life well beyond 20 years. Hudbay announced a $600 million strategic investment from Mitsubishi Corporation in August 2025 for a 30% minority JV interest in Copper World. A detailed engineering and feasibility study are underway with results expected to be released mid-2026 and a construction sanctioning decision expected in 2026, which would allow for first production in 2029. Franco-Nevada has certain contingent payments to previous holders of the Copper World royalties, part of which are expected to be due after the release of the feasibility study in 2026. Hudbay announced the acquisition of Arizona Sonoran in March 2026 further strengthening their operating position in Arizona. The acquired Cactus project is expected to be sequenced after the construction of Copper World. Copper World Project 2.085% NSR 2.085% NSR kilometer 2 0 N Patented Royalty Licences Mineral Resources Unpatented Royalty Licences Excluded from Royalty Peach North Limb Elgin South Limb Broad Top Butte Bolsa Copper World East Deposit 2017 Reserve Pit 83 Copper World Project Pacific Ocean Oregon Idaho Utah Nevada California Arizona Mexico One of the largest and highest grade undeveloped open pit gold deposits in the U.S. The Stibnite project would be the only domestic source of antimony mined in the U.S. $2.7B indicative U.S. EXIM financing The operator currently has a 15-year mine plan. M&I Resources could support production for 21 years and Inf. Resources for a further 5 years Franco-Nevada’s royalty covers all metals, including copper, molybdenum, silver and gold $600M strategic investment from Mitsubishi Corporation highlights quality of Copper World asset The operator currently has a 20-year mine plan. M&I Resources could support production for 61 years, with Inf. Resources for a further 14 years TSX / NYSE: FNV Franco-Nevada Corporation ★ 87 86 ★ Franco-Nevada Corporation TSX / NYSE: FNV United States United States
C O P P E R C R E E K Advanced Location: Arizona, United States | Operator: Faraday Copper Corp. | Metals: Cu, Mo & Ag | Royalty: NSR: 1% and Production Decision Royalty Payments Copper Creek is a 3-km-long porphyry copper deposit located in Pinal County, less than two hours northeast of Tucson, Arizona. A 2023 Preliminary Economic Assessment (“PEA”) reported 4.2 billion pounds of copper in M&I Mineral Resources. The PEA has a 32-year mine life with average production of 51,100 payable copper equivalent tonnes per year during active mining. Capital investment is estimated at $798 million with a two-year construction period. The Globe and Copper Prince open pit deposits, covered by Franco-Nevada’s royalty, are currently scheduled to be mined within the first three years of operations. Faraday Copper Corp. (“Faraday”) is currently performing baseline environmental monitoring and data collection to support the permitting process. A 1% NSR is payable to Franco-Nevada on all production from certain areas within Faraday’s control. Franco-Nevada’s royalty covers approximately 70% of the Globe and 50% of the Copper Prince open pit resources as reported in the PEA released in 2023. Payment of $3,000,000 ($500,000 per year over 6 years) is due to Franco-Nevada following achievement of commercial production of minerals within a 5-mile radius of certain patented claims now held by Faraday. The Copper Creek mineral resource area is within this 5-mile radius and would therefore be expected to trigger such payments upon production. The Globe resource contains 9.88 Mt of sulphide/transitional ore at 0.40% copper and 2.71 Mt of oxide ore at 0.37% copper. The Copper Prince resource contains 20.72 Mt of sulphide/transitional ore at 0.45% copper and 5.89 Mt of oxide ore at 0.36% copper. Franco-Nevada estimates that resources containing 203 Mlbs of copper (22.1 Mt at 0.33% copper) fall on royalty ground. In 2026, Faraday plans on completing the 40,000 meter Phase IV exploration drill program focused on resource expansion and testing new targets, metallurgical programs to support coarser grind and tailings optimization and a gold assay program to support the inclusion of gold in the updated technical report expected after the Phase IV program is complete. In February 2026, Faraday announced the signing of a letter of intent to acquire BHP’s San Manuel property in Arizona, creating a multi-asset copper district. The acquisition accelerates the pathway to production for Copper Creek as the private land position of San Manuel has the potential for expedited production from the combined projects. For Royalty Ounce calculation, Franco-Nevada estimates 18% of the Mineral Resources and Mineral Reserves are subject to our royalty interest and estimates a rate of 1.275% is applicable for the copper Royalty Ounces (which factors in a NSR smelting charge of 15%). Copper has been converted to Royalty Ounces assuming $5.50/lb A R T H U R G O L D Advanced Location: Nevada, United States | Operator: AngloGold Ashanti plc | Precious Metals: Au | Royalty: NSR: 1% The Arthur Gold Project, located in the Beatty Mining District of southern Nevada, consists of the Silicon and Merlin deposits and represents an emerging tier - one gold asset in a stable and supportive mining jurisdiction. 2025 2024 2023 Revenue to Franco-Nevada ($ million) $ – $ – $ – M&I Resources (koz Au) 1 9,350 – – Inf. Resources (koz Au) 1 6,340 – – P&P Reserves (koz Au) 1 4,940 – – M&I Royalty Ounces (000s) 1,2 97 – – Inf. Royalty Ounces (000s) 2 65 – – P&P Royalty Ounces (000s) 2 50 – – 1 Please refer to the tables on pages 126–134 for a breakout of grade and tonnages by Mineral Resource category; all M&I categories are inclusive of Mineral Reserves 2 For Royalty Ounce calculation, Franco-Nevada estimates 99% of Mineral Resources and Mineral Reserves are subject to our royalty interest and estimates an average rate of 1.0% is applicable. Silver has been converted assuming $4,500/oz gold and $75.00/oz silver The Arthur Gold Project comprises the Silicon and Merlin deposits and was formerly known as the Expanded Silicon Project. Following the successful completion of a concept study in 2023, the project advanced to a pre-feasibility study centred on the Merlin deposit. This work, supported by extensive drilling and optimisation studies, resulted in a first-time Probable Mineral Reserve of 4.9 Moz of gold (88 Mt at 1.75 g/t) and 7.8 Moz of silver (88 Mt at 2.76 g/t) as at December 31, 2025. In addition to the reported Mineral Reserves, the Arthur Gold project has M&I Resources of 4.4 Moz of gold (164.1 Mt at 0.84 g/t) and 17.6 Moz of silver (164.1 Mt at 3.33 g/t) as well as Inf. Mineral Resources of 6.3 Moz of gold (219.8 Mt at 0.90 g/t) and 16.0 Moz of silver (219.8 Mt at 2.26 g/t). The pre-feasibility study supports an initial 9-year mine life with average annual gold production of ~500 koz, with production front-loaded of approximately 800 koz per year. The project is predominantly oxide mineralisation (>95%) and envisions conventional processing flowsheets. Development plans include an integrated operation featuring a 7 Mtpa milling facility, a 5.5 Mtpa crushed heap - leach circuit, and open - pit mining using electric rope shovels and ultra - class haul trucks. To ensure environmental stewardship, the Arthur Gold Project plans to use filtered, dry-stacked tailings for enhanced water conservation. AngloGold Ashanti plc (“AngloGold Ashanti”) is forecasting $111 million of capital expenditures on the definitive feasibility study in 2026. A total of 104 kms were drilled during 2025 and drilling programs remain underway with the aim to convert additional mineral resource, expand the mineralized footprint and support additional technical studies. The pre-feasibility study is expected to be presented to the AngloGold Ashanti Board of Directors for approval to transition to the feasibility study phase in June 2026. S T E R L I N G Advanced Location: Nevada, United States | Operator: AngloGold Ashanti plc | Precious Metals: Au | Royalty: NSR: 0.25% Sterling is a historic gold operation located 185 km northwest of Las Vegas, Nevada near Beatty, Nevada. In 2022, AngloGold Ashanti acquired 100% of Coeur’s wholly owned subsidiary, Coeur Sterling, Inc., which owned the Sterling property. Franco-Nevada holds ⅛ th of a 2% NSR, or an effective 0.25% NSR royalty, on approximately 272 lode mining claims with a small minimum advance royalty. Sterling underground mining operations were terminated at the end of May 2015. The acquisition consolidates AngloGold Ashanti’s ownership position in the Beatty District allowing for optimal development of the assets centered on developing the North Bullfrog and Arthur Gold Projects. As of December 31, 2024, AngloGold Ashanti reported a mineral resource including 0.91 Moz (33.4 Mt at 0.85 g/t) at Sterling. AngloGold Ashanti now reports Sterling as part of its Nevada Regional Deposits. Franco-Nevada has not included Sterling in Royalty Ounce estimates Arthur Gold Oregon Idaho Utah Nevada California Arizona Mexico Pacific Ocean Arthur Gold 1% NSR 5 0 kilometers N Royalty Lands Resource Footprint Silicon Merlin Motherlode SNA Secret Pass Daisy West Daisy South Sterling Highway 95 Highway 95 Gold Center Beatty One of the largest ever greenfield discoveries in the U.S. with significant resource expansion potential Likely developed by AngloGold Ashanti into a tier-one gold asset in a stable and supportive jurisdiction The operator currently has a 9-year mine plan. M&I Resources could support production for 19 years and Inf. Resources for a further 13 years TSX / NYSE: FNV Franco-Nevada Corporation ★ 89 88 ★ Franco-Nevada Corporation TSX / NYSE: FNV United States United States
Rest of World Subika (Ahafo) Tasiast Sabodala Edikan Perama Hill Kiziltepe Sissingué Pandora Séguéla Tasiast Sabodala Séguéla Producing Advanced Producing (Energy) Guadalupe-Palmarejo Duketon Yandal (Bronzewing) Australia Wiluna South Kalgoorlie Rogozna Milpillas Producing Advanced Exploration Producing Advanced Exploration Mining Assets Precious Metals Diversified Mt Keith Rebecca Western Limb Bullabulling Aphrodite Agate Creek S O U T H R A I L R O A D Exploration Location: Nevada, United States | Operator: Orla Mining Ltd. | Precious Metals: Au | Royalty: NSR: 1% The South Carlin Complex is located in the Bullion mining district of the southern Carlin trend in Elko County, Nevada. The South Carlin Complex has been actively explored since 1969 by several operators. Orla acquired the northern and southern portions of the South Carlin Complex through the acquisitions of Gold Standard Ventures in 2022 and Contact Gold in 2024. The South Carlin Complex contains the Dark Star and Pinion deposits which Orla is progressing through permitting. Orla expects to receive all permits by mid 2026 with first production in Q4 2027. Franco-Nevada’s royalty does not cover these deposits. Franco-Nevada’s royalty covers portions of the northern exploration area including the POD/Sweet Hollow deposit and newly discovered Spike oxide deposit. In December 2025, Orla announced that the Spike target had oxide gold confirmed over a 1.5 km strike length. Drill results released included 38.1 metres at 0.80 g/t gold and 21.3 meters at 0.76 g/t gold. Franco-Nevada has not included South Railroad in Royalty Ounce estimates M I D A S - H O L L I S T E R - F I R E C R E E K Exploration Location: Nevada, United States | Operator: Hecla Mining Company | Precious Metals: Au | Royalty: Midas/Fire Creek NSR – 2.5%, Hollister NSR – 3–5% High-grade projects offering near-term production potential and district-scale discovery opportunities. Hecla acquired the Midas, Hollister and Fire Creek properties from Klondex Mines in 2018. Midas and Hollister were put on care and maintenance in 2019 and Fire Creek later followed in 2021. The Midas property has a permitted ~1,200 tons/day mill, tailings facility, utilities and surface infrastructure. 2025 Midas exploration drilling at the Pogo & Sinter targets resulted in high-grade gold intersections, including 0.95 oz/ton over 2.2 feet and 0.46 oz/ton over 6.1 feet. Hecla has discussed plans to use the Midas Mill as a central processing facility and announced a 2026 exploration budget of $16 million in Nevada focused on identifying high-grade structures to justify a restart of production by 2031. Potential targets to feed the mill on which Franco-Nevada has royalties include: • SE Midas Area: High-grade gold discovery at the “Pogo Trend” (returning 6.42 oz/ton gold) and the Sinter Vein, located 1.5 miles southeast of the original Midas mine. • Hollister Mine: Located within hauling distance of the Midas mill, offering additional high-grade ore potential. For Royalty Ounce calculation, Franco-Nevada estimates 100% of Mineral Resources and Mineral Reserves are subject to our royalty interest and estimates an average rate of 2.5% is applicable for Fire Creek and Midas and 3.0% is applicable for Hollister. Silver has been converted assuming $4,500/oz gold and $75.00/oz silver S L E E P E R Exploration Location: Nevada, United States | Operator: Paramount Gold Nevada Corp. | Precious Metals: Au | Royalty: NSR: 2% Former high-grade producer of 1.7M ounces at average head grade of ~7 g/t gold from 1986-1996, located 25 miles northwest of Winnemucca, Nevada. The Sleeper mine is a past producing gold mine with a large M&I resource of 1.9 Moz (163 Mt at 0.361 g/t gold and 4.05 g/t silver) and 1.2 Moz Inf. Mineral Resources (120 Mt at 0.315 g/t gold and 2.45 g/t silver). Paramount released an updated SK-1300 Technical Report in September 2023 showing that the deposit has the potential to be mined by open pit methods with heap leach and bio-oxidation as the primary processing scenario. In April 2026, Paramount commenced an Initial Assessment of Sleeper. The Initial Assessment is intended to examine a potentially lower-cost, staged development approach focused on heap-leachable material only, including approximately 54 million tons of material of economic interest. In parallel, Paramount plans to initiate permitting for infill drilling targeting surface material at Sleeper, which could support future resource updates and contribute to subsequent pre-feasibility or feasibility studies. Permitting is expected to be straightforward and timely, as the proposed activities fall within the scope of the existing Plan of Operations. Completion of the Initial Assessment is expected in late Q2 2026. For Royalty Ounce calculation, Franco-Nevada estimates 100% of Mineral Resources and Mineral Reserves are subject to our royalty interest and estimates an average rate of 2.0% is applicable. Silver has been converted assuming $4,500/oz gold and $75.00/oz silver Franco-Nevada Corporation ★ 91 TSX / NYSE: FNV TSX / NYSE: FNV 90 ★ Franco-Nevada Corporation United States
G U A D A L U P E - P A L M A R E J O Producing Location: Mexico | Operator: Coeur Mining, Inc. | Precious Metals: Au | Stream: 50% Gold Since January 2009, Franco-Nevada has received 50% of the gold produced from the Palmarejo complex located in Chihuahua Province, Mexico which is owned and operated by Coeur Mining, Inc. (“Coeur”). 2025 2024 2023 Revenue to Franco-Nevada ($ million) $ 177.3 $ 84.8 $ 66.8 M&I Resources (koz Au) 1 1,956 2,104 2,090 Inf. Resources (koz Au) 1 1,265 643 381 P&P Reserves (koz Au) 1 928 681 769 M&I Royalty Ounces (000s) 1,2 695 693 556 Inf. Royalty Ounces (000s) 2 245 184 110 P&P Royalty Ounces (000s) 2 373 236 209 1 Please refer to the tables on pages 126–134 for a breakout of grade and tonnages by Mineral Resource category; all M&I categories are inclusive of Mineral Reserves 2 For Royalty Ounce calculation, Franco-Nevada estimates 98% of the Mineral Reserves (97% in 2024, 92% in 2023), 76% of the exclusive M&I Mineral Resource (90% in 2024, 89% in 2023) and 47% of the Inf. Mineral Resource (80% in 2023, 98% in 2023) are subject to our 50% stream interest. The stream interest has been factored by 82% to reflect $4,500/oz gold ($2,800/oz gold in 2024, $1,950/oz gold in 2023) and $800/oz ongoing payments (71% in 2024, 59% in 2023) The Palmarejo complex, which includes mining of the Palmarejo, Guadalupe and Independencia ore bodies, principally produces silver with a considerable gold by-product. It started in 2009 as an open pit and underground mine and is now only an underground operation. Starting in 2009, a Mexican subsidiary of Franco-Nevada received 50% of the gold produced from Palmarejo in return for a $75 million investment. The original contract was terminated in 2014 and Coeur fulfilled its obligation under that agreement in the third quarter of 2016, once they delivered the minimum ounce obligation of 400 koz of gold. In June 2014, FNIC, a subsidiary of Franco-Nevada, entered into a new 50% gold stream with Coeur on the Palmarejo complex with ongoing payments equal to the lesser of $800/oz (no inflation provision) and the then prevailing spot price for gold for each ounce delivered under the new gold stream agreement. The new agreement improved mine economics for Coeur and helped extend the mine life of the entire Palmarejo complex. The agreement applies to a land position totaling over 1,200 km 2 although it does not cover the adjacent concessions that Coeur acquired through the acquisition of Paramount Gold and Silver Corp. In 2014. Franco-Nevada provided an upfront $22 million deposit which was used to partially fund the development of the Guadalupe underground mine on the Palmarejo property. Mineral Reserves and Mineral Resources grew significantly in 2025 net of depletion and extended the mine life to approximately 11 years. Exploration success at Palmarejo in 2025, increased year-over-year silver and gold Mineral Reserves by 40% and 36%, respectively. Franco-Nevada estimates that over 87% of the existing Mineral Resources and Mineral Reserves are covered by the stream agreement. Franco-Nevada sold 50,609 oz of gold from the mine in 2025, compared to 35,678 oz of gold in 2024. Palmarejo has a mill throughput capacity of 7 ktpd and in 2025, along with its principal silver production, produced 100,768 oz of gold. Coeur’s 2026 gold production guidance for Palmarejo is between 95–105 koz. In 2026, Franco-Nevada expects sales from the Guadalupe-Palmarejo stream to be between 47,500– 52,500 GEOs. Palmarejo Agua Salada Mill Guadalupe Mine Complex La Nación La Bavisa Zapata La Patria Independencia Mine Complex Independencia West Pacific Ocean NM TX CA AZ MEXICO Guadalupe-Palmarejo Gold Stream Perimeter of gold stream property Excluded from Stream Deposits Guadalupe- Palmarejo kilometer 4 0 N Independencia East W E S T E R N L I M B Producing Location: South Africa | Operator: Sibanye Stillwater Limited | Precious Metals: Au & Pt | Stream: Gold and Platinum Stream / Royalty: NSR 1% (Pandora) In December 2024, FNIC announced a $500 million precious metals stream on specified production from Sibanye-Stillwater Western Limb PGM Mining Operations in South Africa (the “Western Limb”). 2025 2024 2023 Revenue to Franco-Nevada ($ million) $ 70.3 $ − $ − M&I Resources (koz PGM) 4 179,400 182,600 − Inf. Resources (koz PGM) 4 39,000 39,000 − P&P Reserves (koz PGM) 4 35,900 34,000 − Stream M&I Royalty Ounces (000s) 4,5 1,059 1,055 − Stream Inf. Royalty Ounces (000s) 5 190 190 − Stream P&P Royalty Ounces (000s) 5 349 320 − NSR M&I Royalty Ounces (000s) 4,6 113 101 − NSR Inf. Royalty Ounces (000s) 6 10 9 − NSR P&P Royalty Ounces (000s) 6 3 3 − 1 Based on 2023 production per Sibanye-Stillwater’s public disclosure and total 2023 supply per Johnson Matthey PGM market report (May 2024) 2 Assuming current projections of 4E PGM production based on Reserves and Replacement Projects at consensus commodity prices at the time of announcement 3 The ongoing payments are subject to reduction in certain circumstances 4 Please refer to the tables on pages 126–134 for a breakout of grade and tonnages by Mineral Resource category; all M&I categories are inclusive of Mineral Reserves 5 For Royalty Ounce calculation for the stream, Franco-Nevada estimates P&P Royalty Ounces include payable metal of the remaining deliveries before 237,000 of gold and 294,000 of platinum, with the balance of Mineral Reserves subject to an 80% gold stream. For M&I Royalty Ounces, Franco- Nevada assumes the P&P Royalty Ounces with the balance of M&I Resources subject to the 80% gold stream. For Inf. Royalty Ounces, Franco-Nevada assumes Inf. Mineral Resources are subject to the 80% gold stream. Platinum ounces have been converted into Royalty Ounces assuming $4,500/oz Au and $2,000/ounce Pt ($2,800/oz Au and $950/ounce Pt in 2024) and Franco- Nevada estimates 95% of the Mineral Reserves, 97% of the M&I Mineral Resources and 99% of the Inf. Mineral Resources are subject to our stream interest. Gold and platinum ounces delivered will be subject to an ongoing payment of 5% of spot prices, respectively to Sibanye-Stillwater. In the case of gold, the ongoing payment will increase to 10% following the delivery of 237 koz of gold 6 For Royalty Ounce calculation for the 1% NSR on Pandora, Franco-Nevada estimates a rate of 1.0% is applicable to Mineral Resources and Mineral Reserves that are subject to the Pandora royalty ground. PGM ounces have been converted into Royalty Ounces assuming ($4,500/oz Au, $2,000/ounce Pt, $1,650/ounce Pd and $7,735/ounce Rh ($2,800/oz Au, $950/ounce Pt, $950/ounce Pd and $5,000/ounce Rh in 2024) Sibanye-Stillwater’s South African PGM mining operations are located in the Western Limb of the Bushveld Complex and are an essential source of PGMs, providing approximately 15% of global platinum supply¹. The operations produced approximately 1.6 Moz 4E PGMs in 2025, consistent with 2024. The operations benefit from extensive existing infrastructure consolidated through the merger of three prior operators, which has unlocked numerous synergies and consist of the Marikana, Rustenburg, and Kroondal operations and a total of 13 underground mines. The integrated operations include concentrators, a smelter and refining complex. Under the stream agreement, gold deliveries are initially referenced to aggregate platinum, palladium, rhodium and gold (“4E PGM”) ounces contained in concentrate. Franco-Nevada receives gold ounces equal to 1.1% of physical 4E PGM ounces contained in concentrate until delivery of 87,500 oz of gold, then 0.75% of 4E PGM ounces contained in concentrate until total delivery of 237 koz of gold, which is currently expected to occur in approximately 25 years. Thereafter, Franco-Nevada will receive 80% of gold contained in concentrate for the remaining LOM. Franco-Nevada receives platinum deliveries equal to 1.0% of platinum contained in concentrate until the delivery of 48 koz of platinum, then increase to 2.1% of platinum contained in concentrate until total delivery of 294 koz of platinum, after which there will be no further platinum deliveries. The stream GEO profile is comprised of approximately 70% gold and 30% platinum deliveries 2 at consensus commodity prices as of the date of transaction. Gold and platinum ounces delivered are subject to an ongoing payment of 5% of spot prices to Sibanye-Stillwater. In the case of gold, the ongoing payment will increase to 10% following completion of the 4E PGM link (after the delivery of 237 koz of gold to Franco-Nevada)³. The stream is referenced to production from an area which extends over 500 km 2 and has a mine life up to 2070 based on board approved ore Reserves and certain pre-feasibility and feasibility stage mechanized UG2 replacement projects being studied, which leverage existing infrastructure. The Siphumelele mechanised UG2 project was recently included in Mineral Reserves demonstrating the value being unlocked by these projects. In addition, the K4 shaft at Marikana is also successfully ramping up production (41% increase year-over-year) to 99,605 4E PGM ounces in 2025, moving Marikana down the cost curve. The stream transaction was closed on February 28, 2025, with an effective date of September 1, 2024. Franco-Nevada expects deliveries of gold and platinum ounces in 2026 from the Western Limb operations to be relatively consistent with 2025, where we received 16,933 oz of gold and 9,185 oz of platinum. Benefits from integrated and established infrastructure, including smelting Operations benefit from a unique and diversified basket of metals, supporting margins Large land package covering over 500 km² with Reserves representing only a small portion of the known 4E PGM Resources The operator currently has a 45-year mine plan. Extensive M&I resource to support potential mine life extensions Rustenburg N4 Rustenburg Kroondal Khuseleka Kwezl Thembelani Bathopele UG2 outcrop Merensky outcrop Kopaneng Siphumelele Bathopele OP Project Newman Project Kwezi Shallows Project Thembelani Deeps Project Siphumelele Project Markina Project Khuseleka Project Turk Project 4B Project Rowland Project Pandora Deeps Project K4 K3 K4 EPC EPL Base Metals Refinery Karee WLTR Marikana K1 K2 Retrofit Waterval Rowland W1 1E Lift 4B Newman Saffy E1 E2 E3 E4 Project Saffy Deeps Project Kroondal Deeps Project E3 Ext Simunye Bambanani K6 Marikana Schaapkraal Hoedspruit Pandora 1% NSR Western Limb Gold and Platinum Stream N kilometer 10 0 Project Area Refinery Concentrator Operational Shaft Prospecting license Mining license Area of Interest Rustenburg N4 Rustenburg Kroondal Khuseleka Kwezl Thembelani Bathopele UG2 outcrop Merensky outcrop Kopaneng Siphumelele Bathopele OP Project Newman Project Kwezi Shallows Project Thembelani Deeps Project Siphumelele Project Markina Project Khuseleka Project Turk Project 4B Project Rowland Project Pandora Deeps Project K4 K3 K4 EPC EPL Base Metals Refinery Karee WLTR Marikana K1 K2 Retrofit Waterval Rowland W1 1E Lift 4B Newman Saffy E1 E2 E3 E4 Project Saffy Deeps Project Kroondal Deeps Project E3 Ext Simunye Bambanani K6 Marikana Schaapkraal Hoedspruit Pandora 1% NSR Western Limb Gold and Platinum Stream N kilometer 10 0 Project Area Refinery Concentrator Operational Shaft Prospecting license Mining license Rustenburg N4 Rustenburg Kroondal Khuseleka Kwezl Thembelani Bathopele UG2 outcrop Merensky outcrop Kopaneng Siphumelele Bathopele OP Project Newman Project Kwezi Shallows Project Thembelani Deeps Project Siphumelele Project Markina Project Khuseleka Project Turk Project 4B Project Rowland Project Pandora Deeps Project K4 K3 K4 EPC EPL Base Metals Refinery Karee WLTR Marikana K1 K2 Retrofit Waterval Rowland W1 1E Lift 4B Newman Saffy E1 E2 E3 E4 Project Saffy Deeps Project Kroondal Deeps Project E3 Ext Simunye Bambanani K6 Marikana Schaapkraal Hoedspruit Pandora 1% NSR Western Limb Gold and Platinum Stream N kilometer 10 0 Project Area Refinery Concentrator Operational Shaft Prospecting license Mining license Area of Interest Over 95% of reserves on stream ground Mineral Resources and Mineral Reserves replenished depleted ore Stream has significant leverage to the gold price The operator currently has a 11-year mine plan. M&I Resources could support production for 16 years and Inf. Resources for a further 6 years TSX / NYSE: FNV Franco-Nevada Corporation ★ 93 92 ★ Franco-Nevada Corporation TSX / NYSE: FNV Rest of World Rest of World
T A S I A S T Producing Location: Mauritania | Operator: Kinross Gold Corporation | Precious Metals: Au | Royalty: NSR: 2% Franco-Nevada has a 2% NSR royalty on the Tasiast mine operated by Kinross. 2025 2024 2023 Revenue to Franco-Nevada ($ million) $ 32.8 $ 30.5 $ 24.5 M&I Resources (koz Au) 1 6,797 7,070 6,985 Inf. Resources (koz Au) 1 2,377 1,632 1,504 P&P Reserves (koz Au) 1 4,401 4,705 5,055 M&I Royalty Ounces (000s) 1,2 136 141 140 Inf. Royalty Ounces (000s) 2 48 33 30 P&P Royalty Ounces (000s) 2 88 94 101 1 Please refer to the tables on pages 126–134 for a breakout of grade and tonnages by Mineral Resource category; all M&I categories are inclusive of Mineral Reserves 2 For Royalty Ounce calculation, Franco-Nevada estimates 100% of the Mineral Resources and Mineral Reserves are subject to our royalty interest and estimates a rate of 2.0% is applicable Kinross acquired Tasiast in September 2010 through its acquisition of Red Back Mining Inc. The royalty originally covered three large permit areas in Mauritania, West Africa and covers the Tasiast main trend, including the Fennec satellite pit, and Tasiast Sud. In 2025, Tasiast produced 503,429 oz of gold, down from 622,394 oz in 2024, due to planned lower grades and mine sequencing. Kinross expects 2026 production to be approximately 505,000 oz of gold and estimates 2027 production will remain around the 500,000 ounce level based on ongoing mine plan optimizations. Production from 2025 through 2027 is lower than 2024 primarily due to the stripping phase of West Branch 5. The current mine plan sees Tasiast running until 2035, which will include the processing of low-grade stockpiles on the back end of the mine life. Kinross is actively evaluating several technical and strategic pathways to extend the Tasiast mine life beyond 2035, with a primary focus on underground mining at the West Branch orebody and future open pit pushbacks at both West Branch and the Piment zones. Potential new growth projects targeting the post-2030 period include a West Branch 6 layback, regional satellite open pits, and bulk-tonnage underground mining. Exploration continues to demonstrate significant long-term potential for underground extensions and satellite deposits, with Kinross advancing technical studies across multiple targets. In 2025, approximately 44,000 metres of drilling were completed, primarily targeting depth extensions of the West Branch orebody, where recent results have extended mineralization to at least 1.8 kms along strike and down plunge. At the Fennec satellite deposit on the TMLSA license, drilling in 2024 and 2025 continued to add reserves and improve geological definition. Additional exploration remains ongoing on the SENISA licenses, where 51,135 metres were drilled through year end 2024. Franco-Nevada’s royalty covers both the TMLSA and SENISA license areas. Tasiast, Mauritania Tasiast Mauritania Mali Senegal Algeria Atlantic Ocean N kilometer 10 0 Tasiast NSR: 2% Tasiast Main Trend Plant Site Tasiast Sud 2% NSR Tasiast Mining License Tasiast License Area, March 2012 Tasiast Sud Gold Prospects Resource/Reserve Target Trends FNV Royalties Bulk-tonnage underground and open pit satellite potential to extend mine life Prospective 75 km long greenstone belt The operator currently has a 10-year mine plan. M&I Resources could support production for 13 years and Inf. Resources for a further 5 years S U B I K A ( A H A F O ) Producing Location: Ghana | Operator: Newmont Corporation | Precious Metals: Au | Royalty: NSR: 2% Franco-Nevada has a 2% NSR royalty which covers a 78 km 2 area on the southern portion of Newmont’s Ahafo South mine in Ghana (shown in the schematic). Ahafo South is a separate mine from Newmont’s Ahafo North mine which is located 30 km to the north. 2025 2024 2023 Revenue to Franco-Nevada ($ million) $ 45.4 $ 34.7 $ 19.4 M&I Resources (koz Au) 1 9,500 8,400 8,600 Inf. Resources (koz Au) 1 2,000 1,300 1,600 P&P Reserves (koz Au) 1 4,100 4,600 5,100 M&I Royalty Ounces (000s) 1,2 58 61 66 Inf. Royalty Ounces (000s) 2 12 9 12 P&P Royalty Ounces (000s) 2 39 51 63 1 Please refer to the tables on pages 126–134 for a breakout of grade and tonnages by Mineral Resource category; all M&I categories are inclusive of Mineral Reserves 2 For Royalty Ounce calculation, Franco-Nevada estimates 48% of Mineral Reserves (55% in 2024, 62% in 2023), 31% of the M&I Mineral Resources (36% in 2024, 38% in 2023) and 31% of the Inf. Resources (36% in 2024, 38% in 2023) are subject to our royalty interest and estimates an average rate of 2.0% is applicable The 2% NSR is payable on all ounces produced from the Rank (formerly Ntotoroso) concession. The majority of the Subika deposit, the northern portion of the Awonsu deposit, and the southern tip of the Amoma deposit fall within the Rank mining lease boundary. It is estimated that 48% of project reserves as of December 31, 2025, fall on Franco-Nevada’s royalty ground. In 2025, Ahafo South produced 664 koz of gold compared with 798 koz in 2024. Ahafo production in 2026 is expected to be 440 koz of gold, decreasing relative to 2025 as mining activities in the Subika open pit were completed as planned in Q3 2025. Newmont continues to increase its investment in exploration and advanced projects, including at the Subika underground. Exploration beneath the Subika open pit (majority on royalty ground) and Apensu open pit (not on royalty ground) continues to highlight the potential for the next phase of high grade underground growth at Ahafo South. This is expected to meaningfully extend the life of the Subika underground mine (majority on royalty ground), with additional upside from deeper and lateral extensions utilizing existing surface infrastructure and processing capacity. Subika, Ghana Subika (Ahafo) NSR: 2% N Note: not to scale Mina Justa Atlantic Ocean Burkina Faso Cote D’ivoire Togo Benin Nigeria Niger Mali Algeria Subika Ghana 2% NSR Awonsu Apensu Subika Plant and Offices Ntotoroso Amoma Kenyase FNV Royalties Deposits Estimate 48% of Ahafo South reserves fall on royalty ground Exploration success expected to extend the life of the Subika UG mine The operator currently has a 8-year mine plan. M&I Resources could support production for 22 years and Inf. Resources for a further 5 years TSX / NYSE: FNV Franco-Nevada Corporation ★ 95 94 ★ Franco-Nevada Corporation TSX / NYSE: FNV Rest of World Rest of World
S A B O D A L A Producing Location: Senegal | Operator: Endeavour Mining Corporation | Precious Metals: Au | Stream: Fixed gold deliveries / 6% Gold Stream In December 2013, FNIC, provided Teranga Gold Corporation (“Teranga”) with a $135 million deposit to fund the acquisition by Teranga of additional future ore sources for its Sabodala mill. 2025 2024 2023 Revenue to Franco-Nevada ($ million) $ 32.6 $ 22.6 $ 18.3 M&I Resources (koz Au) 1 5,190 5,186 6,333 Inf. Resources (koz Au) 1 1,766 1,322 1,380 P&P Reserves (koz Au) 1 2,768 3,260 4,086 M&I Royalty Ounces (000s) 1,2 99 95 111 Inf. Royalty Ounces (000s) 2 47 35 31 P&P Royalty Ounces (000s) 2 44 52 60 1 Please refer to the tables on pages 126–134 for a breakout of grade and tonnages by Mineral Resource category; all M&I categories are inclusive of Mineral Reserves 2 For Royalty Ounce calculation, Franco-Nevada accounts for the balance of the Fixed Delivery Period of 105,750 ounces. In 2025, Franco-Nevada estimates 45% of the remaining Mineral Reserves (45% in 2024, 47% in 2023), 46.5% of the remaining M&I Mineral Resources (46.5% in 2024, 47% in 2023) and 55.5% of the remaining Inf. Mineral Resources (55.5% in 2024, 47% in 2023) at the Sabodala-Massawa Complex are subject to a rate of 4.8% (6.0% gold stream which is factored by 80% to estimate equivalent Royalty Ounce rate) With the acquisition, Teranga was able to expand its land package to over 950 km 2 including much of a 70 km prospective greenstone belt. In February 2021, Endeavour Mining Corporation (“Endeavour”) acquired Teranga. Over the first six years following the stream acquisition, Teranga delivered 22,500 oz of gold annually to Franco-Nevada, under a fixed arrangement, for a total of 135 koz of gold delivered. The fixed delivery period was fulfilled in December 2019, and between January 2020 and August 2020, Franco-Nevada received 6% of the gold produced from either the Sabodala or Oromin Joint Venture (“OJVG”) properties. In December 2019, Teranga announced an agreement to acquire the adjacent Massawa gold project and commenced processing ore from the project in 2020. Franco-Nevada’s stream does not extend to the Massawa gold project area. In September 2020, Franco-Nevada amended its existing Sabodala gold purchase and sale agreement with Teranga to compensate for displacement from the processing of Massawa ore through the Sabodala processing facilities and to provide for the commingling of Sabodala and Massawa ores. The amended agreement provides that commencing in September 2020, Teranga, now Endeavour, will make fixed deliveries of 783.33 oz of refined gold per month until 105,750 oz of gold have been delivered to Franco-Nevada (the “Fixed Delivery Period”) and 6% of production from the stream area thereafter. Following the Fixed Delivery Period, which is expected to end in October 2031, a reconciliation will be performed to determine if Franco-Nevada would have received more or less than 105,750 oz of gold under the 6% variable stream during such period. Endeavour will be entitled to a credit for an over-delivery which will be applied against the 6% variable stream until depleted and Franco-Nevada will be entitled to a one-time additional delivery in the case of an under-delivery. Franco-Nevada will make ongoing payments for each ounce of gold delivered equal to 20% of the spot gold price. In 2025, Sabodala-Massawa produced 273,533 oz of gold, with the majority produced from Massawa. Endeavour’s 2026 production guidance for Sabodala-Massawa is between 260–305 koz of gold. To date production from Sabodala has been less than the fixed ounces delivered to Franco-Nevada. kilometer 2.5 0 N Sabodala Gold Stream OJVG Concession Sabodala Concession Deposits Senegal Mali Mauritania Sabodala Dakar Guinea Atlantic Ocean 10 kilometres from mill Mill OJVG Sabodala Sabodala West Golouma Deposits Masato Deposit Niakafiri Deposit Sabodala Pit Tailings Gora Deposit * Additional royalty lands to south not shown due to scale. Baneygo Erlistoun King John Garden Well Dogbolter Gloster Moolart Well Petra Rosemont Reichelts Find Russells Find Tooheys Well 2% NSR 2% NSR Perth Port Hedland Kalgoorlie Norseman Kambalda N Duketon BRAZIL BOLIVIA PARAGUAY Current Royalty Tenements Original Royalty Tenements Deposits Excluded from Royalty N kilometer 30 0 Duketon 2% NSR D U K E T O N Producing Location: Australia | Operator: Regis Resources Ltd. | Precious Metals: Au | Royalty: NSR: 2% Franco-Nevada has a 2% NSR royalty encompassing 2,678 km 2 of the Duketon gold project in Western Australia. 2025 2024 2023 Revenue to Franco-Nevada ($ million) $ 10.6 $ 10.5 12.0 M&I Resources (koz Au) 1 2,590 1,790 1,850 Inf. Resources (koz Au) 1 680 680 610 P&P Reserves (koz Au) 1 1,082 798 950 M&I Royalty Ounces (000s) 1,2 42 31 31 Inf. Royalty Ounces (000s) 2 11 12 11 P&P Royalty Ounces (000s) 2 18 14 17 1 Please refer to the tables on pages 126–134 for a breakout of grade and tonnages by Mineral Resource category; all M&I categories are inclusive of Mineral Reserves 2 For Royalty Ounce calculation, Franco-Nevada estimates 85% (89% in 2024, 88% in 2023) of Mineral Reserves and 81% of the Mineral Resources (84% in 2023, 84% in 2023) are subject to our royalty interest and estimates a rate of 2.0% is applicable The project, operated by Regis Resources Ltd. (“Regis”), comprises six active mines and several satellite deposits at various stages of development. The royalty extends to all identified Mineral Resources and Mineral Reserves, with the exception of the Gloster, Ben Hur, King of Creation and Anchor satellite deposits, as well as portions of the Erlistoun, Dogbolter and Petra satellite deposits. Franco-Nevada estimates that 85% of Duketon reserves and and 81% of Duketon resources are subject to Franco-Nevada’s royalty. Regis reported gold production of 233,315 ounces in 2025 and has issued guidance of 220–240 koz for the fiscal year ending June 30, 2026. In 2025, approximately 68% of total Duketon production was subject to Franco-Nevada’s royalty, with a comparable portion anticipated for 2026. The Duketon operations feature three mills–Moolart Well, Garden Well, and Rosemont–with a combined processing capacity of 10 Mtpa. Ore is sourced primarily from the Garden Well and Rosemont underground mines, as well as the King of Creation open pit. Multiple low-grade stockpiles supplement feed to all three mills. Fixed gold deliveries per year until 2031, and thereafter 6% of gold production from Sabodala concessions Land package offers significant exploration potential The operator currently has a 7-year mine plan. M&I Resources could support production for 19 years and Inf. Resources for a further 6 years Production guidance 220–240 koz of gold for year ending June 30, 2026 Annual reserve updates continue to extend mine life M&I Resources could support production for 11 years and Inf. Resources for a further 3 years TSX / NYSE: FNV Franco-Nevada Corporation ★ 97 96 ★ Franco-Nevada Corporation TSX / NYSE: FNV Rest of World Rest of World
S É G U É L A Producing Location: Côte d’Ivoire | Operator: Fortuna Mining Corp. | Precious Metals: Au | Royalty: NSR: 0.6% Franco-Nevada holds a 0.6% NSR on the Séguéla gold mine, owned and operated by Fortuna Mining Corp. (“Fortuna”). 2025 2024 2023 Revenue to Franco-Nevada ($ million) $ 2.9 $ 2.2 $ 1.4 M&I Resources (koz Au) 1 2,004 1,412 1,535 Inf. Resources (koz Au) 1 736 677 245 P&P Reserves (koz Au) 1 1,543 1,016 1,154 M&I Royalty Ounces (000s) 1,2 12 8 9 Inf. Royalty Ounces (000s) 2 4 4 2 P&P Royalty Ounces (000s) 2 9 6 7 1 Please refer to the tables on pages 126–134 for a breakout of grade and tonnages by Mineral Resource category; all M&I categories are inclusive of Mineral Reserves 2 For Royalty Ounce calculation, Franco-Nevada estimates 100% of the Mineral Resources and Mineral Reserves are subject to our royalty interest and estimates a rate of 0.6% is applicable (0.6% in 2024, 0.6% in 2023) In March 2021, Franco-Nevada acquired a 1.2% NSR on the license covering the Séguéla gold mine in Côte d’Ivoire from Roxgold Inc. (“Roxgold”). Fortuna acquired Roxgold in July 2021 and achieved first gold at Séguéla in 2023. The royalty included a 50% buyback option, which Fortuna exercised in March 2024. A feasibility study in 2021 outlined a 9-year mine life averaging 120 kozpa of gold. Séguéla produced 152,426 ounces of gold in 2025 compared with 137,781 ounces in 2024 and is expected to produce between 160–170 koz in 2026. As of December 31, 2025, Séguéla has P&P Mineral Reserves of 1.54 Moz of gold (15.96 Mt at 3.01 g/t), in addition to exclusive Indicated Resources of 461 koz of gold (5.16 Mt at 2.78 g/t) and Inf. Resources of 736 koz of gold (9.17 Mt at 2.50 g/t). Year-over-year, Mineral Reserves increased by 31%, primarily due to the first-time estimation of underground Mineral Reserves at the Sunbird deposit totaling 401 koz (3.50 Mt at 3.60 g/t). The 2026 brownfields exploration budget for Séguéla is $12 million. This includes approximately 69,000 meters of drilling to upgrade resources primarily at the Sunbird underground project and for infill and expansion drilling at the Kingfisher deposit, along with continued target generation, which is all on royalty ground. Fortuna is expecting a plant expansion study in May 2026 to potentially increase production from approximately 165–200 kozpa of gold. S O U T H K A L G O O R L I E Producing Location: Australia | Operator: Northern Star Resources Limited | Precious Metals: Au | Royalty: NSR: 1–4% Northern Star Resources Limited (“Northern Star”) operates the South Kalgoorlie Operation (“SKO”) which has maintained continuous gold production since 1989. 2025 2024 2023 Revenue to Franco-Nevada ($ million) $ 12.5 $ 10.5 $ 6.2 M&I Resources (koz Au) 1 1,992 4,930 1,338 Inf. Resources (koz Au) 1 1,162 2,540 894 P&P Reserves (koz Au) 1 714 1,546 320 M&I Royalty Ounces (000s) 1,2 80 63 46 Inf. Royalty Ounces (000s) 2 46 33 31 P&P Royalty Ounces (000s) 2 29 20 12 1 Please refer to the tables on pages 126–134 for a breakout of grade and tonnages by Mineral Resource category; all M&I categories are inclusive of Mineral Reserves 2 For Royalty Ounce calculation, Franco-Nevada estimates 100% of Mineral Resources and Mineral Reserves (32% in 2024) are subject to our royalty interest and estimates a rate of 4.0% is applicable for Mineral Resources and Mineral Reserves SKO is situated 15 kms south of Kalgoorlie in Western Australia. Franco-Nevada holds a net smelter return royalty ranging from 1.75% to 4% on gold, and 1% to 2.25% on other minerals, covering 470 km 2 of SKO tenements. This includes the HBJ underground mine, the Mt Marion and Pernatty satellite deposits. While historically production from SKO was processed through the 1.2 Mtpa Jubilee Mill, Northern Star placed the Jubilee Mill on care and maintenance in July 2022, redirecting ore to the Kanowna Belle processing facilities. Effective January 1, 2023, the royalty agreement was amended, increasing the royalty rate on the HBJ underground mine from 1.75% to 4%. Northern Star consolidates reporting for SKO with the Kanowna Belle gold mine, and reported combined gold production of 168,545 ounces at the Kalgoorlie Operations for the year ended December 31, 2025. Franco-Nevada estimates that royalty-eligible production represents approximately 54% of the total output from these operations. In 2025, Franco-Nevada received $12.5 million in royalty revenue from SKO. Exploration efforts continue, highlighted by the Hercules discovery announced in May 2023, located 20 kms west of the HBJ mine on tenements subject to a 1.75% royalty payable to Franco-Nevada. In May 2025, Northern Star announced a maiden Mineral Resource of 916 koz at Hercules (13.4 Mt at 2.1 g/t), along with a Mineral Reserve of 246 koz (2.4 Mt at 3.1 g/t). SKO reserves total 714 koz of gold and resources total 3,154 koz of gold. Séguéla 0.6% NSR kilometer 5 0 N Ancien Agouti Boulder Winy Gabbro W Antenna South Antenna North Antenna West P1 Kwenko Siakasso N P7 P2 Kwenko W Koula Antenna Sunbird Schist Resource Pit Target Target Strat Séguéla NSR Area Pelite Kingfisher Sunbird Underground maiden Mineral Reserve adds 401 koz of gold Exploration upside on land package covered by royalty Potential plant expansion being studied The operator currently has a 9-year mine plan. M&I Resources could support production for 12 years and Inf. Resources for a further 4 years 916 koz of gold maiden Mineral Resource at Hercules Expect steady production to continue from HBJ underground mine M&I Resources could support production for 22 years and Inf. Resources for a further 13 years TSX / NYSE: FNV Franco-Nevada Corporation ★ 99 98 ★ Franco-Nevada Corporation TSX / NYSE: FNV Rest of World Rest of World
E D I K A N Producing Location: Ghana | Operator: Perseus Mining Limited | Precious Metals: Au | Royalty: NSR: 1.5% In 2011, Franco-Nevada acquired an effective 1.5% NSR royalty on Perseus Mining Limited’s (“Perseus”) Edikan gold mine within the Ashanti Gold Belt in Ghana, which includes two mining leases of approximately 93 km 2 . 2025 2024 2023 Revenue to Franco-Nevada ($ million) $ 7.3 $ 7.1 $ 6.1 M&I Resources (koz Au) 1 1,265 1,306 1,634 Inf. Resources (koz Au) 1 336 280 283 P&P Reserves (koz Au) 1 629 506 771 M&I Royalty Ounces (000s) 1,2 19 20 25 Inf. Royalty Ounces (000s) 2 5 4 4 P&P Royalty Ounces (000s) 2 9 8 12 1 Please refer to the tables on pages 126–134 for a breakout of grade and tonnages by Mineral Resource category; all M&I categories are inclusive of Mineral Reserves 2 For Royalty Ounce calculation, Franco-Nevada estimates 100% of the Mineral Resources and Mineral Reserves are subject to our royalty interest and estimates a rate of 1.5% is applicable Edikan is a large-scale, low-grade multi open pit operation, which began commercial production in 2012 with ore being processed through a centralized processing facility. Edikan produced 151,741 oz of gold in 2025, down from 193,066 oz in 2024. Perseus has set a production target of 154–169 koz for their 2026 financial year, which ends June 30, 2026. Perseus has also guided 720–750 koz of gold production over 5-years, as of June 2025, and announced that the mine life for Edikan could extend to 2032 with diversified ore sources in the plan. It is expected that approximately 60% of the metal production in the June 2025 five year plan will come from Edikan, with the remainder coming from the Nkosuo claims. Mining at the Nkosuo prospect, located approximately 10 km from the Edikan mill and not covered by Franco- Nevada’s royalty, commenced in Q4 2024. While this ore is processed at the Edikan mill to increase project life, the operator remains focused on new exploration targets and resource conversion within trucking distance that could potentially fall on royalty ground. Plans to mine cutbacks of the Fetish and Esuajah North pits, both which are covered by the royalty, are currently progressing with applications submitted to the relevant regulators for approval to commence mining at both areas. An updated feasibility study is also underway for the Esuajah South underground deposit, which is covered by the royalty and included in the current five year plan. Edikan, Ghana Exploration License Mining License and Royalty Area Deposit Accra Edikan Ghana N kilometer 10 0 Edikan 1.5% NSR Ayanfuri Mine Licenses Mill Site Esuajah South Esuajah North Fetish Chirawewa Ataasi Mampon Abnabna Fobinso Dadieso 1.5% NSR Y A N D A L ( B R O N Z E W I N G ) Producing Location: Australia | Operator: Northern Star Resources Limited. | Precious Metals: Au | Royalty: NSR: 1.5–2% Bronzewing is situated within the Yandal Greenstone Belt in Western Australia. Franco-Nevada’s royalty encompasses 590 km 2 covering all identified Mineral Resources. 2025 2024 2023 Revenue to Franco-Nevada ($ million) $ 2.5 $ 1.1 $ 0.5 M&I Resources (koz Au) 1 4,029 3,764 3,882 Inf. Resources (koz Au) 1 636 468 518 P&P Reserves (koz Au) 1 1,962 2,143 2,320 M&I Royalty Ounces (000s) 1,2 38 35 36 Inf. Royalty Ounces (000s) 2 6 4 5 P&P Royalty Ounces (000s) 2 17 19 20 1 Please refer to the tables on pages 126–134 for a breakout of grade and tonnages by Mineral Resource category; all M&I categories are inclusive of Mineral Reserves 2 For Royalty Ounce calculation, Franco-Nevada estimates 47% of Mineral Resources and Mineral Reserves (47% in 2024, 47% in 2023) are subject to our royalty interest and estimates a rate of 2.0% is applicable Between 1994 and 2004, Bronzewing produced 2.19 Moz of gold from multiple open pit and underground deposits, followed by an additional 0.19 Moz from open pit operations between 2010 and 2013. Ownership of the project has changed on several occasions since 2013. Most recently, Northern Star Resources acquired Bronzewing in November 2019 through a A$193 million take over. Subsequently, Northern Star invested A$180 million to expand the Thunderbox Mill’s capacity from 3.0–6.0 Mtpa. The expansion was completed in December 2022. Northern Star’s Thunderbox Operations comprise ore from both Bronzewing/Orelia (royalty ground) and Thunderbox/Bannockburn (not royalty ground) being treated through the Thunderbox Mill. Mining activities recommenced at Bronzewing in April 2023 with ore being extracted from the Orelia open pit gold deposit and transported 100 km south to the Thunderbox Mill for processing. In 2025, Northern Star reported total gold production of 222,160 oz at Thunderbox Operations, with approximately 16% of this production subject to Franco-Nevada’s royalty. Franco-Nevada received $2.5 million in royalty revenue from Bronzewing in 2025. Franco-Nevada estimates that 44% of reserves and 47% of resources at Thunderbox Operations are subject to Franco- Nevada’s royalty. The Yandal project also includes the Julius deposit, where Franco-Nevada holds a 1.5% NSR royalty under a separate agreement. In 2021, Northern Star developed Julius as a satellite deposit to the Jundee Gold Mine. Mining ceased at Julius in June 2022, although some stockpile ore remains. Franco-Nevada received $0.3 million in royalty revenue from Julius in 2025. Yandal (Bronzewing) 1.5–2% NSR kilometer 10 0 N Current Royalty Tenements Excluded from Royalty Perth Port Hedland Kalgoorlie Wiluna Leinster Norseman Kambalda Yandal N BRAZIL BOLIVIA PARAGUAY Orelia Exploration potential to further extend current mine life The operator currently has a 7-year mine plan. M&I Resources could support production for 13 years and Inf. Resources for a further 3 years Operating mine Ore transported and processed at a central mill M&I Resources could support production for 18 years and Inf. Resources for a further 3 years TSX / NYSE: FNV Franco-Nevada Corporation ★ 101 100 ★ Franco-Nevada Corporation TSX / NYSE: FNV Rest of World Rest of World
Kiziltepe, Türkiye W I L U N A Producing Location: Australia | Operator: Wiluna Mining Corporation Limited | Precious Metals: Au | Royalty: NSR: 3.6% Franco-Nevada holds a 3.6% NSR royalty on all gold production from the Wiluna Gold Project in Western Australia, encompassing the entire 1,150 km 2 property. Discovered in 1896, Wiluna has yielded more than 4.0 Moz of gold to date, with production occurring almost continuously from 1987 through 2022. The site features a 2.1 Mtpa CIL treatment plant and has processed ore from multiple open pit and underground deposits. Wiluna Mining Corporation Limited (“WMC”) commissioned a 750 ktpa Sulphide Ore Concentrate Plant in 2021; however, WMC entered Voluntary Administration on July 20, 2022. Mining activities ceased on December 14, 2022, while stockpile processing extended until February 2023. Wiluna gold resources total 7.0 Moz and gold reserves total 345 koz. Franco-Nevada entered into a Forbearance and Convertible Note Deed with the Administrators of WMC in August 2023. Under this agreement, royalty payments continue to accrue to Franco-Nevada from August 2023 to December 2024, but Franco-Nevada agreed not to enforce its rights under the royalty agreement while WMC seeks to recapitalize and relist on the ASX. Royalty payments resumed on January 1, 2025. Throughout 2025, small-scale tailings reprocessing took place to help offset ongoing care and maintenance expenses. Wiluna’s total gold production in 2025 amounted to 20,932 oz and Franco-Nevada received $4.2 million of royalty revenue from Wiluna in 2025. WMC’s Voluntary Administration concluded on December 31, 2025 and control transitioned to WMC’s board of directors. M&I Resources could support production for 25 years and Inf. Resources for a further 34 years For Royalty Ounce calculation, Franco-Nevada estimates 100% of Mineral Resources and Mineral Reserves are subject to our royalty interest and estimates a rate of 3.6% is applicable K I Z I L T E P E Producing Location: Türkiye | Operator: Zenit Madencilik San. ve Tic. A.S. | Precious Metals: Au & Ag | Royalty: NSR: 2.5% Franco-Nevada has a 2.5% NSR on the Kiziltepe gold-silver mine located in Türkiye which started production in 2017. Kiziltepe is operated by Zenit Madencilik San. ve Tic. A. Ș ., a joint venture owned by Özaltın Holding A. Ş . (53%), Ariana Resources PLC (23.5%), and Proccea Construction Co. (23.5%). Zenit operates both the Kiziltepe and Tav ş an mines; however, Tav ş an is not subject to Franco-Nevada’s royalty. During 2024 to 2025, ore from both Kiziltepe and Tav ş an was processed through the Kiziltepe processing plant. The Kiziltepe mine produced 20,866 oz of gold in 2024. In 2025, combined production from the Kiziltepe and Tav ş an mines totaled 19,517 oz of gold and 70,673 oz of silver. Franco-Nevada estimates that approximately 60% of 2025 production was sourced from Kiziltepe. Starting in 2026, Tav ş an has operated as a standalone heap leach facility and no further production is expected at Kiziltepe. Further exploration is ongoing, with potential mine life extensions across multiple vein systems covered by Franco-Nevada’s royalty. For Royalty Ounce calculation, Franco-Nevada estimates 100% of the Mineral Resources and Mineral Reserves are subject to our royalty interest and estimates a rate of 2.5% is applicable P A N D O R A Producing Location: South Africa | Operator: Sibanye Stillwater Limited | Precious Metals: PGM | Royalty: NSR: 1% Franco-Nevada’s 1% Pandora NSR covers part of Sibanye-Stillwater’s Marikana operations within their Western Limb PGM Mining Operations in South Africa. In February 2025, the 5% net profit interest previously held by Franco-Nevada on the Pandora property was converted to a 1% net smelter return royalty, with an effective date of January 1, 2025. Sibanye-Stillwater’s Pandora property forms a portion of its Marikana operations and is 100% owned following its acquisition of Lonmin plc (“Lonmin”) in June 2019 and includes the currently operating E3 decline. The royalty ground includes extensive underground resources. Sibanye-Stillwater has identified a number of projects in various stages of pre-feasibility and feasibility studies which have the potential to meaningfully extend the mine life and substantially increase production levels from the royalty ground. These projects include an extension of the E3 decline and development of the E4 project that would substantially increase production levels. In addition, some ore that would likely be accessed longer term from the Saffy shaft also fall on the royalty ground. For Royalty Ounce calculation, please refer to page 93 for the Western Limb table, map and notes which includes the 1% NSR on Pandora S I S S I N G U É Producing Location: Côte d’Ivoire | Operator: Perseus Mining Limited | Precious Metals: Au | Royalty: NSR: 0.5% In 2013, Franco-Nevada acquired a 0.5% NSR on tenements that comprise the Sissingué gold project located in Côte d’Ivoire operated by Perseus. The project is comprised of the Sissingué Gold Mine (“SGM”) and the satellite deposits Fimbiasso and Bagoé, located approximately 40 kilometres from the Sissingué processing facilities. Franco-Nevada’s royalty covers SGM, which includes the Airport West target, but does not cover the Fimbiasso and Bagoé claims. Perseus commenced commercial gold production in 2018 and reported 2025 calendar year production from Sissingué of 53,411 ounces of gold. Perseus has set a production target of 78–87 koz of gold for their 2026 financial year, which ends June 30, 2026, and has also guided 265–275 koz of gold production in their five-year outlook, as of June 2025. It is expected that approximately 55% of the metal production in the June 2025 five-year plan will come from Sissingué, with the remainder coming from the Fimbiasso and Bagoé claims. As of February 2026, Perseus announced that the mine life for Sissingué could extend to 2030. This would include continued mining at Sissingué Stage 4, commencement of new mining areas at Bagoé and Airport West in 2026, and the Sissingué Stage 5 cutback in 2027. Production in the latter years was forecast to come primarily from the Fimbiasso and Bagoé satellite deposits, which is not covered by Franco-Nevada’s royalty. At the Sissingué Gold Mine and Fimbiasso Satellite Pits, ongoing exploration continues to identify extensions to existing mineral deposits and other prospects that have significant potential to extend the life of the Sissingué operation. Recent drilling has focused on resource definition and infill programs at Airport West and the Sissingué Main Pit, with approximately 3,000 meters of RC and diamond drilling completed in the 2025 reporting period. Grade control drilling at the Sissingué Main Pit has continued to discover additional material, though mining of narrow structures has led to higher dilution and lower grades than predicted by block models. For Royalty Ounce calculation, Franco-Nevada estimates 100% of Mineral Resources and Mineral Reserves at Sissingué are subject to our royalty interest and estimates a rate of 0.5% is applicable TSX / NYSE: FNV Franco-Nevada Corporation ★ 103 102 ★ Franco-Nevada Corporation TSX / NYSE: FNV Rest of World Rest of World
R E B E C C A Advanced Location: Australia | Operator: Ramelius Resources | Precious Metals: Au | Royalty: NSR: 1.5% The Rebecca Gold project is situated in Western Australia, approximately 150 km east of Kalgoorlie. Franco-Nevada’s 1.5% NSR royalty encompasses a 160 km 2 area, which includes all Rebecca Mineral Resources. Ramelius Resources completed a Definitive Feasibility Study (DFS) for the Rebecca Gold Project in October 2025, and the Board approved Final Investment Decision. The DFS outlines plans for a 3.25 million tonne per annum processing plant located adjacent to the Rebecca deposit, with total preproduction development costs estimated at A$340 million. The project is forecast to deliver 1,086 koz over a nine-year mine life, with 730 koz sourced from the Rebecca deposits. First gold production forecast to commence in Q4 2028. Franco-Nevada’s royalty excludes the Roe deposits. The operator currently has a 9-year mine plan. For Royalty Ounce calculation, Franco-Nevada estimates 100% of Mineral Resources and Mineral Reserves are subject to our royalty interest and estimates a rate of 1.5% is applicable A G A T E C R E E K Advanced Location: Australia | Operator: Savannah Goldfields Limited | Precious Metals: Au | Royalty: NSR: 1% The Agate Creek Gold project is situated in Queensland, approximately 200 km west of Townsville. Franco-Nevada’s 1% NSR encompasses a 293 km 2 area, which includes all Agate Creek Mineral Resources. Savannah Goldfields Ltd (“Savannah”) has applied to amend the Agate Creek Environmental Authority and plans to resume mining at Agate Creek in Q2 2026 following receipt of the updated environmental authority. Agate Creek has an estimated Mineral Resource of 422 koz (15.5 Mt at 0.8 g/t) and an estimated Mineral Reserve of 36 koz (0.5 Mt at 2.5 g/t). Savannah will process Agate Creek ore at its 0.2 million tonne per annum Georgetown processing facility located 90 km north of Agate Creek. There was no production from Agate Creek in 2025. For Royalty Ounce calculation, Franco-Nevada estimates 100% of Mineral Resources and Mineral Reserves are subject to our royalty interest and estimates a rate of 1.0% is applicable P E R A M A H I L L Advanced Location: Greece | Operator: Eldorado Gold Corporation | Precious Metals: Au | Royalty: NSR: 2% Franco-Nevada has a 2% NSR on the Perama Hill project held by Eldorado Gold Corporation (“Eldorado”). The Perama Hill gold project is located in the Thrace region of northeastern Greece and consists of two mining titles covering an area of 19 km 2 and two mining exploration licenses covering an area of 18 km 2 . Perama Hill has an estimated gold Mineral Reserve of 912 koz (8.9 Mt at 3.18 g/t) and contemplates operating as a small open pit mine using a conventional carbon-in-leach gold recovery circuit. The Mineral Reserve supports an 8-year mine plan, producing approximately 100 koz of gold per year. The project also has an additional estimated Inf. Mineral Resource of 2.1 Moz (31.8 Mt at 2.10 g/t). Eldorado has reported that Perama Hill is the next mine it expects to develop in Greece after the Skouries project and that construction could commence as early as 2027. Exploration potential in the region supports opportunities for growth and project optimization and studies are ongoing to prepare for permitting documentation. The EIA was submitted in 2025 and approval is expected by year-end 2026, with community engagement well underway to ensure transparent dialogue and incorporate stakeholder feedback. For Royalty Ounce calculation, Franco-Nevada estimates 100% of Mineral Resources and Mineral Reserves are subject to our royalty interest and estimates a rate of 2.0% is applicable. Silver has been converted assuming $4,500/oz gold and $75.00/oz silver M T K E I T H Advanced Location: Australia | Operator: BHP Group Limited | Metals: Ni | Royalty: NPI: 0.25% / GR: 0.375% Franco-Nevada holds a 0.375% gross royalty and a 0.25% NPI royalty on properties encompassing the Mt Keith nickel operation in Western Australia, situated 450 km north of Kalgoorlie. These royalties extend across 236 km 2 , covering the entirety of Mt Keith, the Jericho Nickel deposit (approximately 25 km northwest of Mt Keith), and portions of the Yakabindie deposits (approximately 25 km south of Mt Keith). The Mt Keith open pit was actively mined from 1993 until October 2024, when BHP suspended all Western Australia Nickel operations due to low nickel prices (BHP intends to review the decision in February 2027). The Mt Keith concentrator processes approximately 11 Mt of ore per year, achieving 70% recoveries. Annual production capacity ranges from 35–40 kt of nickel in concentrate. A total of 4.1 Mt of contained nickel resources remain at Mt Keith, Jericho, and Yakabindie. Franco-Nevada’s royalty covers approximately 60% of total resources (100% of Mt Keith and Jericho and 25% of Yakabindie). For Royalty Ounce calculation, Franco-Nevada estimates 100% of the Mineral Resources and Mineral Reserves are subject to our royalty interest and estimates a rate of 0.50% is applicable. Franco-Nevada has also applied an NSR smelting charge of 30%. Nickel has been converted to Royalty Ounces assuming $7.39/lb ($7.89/lb in 2024, $7.89/lb in 2023) M I L P I L L A S Producing Location: Mexico | Operator: Industrias Peñoles, S.A.B. de C.V. | Metals: Cu | Royalty: Production Payment Franco-Nevada has a production payment royalty on the Milpillas copper mine in Sonora, Mexico operated by Industrias Peñoles, S.A.B. de C.V. (“Peñoles”). The royalty is $0.04/lb of copper produced, if the price of copper is above $1.20/lb. The royalty ground totals an estimated 30 km 2 and covers an underground copper mine and heap leach operation. The royalty was acquired by Franco-Nevada in September 2020 as part of a portfolio of 24 royalties from Freeport-McMoRan Inc. In 2025 Franco-Nevada received $0.96 million in royalty payments from Milpillas. As of December 2024, Milpillas had an estimated mine life of 2 years and a Mineral Reserve of 68,250 tonnes of copper (3.5 Mt at 1.95% copper). Franco-Nevada has not included Milpillas in Royalty Ounce estimates A P H R O D I T E Advanced Location: Australia | Operator: Genesis Minerals Limited | Metals: Au | Royalty: GR: 2.5% The Aphrodite Gold project is situated in Western Australia, approximately 65 km north of Kanowna Belle. Franco-Nevada’s 2.5% GR encompasses a 29 km 2 area, which includes all Aphrodite Mineral Resources. In 2023 Genesis Minerals Limited (“Genesis”) purchased a group of assets, including Aphrodite, for A$ 600 million. Aphrodite has an estimated Mineral Resource of 1.6 Moz (23 Mt at 2.2 g/t). Previous owners contemplated operating Aphrodite as an open pit and underground mine, processing the refractory ore using a conventional carbon-in-leach gold recovery circuit incorporating a flotation circuit to produce a gold concentrate. Genesis’ exploration program is currently testing gaps within the existing large open pit resource and investigating strike extensions and parallel structures. Franco-Nevada receives A$250 thousand annual minimum royalty payment from Genesis. For Royalty Ounce calculation, Franco-Nevada estimates 100% of Mineral Resources and Mineral Reserves are subject to our royalty interest and estimates a rate of 2.5% is applicable TSX / NYSE: FNV Franco-Nevada Corporation ★ 105 104 ★ Franco-Nevada Corporation TSX / NYSE: FNV Rest of World Rest of World
R O G O Z N A Exploration Location: Serbia | Operator: Strickland Metals Limited | Metals: Au, Ag, Cu, Pb & Zn | Royalty: NSR: 2% (Au) / 1.5% (all other metals) Franco-Nevada holds a 2% NSR from gold and 1.5% NSR from all other metals on Strickland Metals’ Rogozna project located near Novi Pazar approximately 400 km south of Belgrade in southern Serbia. The Rogozna Gold and Base Metals Project, located in the Raška District of southern Serbia, lies within the Tethyan Metallogenic Belt, which hosts multiple, giant, porphyry-related deposits. Rogozna hosts a large-scale magmatic hydrothermal system, featuring skarn-based copper gold (+/- Zinc, Silver, and Lead) mineralisation. The key prospects within the project are Shanac, Gradina, Medenovac and Copper Canyon. Strickland completed a maiden Indicated Resource estimate at Shanac of 1.25 Moz AuEq (30 Mt at 1.3 g/t gold equivalent) in April 2026. In addition, Rogozna hosts an Inf. Mineral Resource 7.35 Moz AuEq (191 Mt at 1.2 g/t gold equivalent). A large drill program is planned for 2026, targeting 70,000 meters of drilling with multiple mineral resource updates planned. Strickland Metals is concurrently progressing technical studies in parallel targeting delivery of a pre-feasibility study in 2027. For Royalty Ounce calculation, Franco-Nevada estimates 100% of the Mineral Resources and Mineral Reserves are subject to our royalty interest and estimates a rate of 1.86% (1.83% in 2024) reflecting 2.0% for gold Royalty Ounces, 1.5% for silver Royalty Ounces and 1.275% for copper Royalty Ounces (which factors a NSR smelting charge of 15%). Copper has been converted to Royalty Ounces assuming $5.50/lb ($4.25/lb in 2024) and silver has been converted to Royalty Ounces assuming $4,500/oz gold and $75.00/oz silver ($2,800/oz gold and $31.00/oz silver in 2024) B U L L A B U L L I N G Advanced Location: Australia | Operator: Minerals 260 Limited | Precious Metals: Au | Royalty: GR: 2.45% Au The Bullabulling Gold Project is situated in Western Australia, approximately 65 km west of Kalgoorlie. Franco-Nevada’s 2.45% GR encompasses a 27 km 2 area, which includes all Bullabulling Mineral Resources. 2025 2024 2023 Revenue to Franco-Nevada ($ million) $ – $ – $ – M&I Resources (koz Au) 1 3,000 1,400 2,190 Inf. Resources (koz Au) 1 1,500 890 1,020 P&P Reserves (koz Au) 1 – – – M&I Royalty Ounces (000s) 1,2 74 8 11 Inf. Royalty Ounces (000s) 2 37 5 5 P&P Royalty Ounces (000s) 2 – – – 1 Please refer to the tables on pages 126–134 for a breakout of grade and tonnages by Mineral Resource category; all M&I categories are inclusive of Mineral Reserves 2 For Royalty Ounce calculation, Franco-Nevada estimates 100% of Mineral Resources and Mineral Reserves (60% in 2024, 50% in 2023) are subject to our royalty interest and estimates a rate of 2.45% is applicable (1% in 2024, 1% in 2023) In February 2026 Franco-Nevada acquired a A$170 million gross royalty from Minerals 260 Limited (“Minerals 260”) as part of a strategic funding agreement to support development of the Bullabulling Gold Project. The royalty acquisition added to Franco-Nevada’s historical 1.0% gross royalty over certain project tenements, effectively increasing it to a 2.45% gross royalty over all Bullabulling Mineral Resources. Bullabulling has M&I Mineral Resources of 3.0 Moz Au (93 Mt at 1.0 g/t Au) and Inferred Mineral Resources of 1.5 Moz (42 Mt at 1.1 g/t Au). Minerals 260 expects to publish a Pre-Feasibility Study in July 2026, along with a maiden Mineral Reserve. A final investment decision is expected early 2027, and first gold production potentially as soon as H2 2028. Minerals 260’s intended strategy is to incrementally develop and expand Bullabulling to accelerate and optimize production. Based on Franco-Nevada’s review and current resources potential throughput can potentially be expanded in phases to 7–8 Mtpa. Strategic funding proceeds will enable Minerals 260 to accelerate development of Bullabulling through the expansion of resources drilling and growth, bringing forward camp construction and other infrastructure to fast-track development, and facilitate the ordering of long lead items. Franco-Nevada’s royalty covers a large resource base, including the Phoenix, Bacchus, Dicksons and Kraken deposits which cover 8.5 kilometres of strike-length on the Bullabulling trend, and the Gibraltar deposit which currently spans 1 kilometre strike-length on a sub-parallel trend. Perth Bullabulling Bullabulling 2.45% GR Other Mineral 260 Tenements Minerals 260 Mining Tenements 2.5 km Area Of Interest (AOI) Resource Pit Shell 2 0 kilometers N Dicksons Phoenix Bacchus Kraken Gibraltar 2.45% GR 2.45% GR AOI ~530 km to Perth ~65 km to Kalgoorlie Great Eastern Highway Mining License Gold Prospects Gold Deposits Rogozna 2% (Au) / 1.5% (all other metals) NSR 0 5 Copper Canyon Gradina Shanac Red Creek N kilometer Administrative Boundary Medenovac Veliki Cesme Major Thrust/Suture Serbia Romania Hungary Croatia Bosnia Rogozna Kotlovi PFS expected July 2026 along with maiden Mineral Reserve First gold production potentially as soon as H2 2028 M&I Resources could support production for 17 years and Inf. Resources for a further 8 years Large-scale deposit currently hosting 1.25 Moz AuEq M&I Mineral Resources and 7.35 Moz AuEq Inf. Mineral Resources Rapidly advancing project, with resource updates and an economic study expected in the near-term TSX / NYSE: FNV Franco-Nevada Corporation ★ 107 106 ★ Franco-Nevada Corporation TSX / NYSE: FNV Rest of World Rest of World
M I N I N G E X P L O R A T I O N A S S E T S Franco-Nevada has interests in 250 exploration stage mining properties (165 precious metals assets and 85 diversified (mining) assets) as at May 1, 2026. Exploration assets represent interests on projects where technical feasibility and commercial viability of extracting Mineral Resources are not demonstrable. Some of these assets have associated Mineral Resources that, to be economic, may require additional Mineral Resources, higher commodity prices, permitting approval, lower geopolitical risk or a better financing environment. A good portion of the properties are inactive and may not see activity again. Some of the properties are in proximity to producing or advanced projects. Franco-Nevada has not visited or audited its full list of exploration assets and has relied on operator reports and/or public disclosures to determine which properties are in good standing. It is possible some properties may have lapsed. The following table is a list of the mining exploration assets of Franco-Nevada as at May 1, 2026. Assets that have had their terms or leases expire and have been written off by Franco-Nevada are not listed. Mining Exploration Assets as at May 1, 2026 Asset Operator Interest and % 1 South America Para South Iron Project, Brazil Talon Ferrous Mineracao Ltda 0.5–1% NSR (All Metals) Terra Escura, Brazil Talon Ferrous Mineracao Ltda/Votorantim S.A. 1–2% NSR (All Metals); 4% Cash Dividends Trairao Iron Project, Brazil Talon Ferrous Mineracao Ltda $0.2995/tonne (Fe) Various–Vale, Brazil Vale S.A. Various (Fe) Bronce West, Chile Masglas America Corporation SpA 1–2% NSR (All Minerals) Calvario, Chile Austral Gold Limited (Minera Mena Chile Limitada) 1–2% NSR (All Minerals) El Alto, Chile Barrick Mining Corporation 0.54–2.7% NSR (Cu, Au) La Coipa, Chile Kinross Gold Corporation 3% NSR (Au) Mirador, Chile Austral Gold Limited (Minera Mena Chile Limitada) 1–2% NSR (All Minerals) Morros Blancos, Chile Pampa Metals Corp. (Pampa Metals Chile SpA) 1–2% NSR (All Minerals) Reina Hija, Chile Sumitomo Metal Mining Co., Ltd. (Sumitomo Metal Mining Chile Ltda) 1–2% NSR (All Minerals) San Guillermo, Chile Austral Gold Limited (Guanaco Compania Minera SpA) 1–2% NSR (All Minerals) San Valentino, Chile Atacama Copper Exploration Limited 1–2% NSR (All Minerals) Ayahuanca, Peru Apumayo S.A.C. 1% NSR (Au) Choreveco, Peru Minera del Norte S.A./Aruntani S.A.C. 0.1–0.3% NSR (Au) Conga, Peru Newmont Corporation 1.8% NSR (Au) Cristiana, Peru Fresnillo Peru S.A.C. 1.5% NSR (All Metals) Los Pinos, Peru Tamerlane Ventures Inc. 0.5% NSR (All Metals) Mansa Musa (Minasnioc), Peru Private Investors 2% NSR (All Metals) Parinacochas (Urbaque), Peru Hochschild Mining plc 2% NSR (All Minerals) Pukaqaqa (Antoro Sur), Peru Nexa Resources Peru S.A.A. 1–2% NSR (All Minerals) Quilish, Peru Newmont Corporation 1.8% NSR (Au) Yanamina, Peru EV Resources Ltd. 5% NSR (All Minerals) Canada Carruthers, British Columbia Cariboo Rose Resources Ltd. 2.5% NSR (All Minerals) (buyback option on 1.5%) New Prosperity, British Columbia Taseko Mines Limited Stream (Au) Scottie, British Columbia Scottie Resources Corp. 2% NSR (All Minerals) Spences Bridge (Talisker), British Columbia Talisker Resources Ltd. 2.5% NSR (All Minerals) Spences Bridge (Westhaven), British Columbia Westhaven Gold Corp. 2% NSR (All Minerals) Taken, British Columbia Independence Gold Corp. 2–4% NSR (All Minerals) (buyback option to 1%) Tide, British Columbia Brigade Holdings Limited 1.5% NSR (All Minerals) Trout Lake (MAX Moly Mine), British Columbia Cameo Industries Corp. 2.5% NSR (All Minerals) Maverick (Nokomis), Manitoba Minnova Corp. 2–3% NSR (All Minerals) Maverick (Puffy Lake), Manitoba Minnova Corp. 2–3% NSR (All Minerals) Oxford Lake, Manitoba Big Ridge Gold Corp. 1.5–2.5% NSR (All Minerals) Clarence Stream, New Brunswick Galway Metals Inc. 1% NSR (All Minerals) Golden Ridge, New Brunswick Darryl Leblanc 2% NSR (All Minerals) Buchans, Newfoundland and Labrador Canterra Minerals Corporation 2% NSR (All Minerals) (buyback option on 1%) LabMag (Taconite), Newfoundland and Labrador Abaxx Technologies Inc. 1.666% GR (Iron Ore-Taconite) Mary March, Newfoundland and Labrador Canstar Resources Inc. 1% NSR plus other (All Minerals) Mazenod, Northwest Territories BFR Copper & Gold Inc. 2% NSR (All Minerals) (buyback option on 1%) Redstone (Coates Lake), Northwest Territories H. Coyne and Sons Ltd. (Redbed Resources Corp.) 3–4% NSR (Cu, Ag) Hyde, Nunavut Exploratus Ltd. 2.5% NSR (All Minerals) Black Thor, Ontario Wyloo Muketei Ltd. 2–3% NSR (Cr, Ni, Cu) Butler and Sanderson (Diagnos), Ontario Wyloo Ring of Fire Ltd./Macdonald Mines Exploration Ltd. ROFR on Diagnos Royalty (Diamonds/Base Metals) Catharine 1, Ontario Canadian Exploration Services Limited 1/3 of a 2–3% NSR (All Minerals) Catharine 4, Ontario Canadian Exploration Services Limited/Northstar Gold Corp. 2–3% NSR (All Minerals) Cline Lake, Ontario Alamos Gold Inc. 0.75% NSR (All Minerals) Detour (Gowest), Ontario Agnico Eagle Mines Limited 1% NSR (All Minerals) (buyback option on 0.5%) Detour (Mikwam), Ontario and Quebec Aurelius Minerals Inc. 0.4824% NSR (All Minerals) Diagnos, Ontario Wyloo Muketei Ltd. 2% NSR (All Minerals) Asset Operator Interest and % 1 Canada Continued Eagle’s Nest, Ontario Wyloo Ring of Fire Ltd. 1% GR (All Minerals) Edwards, Ontario Alamos Gold Inc. (Richmont Mines Inc.) 2% NSR (All Minerals) Golden Highway (Aquarius), Ontario Agnico Eagle Mines Limited 1–2% NSR (All Minerals) Golden Highway (Central Timmins), Ontario Grace Gold Ltd. 0–1% NSR (All Minerals) Golden Highway (Kerrs Leases), Ontario Canoe Mining Ventures Corp. (Sheltered Oak Resources Corp.) 1–2% NSR (Au) Golden Highway (Stock), Ontario McEwen Mining Inc. 1% NSR (All Minerals) Golden Highway (Stoughton), Ontario Vault Minerals Limited 0.5–2.5% NSR (Au) Hemlo (JOA), Ontario Hemlo Mining Corp. 0.5–1% NSR (Au) Kerr-Addison, Ontario Gold Candle Ltd. 1% NSR (All Minerals) Kirkland Lake (Amalgamated Kirkland Claims), Ontario Agnico Eagle Mines Limited 2% NSR (Au) Kirkland Lake (Gracie West & Amalgamated Kirkland Extensions), Ontario Agnico Eagle Mines Limited 2% NSR (Au) Kirkland Lake (Kirkland Lake West), Ontario Agnico Eagle Mines Limited 2–3% NSR (Au) Kyle, Ontario Wyloo Muketei Ltd. 2% NSR (All Minerals) Larose, Ontario Tashota Resources Inc. 0.5% NSR (All Minerals) MacFadyen & Pele, Ontario Wyloo Muketei Ltd. 2% NSR (All Minerals) Marathon PGM (Sally Deposit), Ontario Generation Mining Limited/Sibanye Stillwater Limited 2% NSR (Pt, Pd) Musselwhite (North), Ontario Orla Mining Ltd. 2% NSR (All Minerals) Red Lake (Madsen: Newman-Heyson claims), Ontario West Red Lake Gold Mines Inc. 1.5–2% NSR (All Minerals) Red Lake (Newman-Todd), Ontario Trillium Gold Mines Inc./Heliostar Metals Ltd. 1.5–2% NSR (Au) Red Lake (Skinner), Ontario Prosper Gold Corp. 1% NSR (All Minerals) Ring of Fire (Original Noront Properties), Ontario Wyloo Ring of Fire Ltd. 2% NSR (All Minerals) Shining Tree (Creso), Ontario Ore Group Option to acquire 2% NSR (All Minerals) Shining Tree (Knight), Ontario Golden Harp Resources Inc. 2–3% NSR (Au) Sudbury-Podolsky, Ontario Magna Mining Inc. Stream (Au, PGM) Sungold, Ontario Interbanc Capital Corp. 2% NSR (All Minerals) Timmins (Cripple Creek), Ontario Alamos Gold Inc. 0.3825–1.75% NSR (Au) Timmins (First Atlantic Nickel), Ontario First Atlantic Nickel Corp. 5% NSR (All Minerals) Timmins (Kreative), Ontario Kreative Ventures Limited 5% NSR (All Minerals) Timmins (Sewell), Ontario GFG Resources Inc. 1.5–2.5% NSR (Au) Timmins (West Porcupine), Ontario GFG Resources Inc. 2% NSR (All Minerals) Timmins (Whitney 1), Ontario John Prochnau 2.5% NSR (All Minerals) Timmins (Whitney 2), Ontario Discovery Silver Corp. 2.5% NSR (All Minerals) Wawa, Ontario RPX Gold Inc. 1.5% NSR (All Minerals) Windarra (East Property), Ontario Wesdome Gold Mines Ltd. 0.5% NSR (All Minerals) Benoist, Quebec Exploits Discovery Corp. 1% NSR (All Minerals) (buyback option on 0.5%) Cadillac-Sphinx, Quebec Agnico Eagle Mines Limited 1.5% NSR (All Minerals) Casa Berardi (Dieppe), Quebec Orezone Gold Corporation 2–3% NSR (Au) Destiny (Rochebaucourt), Quebec Big Ridge Gold Corp. 3% NSR (All Minerals) Eastmain, Quebec Benz Mining Corp. 1–1.15% NSR on initial 250K oz (Au) Estrades-Caribou, Quebec Yorbeau Resources Inc. 1.275–2.125% NSR (Au, Base Metals) Fenelon, Quebec Wallbridge Mining Company Limited 1% NSR (All Minerals) Galinee, Quebec Nuvau Minerals Corp. 1.5–2% NSR (Au) Heva-Hosco, Quebec Orezone Gold Corporation Stream (Au) Martiniere, Quebec Wallbridge Mining Company Limited 2% NSR (All Minerals) Matagami JV, Quebec Nuvau Minerals Corp. 2% NSR (All Minerals) Matagami PD1, Quebec Nuvau Minerals Corp. Net Carried Interest plus other (All Minerals) Mia, Quebec Q2 Metals Corp. 2% NSR (All Minerals) Norlartic-Camflo, Quebec Agnico Eagle Mines Limited 25% NPI (All Minerals) N2 (Northway-Noyon), Quebec Wallbridge Mining Company Limited (Formation Metals Inc. as optionee) 1% NSR (All Minerals) Phoenix, Quebec Bonterra Resources Inc. 0.5% NSR (All Minerals) (buyback option on 0.25%) Wilson (Verneuil), Quebec Cartier Resources Inc. 0.5% NSR (All Minerals) Crawford Lake, Saskatchewan Denison Mines Corp. 2% NSR (All Minerals) (buyback option on 1%) AurMac, Yukon Banyan Gold Corp. 1% NSR (Net of 5% buyback) (Au) Canalask, Yukon GT Resources Inc. 1% NSR (Net of $1M buydown) (Ni) Flume, Yukon Commander Resources Ltd. 2.5% NSR (All Minerals) (buyback option to 1%) Hy, Yukon Lions Bay Mining Corp. 2% NSR (All Minerals) (buyback option to 1%) Hyland, Yukon Banyan Gold Corp. 0–1% NSR (Net of $1M buydown) (Au) United States Chilito-Cyprus Christmas, Arizona Grupo Mexico, S.A.B. de C.V. (Asarco LLC) $0.02/lb (Cu); beyond 650M lbs production Planet, Arizona Planet Mining Company LLC 2% NSR (All Minerals) (buyback option on 1%) Zeolites, Arizona Imagin Minerals Inc. et al. $1.50/ton plus escalator (Clay) Darwin, California Project Darwin LLC 5% NSR plus other (Au, etc.) Cripple Creek, Colorado Searchlight Exploration, LLC 3% NSR (Au, Ag) La Plata Allard Stock, Colorado Metallic Minerals Corp. 1.5% NSR (All Minerals) Corbin Wickes, Montana Montana Goldfields, Inc. 5% NSR (Au) TSX / NYSE: FNV Franco-Nevada Corporation ★ 109 108 ★ Franco-Nevada Corporation TSX / NYSE: FNV Mining Exploration Assets Mining Exploration Assets
Asset Operator Interest and % 1 Australia Continued Agnew (Miranda Nickel No2), W. Australia Gorilla Gold Mines Ltd 0.5% of production (Ni) Agnew (Vivien Gold Mine), W. Australia Ramelius Resources Limited 3% GR (Au) Camelback, W. Australia GME Resources Limited A$0.50/tonne (Ni) Bullfinch, W. Australia Torque Metals Limited 1% NSR (Au) Butcher Well, W. Australia AngloGold Ashanti Limited/Northern Star Resources Limited 1% NSR; 50K oz production threshold (Au) Butcher Well Area, W. Australia AngloGold Ashanti Limited/Northern Star Resources Limited 0.68–1% NSR (Au) Cue Gold (Day Dawn), W. Australia Westgold Resources Limited 1% GR (Au) Duketon (Southwest), W. Australia Regis Resources Limited 2% NSR (All Minerals) Duketon (West), W. Australia Regis Resources Limited/Duketon Mining Limited (Ni only) 2% NSR (All Minerals) Edna May, W. Australia Ramelius Resources Limited 1.5% GR (All Minerals) Flushing Meadow, W. Australia Yandal Resources Limited 1% NSR (Au, Other Minerals) Flying Fox, W. Australia IGO Limited 2% GR (Ni) FMG Hamersley, W. Australia Fortescue Metals Group Ltd A$0.05/tonne; capped at A$1M (Fe) Glenburgh, W. Australia Gascoyne Resources Ltd 1.5% NPI (All Minerals) Granny Smith (Windich South), W. Australia Gold Fields Limited 1% NSR (All Minerals) Gum Creek (Gidgee/Wyooda Thangoo), W. Australia Horizon Gold Limited 1.25% GR (Au) Gum Creek (Sandstone II/Howards), W. Australia Horizon Gold Limited A$0.35/dry tonne (All Minerals) Jaguar Project (Western Claim), W. Australia Aeris Resources Limited 1–2% NSR (Cu, Zn, Other Metals) Lake Maitland, W. Australia Toro Energy Limited (Uranium)/Mega Uranium Ltd (Au, Other Minerals) 1% NSR (All Minerals) Marvel Loch (May Queen), W. Australia Shandong Tianye Real Estate Development Group Co., Ltd. A$0.50–1.00/cubic metre (Au) Mt Newman-Victory, W. Australia St Barbara Limited/ Venari Minerals NL 0.07% GR (All Minerals) Mungari (Carbine North/Chadwin’s Dam), W. Australia Evolution Mining Limited 3% NPI (All Minerals) Mungari (Lady Jane), W. Australia Evolution Mining Limited 4.5% GR (Au) Munni Munni, W. Australia Alien Metals Ltd One-time payment on production (Au and/or Pt) Murrin Murrin Gold, W. Australia ICM Limited 2.625% NSR (Au, Sulfides) Paddington (Breakaway Dam/12 Mile), W. Australia Zijin Mining Group Co., Limited A$1/ton (All Minerals) Paddington (Matt Dam), W. Australia Zijin Mining Group Co., Limited A$0.60/tonne (Au) Polar Bear, W. Australia Westgold Resources Limited 2% NSR (All Minerals) Randwick Gold Hill, W. Australia E Bouverie, Trindal P/L, Lucas Gold P/L et al. 1–1.5% GR (Au) Red October, W. Australia Matsa Resources Limited 1.75% NSR (Au) South Kalgoorlie (Location 48), W. Australia BHP Group Limited 1–1.75% NSR (Au, Ag, Other Minerals) South Kalgoorlie (St Ives), W. Australia Gold Fields Limited 1–1.75% NSR (Au, Ag, Other Minerals) Super Pit (Western Lease), W. Australia Northern Star Resources Limited 2.5% GR (Au) Talga Talga, W. Australia Novo Resources Corp. 1.5% NSR (Au) Western Tamani (Coyote), W. Australia Black Cat Syndicate Limited A$5-15/oz on production between 300K-1M oz (Au) Yundamindera, W. Australia Nex Metals Explorations Ltd/Arika Resources Ltd 1% NSR (Au) Rest of World Urasar, Armenia Hayasa Metals Inc. (Hayasa Resources Corp LLC) 0.625% NSR (All Minerals) Maibulak deposit, Kazakhstan KAZ Minerals plc $10.41/oz plus escalator (Au) CEXCI, Philippines Nickel Asia Corporation Production Payment; capped at $10M Rogozna (KMC), Serbia Strickland Metals Limited 1.5–2% NSR (Au, Base and Other Metals) Cerro San Pedro, Mexico New Gold Inc. 1.95% NSR (Au, Ag) Cooke 4, South Africa Sibanye Stillwater Limited Stream (Au) Kasese, Uganda Scully Royalty Ltd. 10% of free cash flow; capped at $10M (Co) Aği Daği-Camyurt, Türkiye Tumad Madencilik Sanayi ve Ticaret A.S. 2% NSR (Au) Hasandagi, Türkiye Öznar Maden Yatırımları A. Ş . 2% NSR (Au) Karadag, Türkiye ACG Metals Limited 2.5% NSR (Au) Torul, Türkiye ACG Metals Limited 1.5% NSR (Au) 1 Royalty terms have been simplified for presentation purposes. Different terms may apply to certain portions of properties or by commodity. Some royalties may have sliding scales tied to commodity price. Others may include participation in sale proceeds of property or gross sales Asset Operator Interest and % 1 United States Continued Elkhorn, Montana Montana Goldfields, Inc. 1.1875% NSR (Au) Lewis and Clark County, Montana Hartmut W. Baitis et al. 1% NSR (All Minerals) Carlin (Currant Creek), Nevada Carlin Gold Corporation 3% NSR (All Minerals) Carlin (South Railroad), Nevada Orla Mining Ltd. 1% NSR (All Minerals) Carlin (Willow Creek), Nevada Carlin Gold Corporation 1% NSR (All Minerals) Dune, Nevada Integra Resources Corp. (Millennial NV LLC) 2% NSR (All Minerals) (buyback option on 1%) EaglePicher Diatomite II, Nevada EP Minerals, LLC $0.25/short ton plus other (Diatomite) Eden, Nevada Integra Resources Corp. (Millennial NV LLC) 2% NSR (All Minerals) (buyback option on 1%) Fire Creek, Nevada Hecla Mining Company 2.5% NSR (Au, Ag) Gabbs, Nevada P2 Gold Inc. 2% NSR (All Minerals) (buyback option on 1%) Getchell, Nevada Barrick Mining Corporation/i-80 Gold Corp. 2% NSR (Au) Goldstrike (Rodeo Creek), Nevada Nevada Gold Mines LLC 4% NSR; capped at $500K (Au, Ag) Hollister, Nevada Hecla Mining Company 3–5% NSR (Au, Ag) Isabella Pearl, Nevada Fortitude Gold Corp. 3% NSR (Au) Limousine Butte, Nevada NevGold Corp. 1.5–2.5% NSR (Au) Lone Tree, Nevada i-80 Gold Corp. (Osgood Mining Company, LLC) 1.5–3% NSR (Au) Marigold (SAR), Nevada SSR Mining Inc. 5% NSR (Au) Marigold (Trout Creek), Nevada Nevada Gold Mines LLC 3% NSR (Au) Marr, Nevada Integra Resources Corp. (Millennial NV LLC) 2% NSR (All Minerals) (buyback option on 1%) Midas, Nevada Hecla Mining Company 2.5% NSR (Au, Ag) Mountain View 1, Nevada Integra Resources Corp. (Millennial NV LLC) 1% NSR (All Minerals) Mountain View 2, Nevada Integra Resources Corp. (Millennial NV LLC) 0.5% NSR (Au) Nevada Mineral-Eureka County, Nevada Nevada Gold Mines LLC 2% NSR (All Minerals) Ocelot, Nevada Integra Resources Corp. (Millennial NV LLC) 2% NSR (All Minerals) (buyback option on 1%) Preble, Nevada Barrick Mining Corporation/Nevada Gold Mines LLC 10% NP (Au) Preble (Pinson Fee), Nevada Barrick Mining Corporation 1.5–7.5% NSR (Au, Ag) Rain-Emigrant-Saddle, Nevada Nevada Gold Mines LLC 1.5% NSR (All Minerals) Relief Canyon, Nevada Americas Gold and Silver Corporation 2% NSR (Au) Sandman, Nevada Borealis Mining Company Ltd. (Sandman Resources Inc.) 0.5674% NSR on initial 200K oz (Au) Sleeper, Nevada Paramount Gold Nevada Corp. 2% NSR (All Minerals) Tonkin Springs, Nevada McEwen Mining Inc. 1–2% NSR (Au) Wildcat, Nevada Integra Resources Corp. (Millennial NV LLC) 0.5% NSR (Au) Boling Dome, Texas Total E&P USA, Inc./H & L New Gulf, Inc. $0.0028225 per long ton (Sulfur) Hobson Pearson, Texas Uranium Energy Corp. 20% OR (Uranium) Kings Canyon, Utah Pine Cliff Energy Ltd. 4% NSR (Au) Silver Bell, Utah Unico, Inc. 5% NSR plus other (Au, Cu, Pb, Zn) Tintic, Utah Ivanhoe Electric Inc. 1% NSR (All Minerals) TUG (Tecoma), Utah Fronteer Development (USA) Inc. 5% NSR (All Minerals) Shirley Basin (Davy Crockett), Wyoming Ur-Energy Inc. (Pathfinder Mines Corporation) 4% GR (Uranium) Australia Mt Fitch, Northern Territory Northern Territories Resources Pty Ltd 1–3% NSR (Cu, Pb, Zn, Co, Ni, U) Brown’s Creek, New South Wales Australian Native Landscapes/Hargraves Resources NL 2.25% NSR (All Minerals) Brown’s Creek (Blayney), New South Wales Regis Resources Limited 2.25% NSR (All Minerals) Brocks Creek (Zapopan), Northern Territory Bacchus Resources Pty Ltd A$20/oz (Au) Reynolds Range, Northern Territory Prodigy Gold NL 1–2.5% NSR (Au) Rover, Northern Territory Castile Resources Limited 1.5–2.5% NSR (All Minerals) Spring Hill, Northern Territory PC Gold Pty Ltd A$5.70–13.30/oz (Au) Tennant Creek, Northern Territory Emmerson Resources Limited/Tennant Consolidated Mining Group Pty Ltd 1.29% NSR (Au) Tennant Creek (Chariot), Northern Territory Emmerson Resources Limited A$17.10 or A$30/oz (Au) Tennant Creek-Evolution, Northern Territory CuFe Limited/Evolution Mining Limited 1.29% NSR (Au) Tennant Creek (Orlando), Northern Territory CuFe Limited/Evolution Mining Limited A$30/oz; capped at 64K oz (Au) Bowen Basin (Various), Queensland (31 assets) Peabody Energy Corp/Pembroke Resources South Pty Ltd Production Payment (Coal) Crush Creek, Queensland Navarre Minerals Limited 2.75% GR (All Minerals) King Vol (Walsh River), Queensland Aurora Metals Limited Production Payment (Zn) Millmerran (Power Station), Queensland Genuity Pty Ltd 8.3125% NPI of cashflow; NPV threshold (Coal) Top Camp, Queensland Mayfair Corporations Group Pty Ltd 0.5% GR (Au)/NPI (Other Minerals) Twin Hills, Queensland GBM Resources Ltd 2.5% NSR (Au) Peculiar Knob, S. Australia Peak Iron Mines Pty Ltd Production Payment (Fe) Third Plain, S. Australia Perilya Limited/AIC Mines Limited 0.5% NSR (Zn) Moina, Tasmania Mazel Resources Pty Ltd A$125K lump sum at commencement of mining Rosebery Extension, Tasmania MMG Limited 2.6305% (Au, Ag, Other Minerals) Admiral Hill, W. Australia Genesis Minerals Limited Production Payment (Au) Agnew, W. Australia Gold Fields Limited 2.5% GR (All Minerals) Agnew (Cox), W. Australia Gold Fields Limited 5% GR (Au) Agnew (Miranda Gold), W. Australia Gold Fields Limited 3% GR (Au) Agnew (Miranda Nickel), W. Australia Gold Fields Limited 0.5% of production (Ni) TSX / NYSE: FNV Franco-Nevada Corporation ★ 111 110 ★ Franco-Nevada Corporation TSX / NYSE: FNV Mining Exploration Assets Mining Exploration Assets
Hoyle Pond, Timmins, Ontario | Image Courtesy of the ROM (Royal Ontario Museum), Toronto, Canada. ©ROM Energ y Assets TSX / NYSE: FNV 112 ★ Franco-Nevada Corporation
E N E R G Y A S S E T S Franco-Nevada has owned and invested in energy assets since inception. Our energy investments have allowed us to be opportunistic through the commodity cycles, adding growth and diversity to our portfolio. Energy revenue was 11% of Franco-Nevada’s overall revenue in 2025. The scale of the energy sector along with its many participants has provided access to a diverse set of operators and a broad range of royalty opportunities. Until 2016, Franco-Nevada’s focus was primarily on the Western Canadian Sedimentary Basin. Starting in late 2016, we added exposure to the SCOOP/STACK basins in Oklahoma and the Midland/Delaware basins in Texas due to their attractive economics, favourable regulatory environment and access to market. We subsequently shifted our focus to natural gas, adding royalty assets in the Marcellus shale in Appalachia in 2019, and in the Haynesville shale in East Texas in late 2020 and in Louisiana in 2024. Franco-Nevada’s assets include production from existing wells in addition to exposure to undeveloped acreage which hosts the potential for new well locations which extend production volumes into the future. In order to provide an estimate of future reserves and asset life, we engage third-party reserve evaluators to provide estimates for the Proved and Probable categories, and where appropriate, the Possible, and Contingent resource categories for currently producing formations. These estimates inform our view of future well locations and resources and demonstrate long-lived assets. The assets often also benefit from additional upside exposure in the form of unexploited hydrocarbon-bearing formations at depth and potentially from enhanced hydrocarbon recovery techniques. Major Producing Assets as of May 1, 2026 United States Marcellus, Range Resources Natural Gas & NGLs Haynesville, TG Natural Resources, Others Natural Gas SCOOP/STACK, Continental Resources, Others Oil & Natural Gas Permian Basin, XTO Energy, Others Oil Canada Weyburn Unit, Whitecap Resources Oil Orion, Strathcona Resources Oil We have been opportunistic through the energy commodity cycles and have accumulated assets in North America’s premium oil and gas basins. Oil and Gas Information Advisory In this Asset Handbook, certain natural gas volumes have been converted to barrels of oil equivalent on the basis of six Mcf to one bbl. Boe and mboe may be misleading, particularly if used in isolation. A conversion ratio of six Mcf to one bbl is based on an energy equivalency ratio and does not represent a value equivalency. U.S. and Canadian Energy Assets Cold Lake Anadarko Basin Permian Basin Midland Delaware Stack Scoop Peace River Orion Athabasca Weyburn Williston Basin Appalachian Basin Marcellus Haynesville Neal Hot Springs Oil Gas Geothermal ENERGY ASSETS U.S. Energy 116 Permian Basin 116 SCOOP/STACK 117 Marcellus 118 Haynesville 119 Canadian Energy 120 Weyburn Unit 120 Orion 121 Other Producing Energy Assets 122 Energy Exploration Assets 123 TSX / NYSE: FNV Franco-Nevada Corporation ★ 115 114 ★ Franco-Nevada Corporation TSX / NYSE: FNV North America
P E R M I A N B A S I N Location: Texas & New Mexico, United States | Operator: XTO Energy (ExxonMobil), Diamondback Energy, Permian Resources, Others | Energy: Oil Royalty: Various Royalty Rates Franco-Nevada has exposure to the Permian Basin in West Texas, through both the Midland and Delaware sub-basins. 2025 2024 2023 Revenue to Franco-Nevada ($ million) $ 43.9 $ 45.4 $ 47.6 Production (Mboe) 1 1,083 913 1,007 Commodity Split (%) 2 Oil 52% 57% 51% Gas 25% 20% 30% NGL 23% 23% 19% 1 Production is referenced in barrels of oil equivalent net to Franco-Nevada 2 Percentage based on production revenue from each commodity 3 Asset life is calculated as the Proven, Probable and Possible reserve volumes divided by the prior year production volume These two basins are considered among the most economic and prolific shale oil plays in the U.S. and have been the key drivers behind U.S. oil production growth over the last decade. The Permian is the most active shale play in North America. Effective in the first quarter of 2017, Franco-Nevada purchased a package of royalties in the Midland Basin for approximately $115 million. The Midland Basin comprises the eastern portion of the broader Permian Basin. The royalty acreage is highly diversified, covering a significant portion of the core of the Midland basin and providing exposure to multiple benches in the Wolfcamp and Spraberry formations. The royalties consist of approximately 97% mineral title rights, along with some GORR interests, which apply to approximately 1,036 acres (net to Franco-Nevada). The acreage hosts numerous operators, however, XTO Energy, a subsidiary of ExxonMobil Corporation, operates the largest portion of royalty acreage following their acquisition of Pioneer Natural Resources in 2024. In the third quarter of 2017, Franco-Nevada acquired a package of royalties in the Delaware Basin for approximately $101 million. The Delaware Basin constitutes the western portion of the broader Permian Basin, situated in West Texas and southeast New Mexico. Located west of the Midland Basin, the Delaware Basin exhibits many geological similarities and is favoured by operators due to its stacked pay potential and exceptional economics. The current focus of operators in the Delaware Basin are the Wolfcamp and Bonespring horizons. The royalties consist of approximately 94% mineral title rights, along with some GORR interests, which apply to approximately 676 acres (net to Franco-Nevada). There are various operators across the acreage who continue to direct capital toward the Delaware Basin, which will result in continued development of our assets over time. Franco-Nevada’s Permian assets generated $43.9 million in revenue in 2025, a 3.2% decrease from 2024, reflecting softer oil prices. Despite slightly lower rig activity for the year, there were a record number of new wells completed on our land base in 2025, many of which will be brought into production in the coming year. The Permian assets have an estimated asset life of approximately 21 years³, with additional stacked formations that may be exploited in the future. REAGAN GLASSCOCK MIDLAND ECTOR UPTON CRANE HOWARD MARTIN ANDREWS BORDEN DAWSON CROCKETT IRION Midland Basin WINKLER PECOS REEVES WARD CULBERSON LOVING LEA EDDY JEFF DAVIS New Mexico Texas San Simon Channel Northwest Shelf Central Basin Platform Delaware Basin Net Royalty Acres by County 23% Reeves 16% Martin 15% Glasscock 11% Midland 8% Howard 7% Loving 5% Reagan 4% Upton 3% Ward 3% Culberson 3% Eddy 1.% Lea 1% Other Permian Basin FNV Royalty Acreage Texas Midland Basin Delaware Basin New Mexico Permian Basin N 16 mile 10 0 0 kilometer Royalties provide exposure to Midland and Delaware Basins Permian represents one of the most active and economic plays in North America Exposure to upside through multiple formations at depth S C O O P / S T A C K Location: Oklahoma, United States | Operator: Continental Resources, Ovintiv Inc., Devon Energy, ConocoPhillips, Others | Energy: Oil and Natural Gas Royalty: Various Royalty Rates Through several discrete transactions, Franco-Nevada has accumulated a large royalty position in the SCOOP and STACK plays in Oklahoma. 2025 2024 2023 Revenue to Franco-Nevada ($ million) 1 $ 42.0 $ 31.4 $ 33.1 Production (Mboe) 1 1,174 1,027 1,028 Commodity Split (%) 2 Oil 31% 25% 25% Gas 64% 70% 70% NGL 5% 5% 5% 1 Includes revenue and production net to Franco-Nevada from both Continental Royalty Acquisition Venture and other SCOOP/STACK royalties 2 Percentage based on production revenue from each commodity 3 Asset life is calculated as the Proven, Probable and Possible reserve volumes divided by the prior year production volume. In the fourth quarter of 2016, Franco-Nevada purchased royalty rights in the STACK shale play, located in the Anadarko Basin of Oklahoma, for approximately $100 million. The primary horizon of focus in the area is the Meramec, although the royalties have exposure to multiple horizons at depth, including the Woodford and Osage formations. In the second quarter of 2017, Franco-Nevada expanded its portfolio by acquiring additional mineral title and royalty interests for $27.6 million. This transaction enhanced Franco-Nevada’s existing position in the STACK and introduced new exposure to the SCOOP shale play to the south. In total, the assets consist of GORRs and mineral title rights which apply to approximately 1,430 acres (net to Franco-Nevada). The top three operators on the acreage are Ovintiv Inc. (formerly Encana), Devon Energy, and ConocoPhillips, following its acquisition of Marathon Oil in Q4 2024. These operators reduced their drilling activity in the play in 2020 owing to a sharp drop in commodity prices. Although drilling rates have since rebounded, they remain significantly below the peak levels observed in 2019. In the fourth quarter of 2018, Franco-Nevada and Continental Resources entered into a transaction whereby Franco-Nevada acquired $120 million in existing royalties owned by Continental and formed a jointly owned entity (the “Royalty Acquisition Venture”) to acquire up to $400 million in royalty rights under Continental’s area of operations. Through the Royalty Acquisition Venture, Franco-Nevada funds 80% of the acreage cost and receives 50–75% of distributions, depending on performance against pre-set volume targets. Franco-Nevada received approximately 70% of distributions in 2025, and anticipate our share of distributions to increase going forward, toward a maximum of 75%. In exchange for the partial capital carry in favour of Continental, the venture provides Franco-Nevada with an opportunity to acquire royalty rights at the grass-roots level, leverage the value of Continental’s drilling plans, and benefit from the company’s knowledge of local land title and geology. Additionally, Continental manages the assets, relieving Franco-Nevada of any administrative burden. The venture was designed to acquire royalty rights primarily within acreage operated by Continental, offering robust economics, proximity to infrastructure, and future upside through stacked hydrocarbon-bearing horizons. In the fourth quarter of 2022, Harold Hamm, Continental’s founder, privatized the company through an acquisition of the outstanding publicly traded shares. As of December 31, 2025, Franco-Nevada had contributed $483.5 million to the venture, with a remaining commitment of approximately $36.5 million. Franco-Nevada’s SCOOP/STACK assets generated $42.0 million in revenue in 2025, a 34% increase from 2024, reflecting stronger performance and rebounding gas prices. The SCOOP/STACK assets have an estimated asset life of approximately 19 years³. GARFIELD N km 0 40 Black Oil Volatile Oil Condensate Dry Gas DEWEY BLAINE KINGFISHER MAJOR CANADIAN OKLAHOMA LINCOLN CREEK OKFUSKEE HUGHES COAL ATOKA BRYAN MARSHALL JOHNSTON PONTOTOC SEMINOLE POTTAWATOMIE CLEVELAND MCCLAIN GARVIN MURRAY CARTER LOVE JEFFERSON STEPHENS CLAY COTTON WICHITA WILBARGER TILLAMAN JACKSON KIOWA GRADY GREER WASHITA COMANCHE LOGAN PAYNE CADDO CUSTER Pressure Transition miles 0 25 SCOOP/STACK STACK FNV Royalty Acreage Oklahoma City OKLAHOMA SCOOP TEXAS KANSAS ARKANSAS NEW MEXICO MISSOURI COLORADO Anadarko Basin STACK SCOOP SCOOP/STACK includes both oil and gas-rich areas Exposure to multiple formations at depth Franco-Nevada share of distributions expected to increase Note: Map does not show acreage under Royalty Acquisition Vehicle with Continental TSX / NYSE: FNV Franco-Nevada Corporation ★ 117 116 ★ Franco-Nevada Corporation TSX / NYSE: FNV North America North America
H A Y N E S V I L L E Location: East Texas & Louisiana, United States | Operator: TG Natural Resources, Expand Energy, Sabine Oil & Gas, Others | Energy: Natural Gas Royalty: Various Royalty Rates Franco-Nevada owns a portfolio of royalty rights in the Haynesville natural gas play in East Texas and Louisiana, which it purchased in two separate acquisitions from Mesa Minerals Partners LLC I & II. 2025 2024 2023 Revenue to Franco-Nevada ($ million) $ 29.8 $ 21.0 $ 26.0 Production (Mboe) 1 1,671 1,918 1,886 Commodity Split (%) 2 Oil 0% 0% 0% Gas 99% 99% 99% NGL 1% 1% 1% 1 Production is referenced in barrels of oil equivalent net to Franco-Nevada, although is comprised mostly of natural gas 2 Percentage based on production revenue from each commodity 3 Asset life is calculated as the Proven, Probable and Possible reserve volumes divided by the prior year production volume The first part of the portfolio was acquired in December of 2020 for $135 million, followed by the acquisition of the second portion of the portfolio in January of 2024 for $125 million. The Haynesville is one of the most active natural gas plays in North America, owing to its strong well performance and strategic proximity to infrastructure along the U.S. Gulf Coast, which reduces transportation costs and provides exposure to an expanding Liquified Natural Gas export market. The royalties consist of approximately 2,775 acres of mineral rights in East Texas and 1,330 acres in Louisiana (net to Franco-Nevada). The royalty position associated with our first acquisition is situated in a core area of the East Texas portion of the Haynesville, characterized by a shallower part of the basin where the producing Haynesville formation is thickest. TG Natural Resources (“TGNR”) acquired Rockcliff Energy in 2023 and is the principal operator in this region. Through our second acquisition, Franco-Nevada gained exposure to a broad land position in Louisiana, providing exposure to both the Haynesville and overlying Middle Bossier formations. This acreage is operated by major natural gas producers including Expand Energy, Aethon Energy, and Comstock Resources. Aethon is set to be acquired by Mitsubishi Corporation in a transaction expected to close in Q2 2026. Revenue totalled $29.8 million in 2025, representing an increase from 2024 revenues due to an increase in natural gas prices. The first acquisition achieved payback in 2025, while the second part of our portfolio is expected to achieve payback in 2036. The Haynesville has an estimated asset life of approximately 17 years³. The royalties also provide development potential in the Cotton Valley formation, which may be further exploited in the future. Haynesville N 15 0 mile 10 0 kilometer Texas Eagle Ford Barnett Haynesville Bossier NEW MEXICO Louisiana Oklahoma Arkansas Regional Basins Tuscaloosa Fayetteville Woodford Spraberry Bend Permian Basin Anadarko Basin Ardmore Basin Arkomo Basin Fort Worth Basin FNV Royalty Acreage Harrison Panola Shelby Rusk Nacogdoches San Augustine Angelina Sabine Natchitoches Red River De Soto Bienville Webster Bossier Caddo Texas Louisiana Natural gas exposure with diverse operators Close proximity to U.S. Gulf Coast enhances economics Secure land title with proven production history M A R C E L L U S Location: SW Pennsylvania, United States | Operator: Range Resources | Energy: Natural Gas and NGLs | Royalty: 1% Overriding Royalty Franco-Nevada has a 1% royalty on the majority of Range Resources Corporation’s (“Range”) operated position in Southwest Pennsylvania. 2025 2024 2023 Revenue to Franco-Nevada ($ million) $ 30.5 $ 26.9 $ 28.0 Production (Mboe) 1 1,383 1,462 1,436 Commodity Split (%) 2 Oil 2% 2% 2% Gas 63% 63% 63% NGL 35% 35% 35% 1 Production is referenced in barrels of oil equivalent net to Franco-Nevada, although is comprised mostly of gas and natural gas liquids 2 Percentage based on production revenue from each commodity 3 Asset life is calculated as the Proven, Probable and Possible reserve volumes divided by the prior year production volume The royalty is calculated as 1% of gross production, less minor deductions from approximately 338,000 net acres of Range’s working interest position in Washington, Western Allegheny and Southern Beaver counties in Pennsylvania. The royalty applies to existing production and future development from the Marcellus shale formation as well as future potential development from the Utica and Upper Devonian formations. The royalty is registered on title and is a direct interest in real property. The Marcellus is one of the most prolific and active gas and liquids plays in North America. Range’s acreage is situated within a liquids-rich portion of the Marcellus, enhancing well economics and the overall cost structure. Range helped pioneer the Marcellus shale in 2004 with the successful drilling of the Renz #1 well in Washington County, Pennsylvania. Since then, Range has developed a track record of growing reserves from its asset base. Range’s position in Southwest Appalachia is considered to have one of the longest core inventory lives among U.S. natural gas producers, and its diversified portfolio of transportation capacity mitigates in-basin pricing risk. In 2025, Franco-Nevada received $30.5 million in revenue from the Marcellus royalty. The Marcellus has an estimated asset life of approximately 22 years³ and payback is expected in 2030. There is additional potential in the Utica and Upper Devonian formations, most of which is not included in the above estimate, that may increase the longevity of the asset. Range Resources drill pad, SW Pennsylvania Appalachian Basin Marcellus Diverse exposure to natural gas and natural gas liquids Long-life asset with strong underlying economics Secure land title with exposure to undeveloped formations at depth TSX / NYSE: FNV Franco-Nevada Corporation ★ 119 118 ★ Franco-Nevada Corporation TSX / NYSE: FNV North America North America
W E Y B U R N U N I T Location: Saskatchewan, Canada | Operator: Whitecap Resources Inc. | Energy: Oil | Royalty: NRI: 11.71% /ORR: 0.44% / WI: 2.56% Franco-Nevada, after Whitecap Resources Inc. (“Whitecap”), has the second largest economic interest in the Weyburn Unit, one of the world’s largest geological CO 2 storage projects. 2025 2024 2023 Revenue to Franco-Nevada ($ million) $ 36.9 $ 44.6 $ 50.1 Production (Mboe) 1 641 675 675 Commodity Split (%) 2 Oil 100% 100% 100% Gas 0% 0% 0% NGL 0% 0% 0% 1 Net to FNV based on 0.44% ORR, 11.71% NRI and 2.56% WI. ORR and W.I. volumes are a percentage of gross production. NRI volumes are pro-rated based on our profit, reflecting a net interest 2 Percentage based on production revenue from each commodity 3 Asset life is calculated as the P&P reserve volumes divided by the prior year production volume The Weyburn Unit is situated approximately 129 km southeast of Regina, Saskatchewan, spanning roughly 216 km 2 on a gross basis (net 31 km 2 ) in which the Mississippian Midale beds are unitized. Franco-Nevada holds a 11.71% NRI, a 0.44% ORR and a 2.56% WI in the Weyburn Unit. Production commenced from the Midale zone within the unitized area in 1955 under primary depletion (solution gas expansion). The Weyburn Unit was established in 1963 to implement a waterflood pressure maintenance program. In 2000, Cenovus, the operator at that time, initiated CO 2 injection in a portion of the Weyburn Unit as an enhanced oil recovery (“EOR”) method. At present, CO 2 is being sourced from the Dakota Gasification Company in North Dakota and the Boundary Dam power station in Saskatchewan. Gross production of the Weyburn Unit is approximately 20,800 Boe/d of light oil & NGL’s. For 2025, Franco-Nevada’s revenue from the Weyburn Unit totaled $36.9 million. Weyburn revenues are linked to the Edmonton Light oil benchmark price which averaged C$85.61/bbl in 2025. NRI revenue is recognized net of capital and operating cost deductions, resulting in increased leverage to the oil price. Oil production, including NGLs, net to Franco-Nevada was 1,755 Boe/d. Franco-Nevada takes product-in-kind for its WI and NRI shares of this production and markets it through a third-party marketer. Weyburn is a highly economic reservoir, although our NRI and WI in the unit have higher leverage to commodity price swings than our revenue-based royalties. Weyburn has an estimated asset life of approximately 19 years³. Weyburn Unit wells Unitized land Note: not to scale T7 T6 T5 R13W2 R12W2 R14W2 N Weyburn Unit Note: not to scale R15W2 R14W2 R13W2 R12W2 R11W2 R10W2 R9W2 R8W2 R15W2 R14W2 R13W2 R12W2 R11W2 R10W2 R9W2 R8W2 T9 T8 T7 T6 T5 T4 T3 T9 T8 T7 T6 T5 T4 T3 Weyburn, SK Unitized land Midale, SK N Low decline asset with proven production history CO 2 EOR project commenced in 2000 and continues to be rolled out Interests are leveraged to commodity prices O R I O N Location: Alberta, Canada | Operator: Strathcona Resources Ltd. | Energy: Oil | Royalty: 4% Gross Overriding Royalty Franco-Nevada acquired a 4% GORR on the Orion Thermal Project in the Cold Lake region of Alberta from OSUM Oil Sands Corp. for C$92.5 million in 2017. 2025 2024 2023 Revenue to Franco-Nevada ($ million) $ 12.1 $ 14.0 $ 13.6 Production (Mboe) 248 262 302 Commodity Split (%) 1 Oil 100% 100% 100% Gas 0% 0% 0% NGL 0% 0% 0% 1 Percentage based on production revenue from each commodity 2 Asset life is calculated as the P&P reserve volumes divided by the prior year production volume In 2021, OSUM was acquired by Strathcona Resources Ltd. (“Strathcona”), who currently operates the project. The royalty pertains to the Clearwater formation and allows for the deduction of transportation and diluent expenses associated with transporting the product to market. Orion is a Steam Assisted Gravity Drainage (“SAGD”) operation that commenced commercial production in 2007. The project’s infrastructure includes a central processing facility, surrounded by several well pads which supply the plant. In 2025, average production reached approximately ~17,600 barrels per day of bitumen. The asset is permitted to produce up to 25,000 barrels per day of bitumen. Franco-Nevada recorded revenue of $12.1 million in 2025. Royalty payments are based on the WCS benchmark price and are influenced by fluctuations in the differential with WTI, as well as by the cost of diluent necessary to transport the product to market. Orion has an estimated asset life of approximately 35 years 2 . Orion processing facilities, Alberta Grand Prairie Calgary Lloydminster Hardisty Edmonton Fort McMurray Cold Lake Peace River Alberta Saskatchewan Orion Athabaska Lloydminster Hardisty Edmonton Cold Lake Orion N Orion Alberta Saskatchewan Liquids Pipeline Long-life resource located in Canada Stable year-over-year production volumes Potential for future capacity expansion TSX / NYSE: FNV Franco-Nevada Corporation ★ 121 120 ★ Franco-Nevada Corporation TSX / NYSE: FNV North America North America
O T H E R P R O D U C I N G E N E R G Y A S S E T S Location: BC / AB / SK / MB, Canada and Oregon, U.S. | Operator: Various | Royalty: ORR / FH: 0.5–20% Franco-Nevada has other interests in Western Canada which generate revenue primarily through lessor royalties and GORRs. 2025 2024 2023 Revenue to Franco-Nevada ($ million) $ 8.2 $ 9.4 $ 9.0 Production (Mboe) 1 242 263 227 Commodity Split (%) 2 Oil 48% 51% 44% Gas 42% 38% 46% NGL 10% 11% 10% 1 Net to the Oil and Gas Interests and does not include production from Neal Hot Springs 2 Percentage based on production revenue from each commodity In addition to the primary producing assets outlined in the preceding pages, Franco-Nevada has 43 Other Producing Assets that generate revenue. These interests cover more than 2,250 km 2 , primarily in Canada. Within Saskatchewan and Manitoba, the assets are concentrated in high-quality oil plays and are operated by companies such as Whitecap Resources, Saturn Oil & Gas Inc., Allied Energy II Corp. and Tundra Oil & Gas Limited. The most prominent producing assets include the Midale Unit and the Tidewater royalties. Franco-Nevada holds a 1.14% gross override royalty interest and a 1.59% working interest in the Midale Unit in Southeast Saskatchewan where Cardinal Energy produces approximately 4,200 Boe/d through CO 2 Enhanced Oil Recovery (“EOR”) techniques. The Tidewater royalties in Saskatchewan generate oil production from the Shaunavon and other formations and are managed by various operators. In Alberta and British Columbia, the interests primarily generate revenue from natural gas production sourced from shallow gas formations such as Milk River and Medicine Hat. In northern Alberta, the interests provide exposure to deeper conventional gas targets including the Shunda, Grosmont and Elkton formations. Franco-Nevada’s most significant assets in the region are the Edson property operated by Canadian Natural Resources Ltd. (“CNRL”) and the Medicine Hat Consolidated Unit No.1, operated by Canlin Resources Partnership. Franco-Nevada has an approximate 15% overriding royalty in the Edson property where CNRL extracts gas and natural gas liquids by developing resources in the Cardium Formation. The Medicine Hat Unit, situated approximately 257 km southeast of Calgary, has been producing gas since 1963. Additional production is derived from both unitized and non-unitized wells, encompassing gross overriding royalty positions in ten different units across Alberta. Other operators on the interests include, CNRL and Imperial Oil. In 2020, Franco-Nevada acquired a royalty on the Neal Hot Springs geothermal operation in Oregon as part of a broader portfolio transaction. The plant produces approximately 22 MW of geothermal energy and is operated by Ormat Technologies, Inc. In 2025, Franco-Nevada received $0.29 million in revenue from Neal Hot Springs. N km 0 80 BRITISH COLUMBIA MONTANA IDAHO WASHINGTON Montney Deep Basin Edson Cardium Duvernay Alberta Bakken Lloydminster Heavy Oil Shallow Gas CBM (HSCN) Redwater Viking CALGARY Peace River Oil Sands Athabasca Oil Sands Cold Lake Oil Sands Alberta/ British Columbia Oil and Gas Interests ALBERTA EDMONTON SASKATCHEWAN Company Core Land Company Non Core Land Major City MANITOBA SASKATCHEWAN NORTH DAKOTA MONTANA Sanish Oil Torquay Oil SE Saskatchewan Lower Bakken and Mississippian Oil Williston Basin Bakken Dodsland Viking Shallow Gas Spearfish Oil REGINA Lloydminster Heavy Oil Shaunavon Oil N km 0 80 Saskatchewan/Manitoba Oil and Gas Interests Weyburn/ Midale ALBERTA Company Core Land Company Non Core Land Major City Primarily quality oil plays in Saskatchewan and Manitoba Exposure to shallow gas and deeper conventional gas in Alberta and British Columbia Interest in the Neal Hot Springs geothermal operation Location: AB / MB / SK, Canada & Nevada, U.S | Operator: Various Royalty: 0.1–18% and WI: 2–100% In addition to its producing assets, Franco-Nevada has exposure to a portfolio of undeveloped, non-producing oil and gas interests. These are grouped into 28 different assets covering an area of over 1,500 km 2 and are located in Alberta, Saskatchewan and Manitoba along with a small amount of acreage in Nevada. Much of the interests consist of mineral title which is currently unleased. E N E R G Y E X P L O R AT I O N A S S E T S Location Big Bend Alberta Carbon Alberta Cindy/Belloy Alberta Colgate Saskatchewan Devil Alberta Dixonville Alberta Elko Mineral Rights Nevada Flatrock British Columbia Ghost Pine Alberta Granor Alberta Harvest – SK Saskatchewan Hotchkiss Alberta Inverness Alberta Killam Alberta Liege Alberta Long Coulee Alberta Melville Saskatchewan Paradise British Columbia Provost Alberta Prudential – MB Manitoba Prudential – SK Saskatchewan Steelman Saskatchewan Swift Current Saskatchewan Touchwood Alberta Turner Alberta W. Calling Lake Alberta Widewater Alberta O T H E R P R O D U C I N G E N E R G Y A S S E T S E N E R G Y E X P L O R AT I O N A S S E T S Location Alameda Oil Saskatchewan Alida Oil Saskatchewan Benson Oil Saskatchewan Carnduff Oil Saskatchewan Cessford Gas Alberta Claresholm Gas Alberta E. Crossfield Gas Alberta Edson Gas Alberta Elswick Oil Saskatchewan Enchant Gas Alberta Ferrybank Gas Alberta Hanlan Gas Alberta Harmattan Gas Alberta Harvest – AB Gas Alberta Huntoon Oil Saskatchewan Innes Oil Saskatchewan Kimiwan Gas Alberta Laglace Gas Alberta Lesser Slave Oil Alberta Lochend Gas Alberta Lone Pine Gas Alberta Macoun Oil Saskatchewan Manitoba Oil Manitoba Medicine Hat Gas Alberta Midale Royalties Oil Saskatchewan Midale WI Oil Saskatchewan Montreal Trust Oil Saskatchewan Neal Hot Springs Geothermal Oregon Oungre Oil Saskatchewan Pearmac – AB Gas Alberta Pearmac – MB Oil Manitoba Pearmac – SK Oil Saskatchewan Prudential – AB Gas Alberta Qu’Appelle Oil Saskatchewan Queensdale Oil Saskatchewan Rainbow South Oil Alberta Rocanville Oil Saskatchewan Royce Gas Alberta Stoughton Oil Saskatchewan Swalwell Gas Alberta Tidewater Oil Saskatchewan Viewfield Oil Saskatchewan Watts/Craig Oil Alberta TSX / NYSE: FNV Franco-Nevada Corporation ★ 123 122 ★ Franco-Nevada Corporation TSX / NYSE: FNV North America North America
Hoyle Pond, Timmins, Ontario | Image Courtesy of the ROM (Royal Ontario Museum), Toronto, Canada. ©ROM Mineral Resources and Mine r a l R e s e r v e s TSX / NYSE: FNV 124 ★ Franco-Nevada Corporation
Measured (M) Indicated (I) (M)+(I) Inferred Notes Tonnes 000s Grade g/t Contained 000 oz Tonnes 000s Grade g/t Contained 000 oz Contained 000 oz Tonnes 000s Grade g/t Contained 000 oz South America Candelaria 3,4 795,303 0.13 3,294 562,429 0.13 2,305 5,599 127,911 0.11 461 Antapaccay 5 435,000 0.06 782 856,000 0.07 1,989 2,717 344,000 0.04 457 Tocantinzinho 6 23,986 1.20 927 23,669 1.32 1,001 1,928 342 1.28 14 Condestable 7 40,300 0.15 192 43,400 0.11 153 346 12,900 0.07 31 Yanacocha 1,8 35,400 1.41 1,600 114,300 1.28 4,700 6,300 363,900 0.60 6,700 Conga 1,9 — — — 693,800 0.65 14,600 14,600 230,500 0.40 2,900 Salares Norte 1,10 — — — 22,713 4.97 3,631 3,631 210 1.50 10 Sossego 1,11 334,200 0.10 1,066 498,000 0.09 1,495 2,560 55,000 0.10 177 Cerro Moro 1,12 600 6.79 131 1,100 5.46 193 324 700 6.85 146 Cascabel 13 1,647,000 0.34 18,000 2,131,000 0.20 13,500 31,400 849,000 0.19 5,300 Posse (Mara Rosa) 14 5,965 0.98 188 31,993 0.87 898 1,086 9,353 0.72 217 Taca Taca 15 441,000 0.13 1,868 1,637,000 0.07 3,847 5,715 145,000 0.06 263 CentroGold (Gurupi) 16 — — — 43,512 1.31 1,830 1,830 18,517 1.29 770 Calcatreu 17 — — — 9,841 2.11 669 669 8,078 1.34 348 PSJ Cobre Mendocino 18 10,391 0.25 83 214,662 0.17 1,178 1,260 434,972 0.13 1,832 El Alto 19 43,000 1.86 2,600 390,000 1.49 19,000 21,000 15,000 1.70 860 Volcan 20 123,979 0.70 2,792 339,274 0.64 7,013 9,804 75,018 0.52 1,246 Central America and Mexico Guadalupe-Palmarejo 1,21 9,735 1.70 531 26,124 1.70 1,424 1,956 19,203 2.05 1,265 United States Carlin Trend 22 15,610 1.31 667 195,122 3.67 24,390 24,390 95,935 3.00 9,431 Bald Mountain 1,23 5,678 1.00 188 205,572 0.54 3,585 3,773 78,862 0.30 790 Marigold 1,24 — — — 365,133 0.43 5,044 5,044 36,903 0.38 453 Mesquite 1,25 6,716 0.66 143 74,242 0.45 1,070 1,213 5,683 0.30 55 Castle Mountain 1,26 82,179 0.57 1,502 235,862 0.54 4,073 5,575 69,980 0.63 1,422 Fire Creek/Midas 1,2,27 — — — 259 13.31 111 111 70,178 1.48 3,344 Hollister 1,2,28 — — — 86 18.77 52 52 745 12.90 309 Stibnite 1,29 — — — 148,159 1.33 6,320 6,320 52,128 0.96 1,611 Sandman 30 — — — 18,550 0.73 433 433 3,246 0.58 61 Robinson 31 317,942 0.18 1,861 40,173 0.15 189 2,050 11,942 0.18 68 Nevada North (Wildcat & Mountain View) 32 — — — 88,624 0.46 1,324 1,324 26,611 0.32 270 Sleeper 1,2,33 4,902 0.54 85 158,338 0.36 1,812 1,897 119,910 0.31 1,214 Arthur 1,34 — — — 251,780 1.16 9,350 9,350 219,790 0.90 6,340 Granite Creek 35 26,493 1.29 1,103 11,980 1.54 593 1,696 2,930 4.26 401 Lone Tree 36 — — — 7,690 1.73 428 428 52,940 1.64 2,789 Cove 37 — — — 1,177 8.20 310 310 4,047 8.90 1,156 Ruby Hill - Mineral Point 38 — — — 216,982 0.48 3,376 3,376 194,442 0.34 2,117 Ruby Hill - Archimedes 39 — — — 6,111 3.60 708 708 5,058 6.27 1,019 Canada Detour Lake 1,40 155,671 0.87 4,347 1,317,621 0.74 31,385 35,732 110,991 1.73 6,168 Hemlo 41 1,750 4.89 275 2,594 4.57 381 656 1,224 7.13 281 Côté Gold 42 153,873 0.93 4,598 535,574 0.79 13,558 18,156 100,600 0.67 2,165 Porcupine - Hoyle Pond 43 — — — 1,167 12.90 484 484 578 15.24 283 Porcupine - Borden 44 1,471 6.17 292 2,274 6.15 449 741 1,372 5.22 230 Porcupine - Pamour 45 — — — 64,755 1.30 2,704 2,704 23,264 1.34 1,002 Porcupine - Dome 46 — — — — — — — 229,284 1.49 10,978 Greenstone 1,47 6,817 1.16 255 167,813 1.42 7,663 7,918 26,371 3.26 2,763 Kirkland Lake 1,48 1,121 9.66 348 26,099 4.41 3,697 4,047 31,076 3.62 3,618 Musselwhite 1,49 5,660 6.02 1,096 5,520 5.28 937 2,032 1,860 4.99 299 Sudbury 1,50 — — — 5,278 0.44 75 75 1,424 0.36 16 Brucejack 1,51 — — — 17,800 6.12 3,500 3,500 14,500 5.30 2,500 Magino 1,52 49,151 0.79 1,248 120,788 0.86 3,332 4,580 14,045 0.75 338 Casa Berardi 1,2,53 9,380 3.19 962 11,443 3.75 1,378 2,340 2,500 6.13 493 Heva-Hosco 1,2,54 — — — 31,711 1.16 1,179 1,179 17,688 1.22 691 Dublin Gulch (Eagle) 55 35,237 0.62 705 197,960 0.57 3,596 4,304 29,595 0.52 497 Timmins 1,56 7,000 2.68 604 6,700 2.54 548 1,152 5,700 2.98 546 Gold River 1,57 — — — 700 5.29 117 117 5,300 6.06 1,027 Canadian Malartic 1,58 36,896 0.50 597 81,688 2.58 6,781 7,378 99,289 2.35 7,490 Island Gold 1,59 1,452 11.42 533 15,713 10.29 5,198 5,731 2,867 11.51 1,061 Golden Highway - Holt Complex 1,60 5,806 4.29 800 5,884 4.75 898 1,699 9,097 4.48 1,310 Golden Highway - Hislop 1,61 — — — 1,337 4.00 173 173 804 3.80 97 Golden Highway - Aquarius 1,62 — — — 12,364 2.15 856 856 122 3.59 14 Valentine Gold 1,63 33,368 1.75 1,880 46,746 1.43 2,146 4,027 20,312 1.65 1,079 Eskay Creek 64 28,648 3.37 3,106 23,252 1.71 1,275 4,380 924 2.26 67 Red Lake (McFinley) 65 — — — 2,130 4.63 317 317 1,780 3.84 220 Courageous Lake 66 6,007 2.84 548 139,167 2.34 10,449 10,997 44,737 2.67 3,841 Goldfields 67 — — — 24,000 1.28 990 990 7,400 0.90 214 Monument Bay 68 — — — 36,581 1.52 1,787 1,787 41,946 1.32 1,781 Red Mountain 69 1,920 8.81 544 1,271 5.85 239 783 405 5.32 69 Fenelon-Martiniere 70 — — — 19,790 3.30 2,100 2,100 18,899 3.35 2,037 Spences Bridge (Shovelnose) 71 — — — 3,437 6.13 677 677 2,292 3.67 270 Wawa 72 — — — 14,653 1.79 842 842 16,183 1.62 843 Kerr-Addison 73 — — — 69,252 1.50 3,311 3,311 55,611 1.30 2,369 Clarence Stream 74 — — — 12,396 2.31 922 922 15,963 2.60 1,334 Scottie 75 — — — — — — — 3,604 6.06 703 AurMac 76 — — — 112,500 0.63 2,274 2,274 280,600 0.60 5,453 Measured (M) Indicated (I) (M)+(I) Inferred Notes Tonnes 000s Grade g/t Contained 000 oz Tonnes 000s Grade g/t Contained 000 oz Contained 000 oz Tonnes 000s Grade g/t Contained 000 oz Australia Duketon 77 10,000 0.80 270 61,000 1.20 2,320 2,590 16,000 1.30 680 Matilda (Wiluna) 78 2,760 3.90 346 54,200 1.50 2,609 2,955 34,800 3.62 4,046 South Kalgoorlie 79 2,506 4.40 357 19,881 2.60 1,635 1,992 14,405 2.50 1,162 Yilgarn Star 80 1,976 3.68 234 2,350 4.84 366 600 1,489 6.79 325 Agate Creek 1,81 447 2.04 29 9,403 0.98 297 326 6,090 0.67 132 Mt Martin 82 — — — 5,600 1.40 248 248 3,690 1.61 192 Cue 83 460 4.40 66 5,900 2.00 390 456 4,500 2.00 290 Yandal (Bronzewing) 84 21,059 1.40 949 52,804 1.80 3,080 4,029 12,108 1.60 636 Aphrodite 85 — — — 10,000 2.80 930 930 13,000 1.70 690 Red October 1,86 105 8.40 28 608 5.40 105 133 4,492 4.07 587 Henty 87 — — — 3,250 3.33 347 347 860 3.29 91 Bullabulling 88 — — — 93,000 1.00 3,000 3,000 42,000 1.10 1,500 Rebecca 89 — — — 27,000 1.30 1,100 1,100 6,500 1.20 240 Edna May 90 720 1.10 25 23,000 1.00 700 725 7,000 1.00 220 Glenburgh 91 — — — 13,500 1.00 431 431 2,800 0.90 79 Rest of World Subika (Ahafo) 1,92 32,600 1.53 1,600 97,300 2.53 7,900 9,500 22,700 2.70 2,000 Tasiast 1,93 76,861 0.91 2,252 104,971 1.35 4,545 6,797 35,950 2.10 2,377 Sabodala-Massawa Complex 94 16,900 1.21 661 63,100 2.23 4,529 5,190 27,200 2.02 1,766 Karma 95 300 0.40 4 47,700 1.24 1,894 1,898 16,200 1.30 679 Edikan 96 13,100 0.96 407 24,700 1.08 857 1,265 6,600 1.58 336 Kiziltepe 97 832 1.60 43 976 1.72 54 97 1,009 1.47 48 Séguéla 1,98 626 1.39 28 20,490 3.00 1,974 2,004 9,171 2.50 736 Perama Hill 99 2,890 4.30 412 6,194 2.49 496 908 31,831 2.10 2,145 Aği Daği 1,100 2,516 0.74 60 104,453 0.63 2,132 2,192 19,551 0.52 330 Sissingué 101 900 1.13 34 3,800 1.41 174 208 200 1.10 5 Rogozna 102 — — — — — — — 211,000 0.76 5,200 Total Gold Mineral Resources* 70,145 300,923 369,654 146,485 G O L D M I N E R A L R E S O U R C E S ( I N C L U S I V E O F M I N E R A L R E S E R V E S ) G O L D M I N E R A L R E S O U R C E S ( I N C L U S I V E O F M I N E R A L R E S E R V E S ) *Total excludes Cobre Panamá and New Prosperity TSX / NYSE: FNV Franco-Nevada Corporation ★ 127 126 ★ Franco-Nevada Corporation TSX / NYSE: FNV Mineral Resources and Mineral Reserves Mineral Resources and Mineral Reserves
*Total excludes Cobre Panamá and New Prosperity G O L D M I N E R A L R E S E R V E S G O L D M I N E R A L R E S E R V E S Proven Probable Proven and Probable Notes Tonnes 000s Grade g/t Contained 000 oz Tonnes 000s Grade g/t Contained 000 oz Tonnes 000s Grade g/t Contained 000 oz South America Candelaria 3,4 345,438 0.11 1,206 247,274 0.10 834 592,712 0.11 2,040 Antapaccay 5 170,000 0.05 273 257,000 0.07 578 427,000 0.06 824 Tocantinzinho 6 25,545 1.14 939 24,240 1.20 935 49,784 1.17 1,874 Condestable 7 18,800 0.16 94 20,700 0.11 76 39,500 0.13 170 Yanacocha 8 18,800 0.81 500 — — — 18,800 0.81 500 Conga 9 — — — — — — — — — Salares Norte 10 — — — 19,821 5.40 3,415 19,821 5.40 3,415 Sossego 11 17,100 0.27 148 42,000 0.13 176 59,100 0.17 323 Cerro Moro 12 300 9.94 92 300 5.59 58 600 7.65 150 Cascabel 13 457,500 0.60 8,855 82,200 0.22 579 539,700 0.54 9,433 Posse (Mara Rosa) 14 5,009 1.06 171 24,447 0.95 747 29,456 0.97 917 Taca Taca 15 432,100 0.13 1,836 1,558,000 0.07 3,697 1,990,100 0.09 5,532 CentroGold (Gurupi) 16 — — — — — — — — — Calcatreu 17 — — — — — — — — — PSJ Cobre Mendocino 18 — — — — — — — — — El Alto 19 — — — — — — — — — Volcan 20 — — — — — — — — — Central America and Mexico Guadalupe-Palmarejo 21 5,137 1.79 295 13,927 1.41 632 19,064 1.51 928 United States Carlin Trend 22 8,130 1.56 407 113,821 3.81 13,984 121,951 3.66 14,309 Bald Mountain 23 — — — 66,306 0.60 1,225 66,306 0.60 1,225 Marigold 24 — — — 238,504 0.42 3,237 238,504 0.42 3,237 Mesquite 25 — — — 5,045 0.77 125 5,045 0.77 125 Castle Mountain 26 81,398 0.57 1,485 162,410 0.50 2,620 243,808 0.52 4,105 Fire Creek/Midas 2,27 — — — — — — — — — Hollister 2,28 — — — — — — — — — Stibnite 29 — — — 104,625 1.43 4,819 104,625 1.43 4,819 Sandman 30 — — — — — — — — — Robinson 31 110,513 0.15 545 8,860 0.12 34 119,374 0.15 579 Nevada North (Wildcat & Mountain View) 32 — — — — — — — — — Sleeper 2,33 — — — — — — — — — Arthur 34 — — — 87,640 1.75 4,940 87,640 1.75 4,940 Granite Creek 35 — — — — — — — — — Lone Tree 36 — — — — — — — — — Cove 37 — — — — — — — — — Ruby Hill - Mineral Point 38 — — — — — — — — — Ruby Hill - Archimedes 39 — — — — — — — — — Canada Detour Lake 40 120,371 0.78 3,035 677,690 0.71 15,540 798,061 0.72 18,575 Hemlo 41 — — — 3,746 3.93 473 3,746 3.93 473 Côté Gold 42 116,055 1.05 3,902 101,112 0.97 3,139 217,167 1.01 7,041 Porcupine - Hoyle Pond 43 — — — — — — — — — Porcupine - Borden 44 — — — — — — — — — Porcupine - Pamour 45 — — — — — — — — — Porcupine - Dome 46 — — — — — — — — — Greenstone 47 6,817 1.16 255 137,846 1.23 5,445 144,662 1.23 5,700 Kirkland Lake 48 742 9.36 223 8,068 7.62 1,976 8,810 7.77 2,200 Musselwhite 49 4,150 6.69 892 3,230 6.10 635 7,380 6.43 1,526 Sudbury 50 — — — 987 0.32 10 987 0.32 10 Brucejack 51 — — — 13,500 6.65 2,900 13,500 6.65 2,900 Magino 52 42,437 0.80 1,097 70,704 0.90 2,044 113,141 0.86 3,141 Casa Berardi 2,53 5,573 2.58 463 7,199 3.00 695 12,772 2.82 1,158 Heva-Hosco 2,54 — — — — — — — — — Dublin Gulch (Eagle) 55 21,100 0.68 464 96,600 0.63 1,943 117,700 0.64 2,407 Timmins 56 5,000 2.79 451 4,600 2.68 395 9,600 2.74 846 Gold River 57 — — — — — — — — — Canadian Malartic 58 36,896 0.50 597 76,640 2.66 6,551 113,537 1.96 7,148 Island Gold 59 1,123 11.50 415 13,949 10.54 4,726 15,072 10.61 5,141 Golden Highway - Holt Complex 60 — — — — — — — — — Golden Highway - Hislop 61 — — — — — — — — — Golden Highway - Aquarius 62 — — — — — — — — — Valentine Gold 63 23,400 1.89 1,400 28,200 1.40 1,300 51,600 1.62 2,700 Eskay Creek 64 27,954 3.00 2,657 11,889 1.80 680 39,843 2.60 3,336 Red Lake (McFinley) 65 — — — 400 5.66 78 400 5.66 78 Courageous Lake 66 2,000 3.50 200 31,900 2.60 2,600 33,900 2.60 2,800 Goldfields 67 — — — — — — — — — Monument Bay 68 — — — — — — — — — Red Mountain 69 2,194 6.68 471 351 5.51 62 2,545 6.52 534 Fenelon-Martiniere 70 — — — — — — — — — Spences Bridge (Shovelnose) 71 — — — — — — — — — Wawa 72 — — — — — — — — — Kerr-Addison 73 — — — — — — — — — Clarence Stream 74 — — — — — — — — — Scottie 75 — — — — — — — — — AurMac 76 — — — — — — — — — Proven Probable Proven and Probable Notes Tonnes 000s Grade g/t Contained 000 oz Tonnes 000s Grade g/t Contained 000 oz Tonnes 000s Grade g/t Contained 000 oz Australia Duketon 77 9,000 0.70 191 21,000 1.30 891 30,000 1.10 1,082 Matilda (Wiluna) 78 — — — 5,379 2.00 345 5,379 2.00 345 South Kalgoorlie 79 1,052 5.20 176 5,035 3.30 538 6,087 3.70 714 Yilgarn Star 80 — — — — — — — — — Agate Creek 81 87 3.30 9 373 2.30 28 460 2.50 37 Mt Martin 82 — — — — — — — — — Cue 83 — — — 3,800 2.00 250 3,800 2.00 250 Yandal (Bronzewing) 84 15,658 1.20 622 19,844 2.10 1,341 35,502 1.70 1,962 Aphrodite 85 — — — — — — — — — Red October 86 — — — — — — — — — Henty 87 — — — 1,890 3.28 199 1,890 3.28 199 Bullabulling 88 — — — — — — — — — Rebecca 89 — — — 17,900 1.24 716 17,900 1.24 716 Edna May 90 — — — — — — — — — Glenburgh 91 — — — — — — — — — Rest of World Subika (Ahafo) 92 30,400 1.44 1,400 50,900 1.63 2,700 81,300 1.56 4,100 Tasiast 93 55,584 1.00 1,806 47,181 1.70 2,595 102,765 1.30 4,401 Sabodala-Massawa Complex 94 14,800 1.12 531 28,000 2.48 2,237 42,800 2.01 2,768 Karma 95 300 0.40 4 5,200 0.93 154 5,500 0.90 158 Edikan 96 8,600 0.91 250 9,300 1.27 380 17,900 1.09 629 Kiziltepe 97 451 1.76 26 287 1.81 17 738 1.78 42 Séguéla 98 626 1.39 28 15,335 3.07 1,513 15,961 3.01 1,543 Perama Hill 99 3,000 4.36 421 5,909 2.59 491 8,910 3.18 912 Aği Daği 100 1,450 0.76 36 52,911 0.66 1,130 54,361 0.67 1,166 Sissingué 101 400 1.70 23 1,800 1.95 111 2,200 1.90 134 Rogozna 102 — — — — — — — — — Total Gold Mineral Reserves* 38,890 109,538 148,318 TSX / NYSE: FNV Franco-Nevada Corporation ★ 129 128 ★ Franco-Nevada Corporation TSX / NYSE: FNV Mineral Resources and Mineral Reserves Mineral Resources and Mineral Reserves
M I N E R A L R E S O U R C E S A N D M I N E R A L R E S E R V E S M I N E R A L R E S O U R C E S A N D M I N E R A L R E S E R V E S Silver Mineral Resources - Inclusive of Mineral Reserves Measured (M) Indicated (I) (M)+(I) Silver Inferred Mineral Resources Notes Tonnes 000s Grade g/t Contained 000 oz Tonnes 000s Grade g/t Contained 000 oz Contained 000 oz Tonnes 000s Grade g/t Contained 000 oz Candelaria 4,103 795,303 1.85 47,255 562,429 1.99 36,022 83,277 127,911 1.39 5,735 Antapaccay 104 435,000 1.22 17,111 856,000 1.90 52,216 68,291 344,000 0.79 8,735 Antamina 1,105,106 359,000 9.73 112,361 508,100 12.01 196,168 308,980 1,256,300 10.50 424,105 Condestable 107 40,300 4.18 5,419 43,400 3.15 4,396 9,815 12,900 2.28 947 Yanacocha 1,108 19,300 6.41 4,000 236,500 12.07 91,800 95,800 104,700 14.10 47,300 Conga 1,109 — — — 693,800 2.06 45,900 45,900 175,000 1.10 6,300 Salares Norte 1,110 — — — 22,713 66.89 48,845 48,845 210 8.30 56 Cerro Moro 1,111 600 222.91 4,300 1,100 254.48 9,000 13,400 700 164.00 3,500 Cascabel 112 1,576,000 1.16 58,600 1,437,000 0.71 32,700 91,300 607,000 0.56 11,000 Calcatreu 113 — — — 9,841 19.80 6,275 6,275 8,078 13.10 3,399 Fire Creek/Midas 1,2,114 — — — 259 83.20 694 694 70,178 6.29 14,199 Stibnite 1,115 — — — 148,159 1.97 9,400 9,400 52,128 1.40 2,345 Eskay Creek 116 28,648 89.45 82,391 23,252 32.97 24,644 107,035 924 30.36 902 Perama Hill 117 2,890 4.00 372 6,194 5.00 929 1,302 16,961 11.27 6,148 Nevada North (Wildcat & Mountain View) 118 — — — 88,624 3.45 9,840 9,840 26,611 2.60 2,224 Spences Bridge (Shovelnose) 119 — — — 3,437 32.30 3,565 3,565 2,292 25.20 1,860 Sleeper 1,2,120 4,902 3.62 570 158,338 4.06 20,661 21,231 119,910 2.45 9,454 Cove 121 — — — 1,177 15.00 568 568 4,047 11.10 1,439 Ruby Hill - Mineral Point 122 — — — 216,982 15.00 104,332 104,332 194,442 14.60 91,473 Ruby Hill - Archimedes 123 — — — 6,111 8.05 1,582 1,582 5,058 3.30 536 Arthur 1,124 — — — 251,780 3.13 25,350 25,350 219,790 2.26 15,960 Copper Creek 125 67,200 1.20 2,600 59,900 0.60 1,100 3,800 48,100 0.50 700 Vizcachitas 126 273,000 1.30 11,000 1,268,000 1.00 43,000 54,000 1,823,000 0.90 55,000 Rogozna 127 — — — — — — — 211,000 4.80 32,300 Total Silver Mineral Resources* 345,979 768,987 1,114,582 745,616 *Total excludes Cobre Panamá Silver Mineral Reserves Proven Probable Proven and Probable Notes Tonnes 000s Grade g/t Contained 000 oz Tonnes 000s Grade g/t Contained 000 oz Tonnes 000s Grade g/t Contained 000 oz Candelaria 4,103 345,438 1.34 14,827 247,274 1.53 12,155 592,712 1.42 26,981 Antapaccay 104 170,000 1.00 5,466 257,000 1.30 10,742 427,000 1.20 16,474 Antamina 105,106 260,200 9.90 82,820 268,200 13.00 112,097 528,400 11.50 195,367 Condestable 107 18,800 4.82 2,919 20,700 3.50 2,333 39,500 4.13 5,252 Yanacocha 108 — — — 68,300 8.82 19,400 68,300 8.82 19,400 Conga 109 — — — — — — — — — Salares Norte 110 — — — 19,821 72.21 46,013 19,821 72.21 46,013 Cerro Moro 111 300 223.00 2,100 300 282.00 2,900 600 254.00 5,000 Cascabel 112 457,500 1.70 24,942 82,200 1.20 3,093 539,700 1.60 28,034 Calcatreu 113 — — — — — — — — — Fire Creek/Midas 2,114 — — — — — — — — — Stibnite 115 — — — 104,625 1.91 6,430 104,625 1.91 6,430 Eskay Creek 116 27,954 80.90 72,661 11,889 40.10 15,308 39,843 68.70 87,969 Perama Hill 117 3,000 3.88 374 5,909 4.78 909 8,910 4.48 1,283 Nevada North (Wildcat & Mountain View) 118 — — — — — — — — — Spences Bridge (Shovelnose) 119 — — — — — — — — — Sleeper 2,120 — — — — — — — — — Cove 121 — — — — — — — — — Ruby Hill - Mineral Point 122 — — — — — — — — — Ruby Hill - Archimedes 123 — — — — — — — — — Arthur 124 — — — 87,640 2.76 7,780 87,640 2.76 7,780 Copper Creek 125 — — — — — — — — — Vizcachitas 126 302,247 1.20 11,900 917,685 1.10 31,800 1,219,932 1.10 43,600 Rogozna 127 — — — — — — — — — Total Silver Mineral Reserves* 218,008 270,959 489,583 *Total excludes Cobre Panamá PGM Mineral Resources – Inclusive of Mineral Reserves Measured (M) Indicated (I) (M)+(I) PGM Inferred Mineral Resources Notes Tonnes 000s Grade g/t Contained 000 oz Tonnes 000s Grade g/t Contained 000 oz Contained 000 oz Tonnes 000s Grade g/t Contained 000 oz Stillwater 128 41,000 15.40 20,200 44,100 13.80 19,600 39,800 96,500 13.20 41,100 Western Limb 129,130 580,225 3.82 71,200 826,252 4.07 108,100 179,400 278,889 4.35 39,000 Sudbury 1,131 — — — 5,278 3.05 517 517 1,424 2.47 113 Eagle’s Nest 132 4,727 5.19 789 4,288 4.48 618 1,408 6,750 4.35 943 Marathon (Sally) 133 — — — 24,801 0.62 494 494 14,019 0.48 218 Total PGM Mineral Resources 92,189 129,329 221,618 81,374 PGM Mineral Reserves Proven Probable Proven and Probable Notes Tonnes 000s Grade g/t Contained 000 oz Tonnes 000s Grade g/t Contained 000 oz Tonnes 000s Grade g/t Contained 000 oz Stillwater 128 7,900 14.80 3,700 37,100 13.10 15,600 45,000 13.40 19,400 Western Limb 129, 130 141,651 3.47 15,800 221,047 2.81 20,000 362,698 3.08 35,900 Sudbury 131 — — — 987 2.37 75 987 2.37 75 Eagle’s Nest 132 — — — — — — — — — Marathon (Sally) 133 — — — — — — — — — Total PGM Mineral Reserves 19,500 35,675 55,375 Copper Mineral Resources – Inclusive of Mineral Reserves Measured (M) Indicated (I) (M)+(I) Copper Inferred Mineral Resources Notes Tonnes 000s Grade % Contained Mlbs Tonnes 000s Grade % Contained Mlbs Contained Mlbs Tonnes 000s Grade % Contained Mlbs Yanacocha 1,134 3,700 0.29 — 114,100 0.61 1,543 1,543 134,900 0.40 1,102 Conga 1,135 — — — 693,800 0.26 3,968 3,968 230,500 0.20 882 Copper Creek 136 67,200 0.48 711 59,900 0.31 413 1,123 48,100 0.28 298 Sossego 1,137 334,200 0.66 4,883 498,000 0.59 6,512 11,453 55,000 0.70 849 Cascabel 138 1,647,000 0.42 15,093 2,131,000 0.26 12,304 27,397 849,000 0.23 4,339 NuevaUnión (Relincho) 1,139 895,400 0.29 5,657 1,440,400 0.33 10,411 15,980 724,700 0.36 5,752 Taca Taca 140 441,000 0.58 5,637 1,637,000 0.38 13,578 19,215 145,000 0.27 858 Caserones 141 357,020 0.33 2,637 938,920 0.26 5,300 7,937 74,766 0.20 324 Vizcachitas 142 273,000 0.43 2,605 1,268,000 0.37 10,416 13,021 1,823,000 0.34 13,747 Copper World/East Pit 1,143 902,400 0.42 8,429 326,700 0.37 2,670 11,097 275,000 0.32 1,940 Robinson 144 317,942 0.47 3,261 40,173 0.34 305 3,566 11,942 0.38 100 Rogozna 145 — — — — — — — 211,000 0.15 708 Total Copper Mineral Resources 48,913 67,421 116,300 30,898 Copper Mineral Reserves Proven Probable Proven and Probable Notes Tonnes 000s Grade % Contained Mlbs Tonnes 000s Grade % Contained Mlbs Tonnes 000s Grade % Contained Mlbs Yanacocha 134 — — — — — — — — — Conga 135 — — — — — — — — — Copper Creek 136 — — — — — — — — — Sossego 137 17,100 0.90 339 42,000 0.41 380 59,100 0.55 717 Cascabel 138 457,500 0.64 6,475 82,200 0.36 653 539,700 0.60 7,128 NuevaUnión (Relincho) 139 576,400 0.34 4,321 977,400 0.36 7,757 1,553,800 0.35 11,989 Taca Taca 140 432,100 0.58 5,532 1,558,000 0.38 13,049 1,990,100 0.42 18,582 Caserones 141 310,112 0.34 2,317 486,958 0.27 2,923 797,070 0.30 5,240 Vizcachitas 142 302,247 0.41 2,714 917,685 0.34 6,908 1,219,932 0.36 9,623 Copper World/East Pit 143 319,400 0.54 3,802 65,700 0.52 753 385,100 0.54 4,585 Robinson 144 110,513 0.42 1,025 8,860 0.28 54 119,374 0.41 1,079 Rogozna 145 — — — — — — — — — Total Copper Mineral Reserves 26,526 32,477 58,942 Nickel Mineral Resources – Inclusive of Mineral Reserves Measured (M) Indicated (I) (M)+(I) Nickel Inferred Mineral Resources Notes Tonnes 000s Grade % Contained Mlbs Tonnes 000s Grade % Contained Mlbs Contained Mlbs Tonnes 000s Grade % Contained Mlbs Falcondo 146 40,500 1.42 1,268 31,100 1.53 1,049 2,320 4,900 1.40 151 Eagle’s Nest 147 4,727 2.24 234 4,288 1.50 141 375 6,750 1.67 249 Crawford 148 1,097,100 0.24 5,904 1,464,700 0.23 7,402 13,306 1,693,200 0.22 8,215 Mt Keith 149 132,000 0.54 1,571 67,000 0.52 768 2,340 24,000 0.52 275 Total Nickel Mineral Resources 8,977 9,360 18,340 8,891 Nickel Mineral Reserves Proven Probable Proven and Probable Notes Tonnes 000s Grade % Contained Mlbs Tonnes 000s Grade % Contained Mlbs Tonnes 000s Grade % Contained Mlbs Falcondo 146 44,900 1.28 1,267 26,300 1.36 789 71,200 1.31 2,056 Eagle’s Nest 147 — — — — — — — — — Crawford 148 994,000 0.24 5,172 721,000 0.20 3,183 1,715,000 0.22 8,356 Mt Keith 149 — — — — — — — — — Total Nickel Mineral Reserves 6,439 3,972 10,412 Chromite Mineral Resources – Inclusive of Mineral Reserves Measured (M) Indicated (I) Chromite Inferred Mineral Resources Notes Tonnes 000s Grade % Cr203 Tonnes 000s Grade % Cr203 Tonnes 000s Grade % Cr203 Ring of Fire 150 140,190 32.5 52,573 29.8 54,581 30.8 Total Chromite Mineral Resources 140,190 52,573 54,581 Chromite Mineral Reserves Proven Probable Proven and Probable Notes Tonnes 000s Grade % Cr203 Tonnes 000s Grade % Cr203 Tonnes 000s Grade % Cr203 Ring of Fire 150 — — — — — — Total Chromite Mineral Reserves* — — — *No Mineral Reserve estimate has been reported for the Ring of Fire TSX / NYSE: FNV Franco-Nevada Corporation ★ 131 130 ★ Franco-Nevada Corporation TSX / NYSE: FNV Mineral Resources and Mineral Reserves Mineral Resources and Mineral Reserves
Iron Ore Mineral Resources – Inclusive of Mineral Reserves Measured (M) Indicated (I) Iron Ore Inferred Mineral Resources Notes Tonnes 000s Grade % Fe Tonnes 000s Grade % Fe Tonnes 000s Grade % Fe Vale (Northern & Southeastern System) 1,151 8,316,000 52.7 10,720,300 53.0 4,709,000 43.9 LIORC 1,152,153 523,000 39.3 1,229,000 39.0 662,000 39.0 Total Iron Ore Mineral Resources 8,839,000 11,949,300 5,371,000 Iron Ore Mineral Reserves Proven Probable Proven and Probable Notes Tonnes 000s Grade % Fe Tonnes 000s Grade % Fe Tonnes 000s Grade % Fe Vale (Northern & Southeastern System) 151 2,873,600 59.2 5,182,600 59.8 8,056,300 59.6 LIORC 152,153 352,000 39.0 571,000 39.0 923,000 39.0 Total Iron Ore Mineral Reserves 3,225,600 5,753,600 8,979,300 N O T E S A N D S O U R C E S 1 Mineral Resources reported by operator exclusive of Mineral Reserves. Franco-Nevada’s Qualified Person determined the inclusive Mineral Resources by adding the exclusive Measured and Indicated Mineral Resources to the Proven and Probable Reserves 2 Mineral Resources and Mineral Reserves are reported by the operator in non-metric units. Franco-Nevada’s Qualified Person calculated the metric conversion using 1 opt = 34.286 g/t, 1 short ton = 0.9072 metric tonnes, 1 oz = 31.1035 g 3 Lundin Mining Corporation; News Release, February 18, 2026 4 The stream agreement applies to 100% of the property, but only with respect to the ownership interest of Lundin Mining Corporation which indirectly owns 80% of the Candelaria Copper Mining Complex 5 Glencore plc; Resources & Reserves as at December 31, 2025 6 G Mining Ventures Corp.; News Release, March 12, 2026 7 Rio2 Limited; Corporate Presentation, December 8, 2025 8 Newmont Corporation; News Release, February 19, 2026 9 Newmont Corporation; News Release, February 19, 2026 10 Gold Fields Limited; Mineral Resources and Mineral Reserves Supplement to the Integrated Annual Report 2024, March 31, 2025 11 Vale S.A.; Form 20-F, March 28, 2025. Details of Vale’s Participating Debentures are available on Vale’s website 12 Pan American Silver Corp.; News Release, September 11, 2025 & Corporate Website 13 SolGold plc; Annual Information Form, September 24, 2025 (Alpala & Tandayama America Underground) & News Release, November 26, 2025 (Tandayama America Open Pit) 14 Hochschild Mining PLC; News Release, March 11, 2026 15 First Quantum Minerals Ltd.; Taca Taca Project NI 43-101 Technical Report, February 19, 2026 16 G Mining Ventures Corp.; Corporate Presentation, March 2026 17 Patagonia Gold Corp.; MD&A, November 27, 2025 18 Minera San Jorge SA; Disclosure to Franco-Nevada Corporation, Mineral Resource Estimate Update for the San Jorge Deposit, March 9, 2026 19 Barrick Gold Corporation; Management’s Discussion and Analysis (“MD&A”) Fourth Quarter and Full Year 2025, February 5, 2026 20 Hochschild Mining PLC; News Release, March 11, 2026 21 Coeur Mining, Inc.; Corporate Presentation, February 23, 2026 22 Barrick Gold Corporation; Management’s Discussion and Analysis (“MD&A”) Fourth Quarter and Full Year 2025, February 5, 2026. Carlin Trend includes Goldstrike, Gold Quarry and South Arturo as well as other properties where Franco-Nevada has no royalties or stream interests 23 Kinross Gold Corporation; News Release, February 18, 2026 24 SSR Mining Inc.; Mineral Reserve and Resource Tables as of December 31, 2025, February 17, 2026 25 Equinox Gold Corp.; Corporate Presentation, February 2026 26 Equinox Gold Corp.; Corporate Presentation, February 2026 • All Mineral Resources and Mineral Reserves have been calculated in accordance with CIM or Acceptable Foreign Codes for the purposes of NI 43-101, including Regulation S-K 1300, JORC, or SAMREC guidelines • Mineral Resources, which are not Mineral Reserves, do not have demonstrated economic viability • Unless otherwise noted, Mineral Resources were reported by the operator inclusive of Mineral Reserves • Contained metal does not take into account recovery losses • Franco-Nevada’s royalties or stream interests may not cover the operator’s entire property or all estimated Mineral Resources and Mineral Reserves or a combination of both • The grade of platinum group elements has been reported by the operators as either the sum of the individual platinum group elements grades or the individual grades. In the cases where individual platinum group element grades have been reported, Franco-Nevada’s Qualified Person has calculated the sum of the platinum group element grades for presentation purposes • Mineral Resources and Mineral Reserves based on publicly disclosed information available as of March 12, 2026 but includes assets subsequently acquired by Franco-Nevada • The MRMR statement might have excluded depletion prior to this year’s reporting • Rows and columns may not total precisely due to rounding • Inferred Resources are in addition to Measured and Indicated Resources, as described in the “Technical and Third-Party Information” section on page 144 of this Asset Handbook 27 Hecla Mining Company; News Release, February 13, 2026 28 Hecla Mining Company; News Release, February 13, 2026 29 Perpetua Resources Corp., Form 10-K, April 2, 2025 30 Borealis Mining Company Ltd. & Gold Bull Resources Corp.; News Release, December 10, 2024 31 KGHM Polska Miedź S.A.; Mineral Resources and Reserves Report, December 31, 2014 32 Integra Resources Corp.; Corporate Presentation, February 2026 33 Paramount Gold Nevada Corp.; Form 10-K; September 25, 2025 34 AngloGold Ashanti plc; Q4 2025 & Full Year Earnings Release, February 20, 2026 35 i-80 Gold Corp.; Corporate Presentation, March 2026 36 i-80 Gold Corp.; Corporate Presentation, March 2026 37 i-80 Gold Corp.; Corporate Presentation, March 2026 38 i-80 Gold Corp.; Corporate Presentation, March 2026 39 i-80 Gold Corp.; Corporate Presentation, March 2026 40 Agnico Eagle Mines Limited; News Release, February 12, 2026 41 Hemlo Mining Corp.; Corporate Presentation, February 2026 42 IAMGOLD Corporation; New Release, February 17, 2026 43 Discovery Silver Corp.; Investor Day Presentation, March 2, 2026 44 Discovery Silver Corp.; Investor Day Presentation, March 2, 2026 45 Discovery Silver Corp.; Investor Day Presentation, March 2, 2026 46 Discovery Silver Corp.; Investor Day Presentation, March 2, 2026 47 Equinox Gold Corp.; Corporate Presentation, February 2026 48 Agnico Eagle Mines Limited; News Release, February 12, 2026 49 Orla Mining Ltd.; Corporate Presentation, March 2026 50 Magna Mining Inc.; Corporate Presentation, March 2026 51 Newmont Corporation; News Release, February 19, 2026 52 Alamos Gold Inc.; News Release, February 17, 2026 53 Hecla Mining Company; News Release, February 13, 2026 54 Hecla Mining Company; News Release, February 13, 2026 55 Victoria Gold Corp.; Eagle Gold Mine NI 43-101 Technical Report, April 10, 2023 56 Pan American Silver Corp.; News Release, September 11, 2025 57 Pan American Silver Corp.; News Release, September 11, 2025 58 Agnico Eagle Mines Limited; News Release, February 12, 2026 59 Alamos Gold Inc.; News Release, February 17, 2026 60 Agnico Eagle Mines Limited; News Release, February 12, 2026 61 Kirkland Lake Gold Ltd.; News Release, February 25, 2021 62 Agnico Eagle Mines Limited; News Release, February 12, 2026 63 Equinox Gold Corp.; Corporate Presentation, February 2026 64 Skeena Resources Limited; Eskay Creek Project NI 43-101 Technical Report, November 14, 2023 65 Evolution Mining Limited; ASX Announcement, February 14, 2024 66 Seabridge Gold Inc.; Courageous Lake Pre-feasibility study and Preliminary Economic Assessment NI 43-101 Technical Report, January 5, 2024 67 Fortune Bay Corp.; Goldfields Project Updated NI 43-101 Technical Report & Preliminary Economic Assessment, October 20, 2025 68 Agnico Eagle Mines Limited; News Release, February 16, 2023 69 Ascot Resources Ltd.; Annual Information Form, March 24, 2025 70 Wallbridge Mining Company Limited.; NI 43-101 Technical Report and Preliminary Economic Assessment Update on the Fenelon Gold Project, Quebec, Canada, March 26, 2025 71 Westhaven Gold Corp.; Updated Preliminary Economic Assessment and Mineral Resource Estimate of the Shovelnose Gold Project, April 17, 2025 72 Red Pine Exploration Inc.; Wawa Gold Project NI 43-101 Technical Report, September 30, 2024 73 Gold Candle Ltd.; Corporate Presentation, February 2026 74 Galway Metals Inc.; Corporate Presentation, January 2026 75 Scottie Resources Corp; News Release, May 7, 2025 76 Banyan Gold Corp.; News Release, March 1, 2026 77 Regis Resources Limited; ASX Announcement, May 20, 2025 78 Wiluna Mining Corporation Limited; 2024 & 2025 Annual General Meetings, November 28, 2025 and ASX Announcement, February 16, 2024 79 Northern Star Resources Limited; ASX Announcement, May 15, 2025 80 Barto Gold Mining Pty Ltd, Annual Mineral Resource Statement as at August 31, 2024 81 Savannah Goldfields Ltd; ASX Announcement, January 30, 2026 82 Lefroy Exploration Limited; Corporate Presentation, November 28, 2025 83 Ramelius Resources Limited; ASX Announcement, October 1, 2025 84 Northern Star Resources Limited; ASX Announcement, May 15, 2025 85 Genesis Minerals Limited; Annual Report, August 21, 2025 86 Matsa Resources Ltd.; Annual Report, October 26, 2025 for Red October and AngloGold Ashanti Limited; Mineral Resource and Mineral Reserve Report at December 31, 2024 for Butcher Well 87 Kaiser Reef Limited; ASX Announcement, October 23, 2025 88 Minerals 260 Limited; Corporate Presentation, February 2026 89 Ramelius Resources Limited; ASX Announcement, October 1, 2025 90 Ramelius Resources Limited; ASX Announcement, October 1, 2025 91 Benz Mining Corp; Annual Report, August 29, 2025 92 Newmont Corporation; News Release, February 19, 2026 93 Kinross Gold Corporation; News Release, February 18, 2026 94 Endeavour Mining plc; News Release, March 5, 2026 95 Endeavour Mining Corp.; Annual Report, March 17, 2022 96 Perseus Mining Limited; News Release, August 21, 2025 97 Ariana Resources plc; Replacement Prospectus, August 5, 2025 98 Fortuna Mining Corp.; News Release, January 20, 2026 99 Eldorado Gold Corporation; News Release, November 26, 2025 100 Alamos Gold Inc.; News Release, February 18, 2025 101 Perseus Mining Limited; News Release, August 21, 2025 102 Strickland Metals Limited; ASX Announcement, February 2, 2026 103 Lundin Mining Corporation; News Release, February 18, 2026 104 Glencore plc; Resources & Reserves as at December 31, 2025 105 Teck Resources Limited; Annual Information Form, February 18, 2026 106 The stream agreement applies to 100% of the property, but only with respect to the ownership interest of Teck Resources Limited which indirectly owns a 22.5% interest in Compañía Minera Antamina S.A. 107 Rio2 Limited; Corporate Presentation, December 8, 2025 108 Newmont Corporation; News Release, February 19, 2026 109 Newmont Corporation; News Release, February 19, 2026 110 Gold Fields Limited; Mineral Resources and Mineral Reserves Supplement to the Integrated Annual Report, March 31, 2025 111 Pan American Silver Corp; News Release, September 11, 2025 & Corporate Website 112 SolGold plc; Annual Information Form, September 24, 2025 113 Patagonia Gold Corp.; MD&A, November 27, 2025 114 Hecla Mining Company; News Release, February 13, 2026 115 Perpetua Resources Corp., Form 10-K, April 2, 2025 116 Skeena Resources Limited; Eskay Creek Project NI 43-101 Technical Report, November 14, 2023 117 Eldorado Gold Corporation; News Release, November 26, 2025 118 Integra Resources Corp.; Corporate Presentation, February, 2026 119 Westhaven Gold Corp.; Updated Preliminary Economic Assessment and Mineral Resource Estimate of the Shovelnose Gold Project, April 17, 2025 120 Paramount Gold Nevada Corp.; Form 10-K; September 25, 2025 121 i-80 Gold Corp.; Corporate Presentation, March 2026 122 i-80 Gold Corp.; Corporate Presentation, March 2026 123 i-80 Gold Corp.; Corporate Presentation, March 2026 124 AngloGold Ashanti plc; Q4 2025 & Full Year Earnings Release, February 20, 2026 125 Faraday Copper Corp.; Corporate Presentation, February 2026 126 Los Andes Copper Ltd.; Corporate Presentation, February 2026 127 Strickland Metals Limited; ASX Announcement, February 2, 2026 128 Sibanye Stillwater Limited; JSE Market Release, February 17, 2026 129 Sibanye Stillwater Limited; JSE Market Release, February 17, 2026 130 Western Limb includes the precious metals stream on Sibanye Stillwater Limited’s Western Limb mining operations and the net smelter return royalty on the Pandora property 131 Magna Mining Inc.; Corporate Presentation, March 2026 132 Ring of Fire Metals Pty Ltd.; Technical Report on the Eagle’s Nest Project, January 24, 2024 133 Generation Mining Limited; Marathon Copper-Palladium Project Feasibility Study Report Update, March 28, 2025 134 Newmont Corporation; News Release, February 19, 2026 135 Newmont Corporation; News Release, February 19, 2026 136 Faraday Copper Corp.; Corporate Presentation, February 2026 137 Vale S.A.; Form 20-F, March 28, 2025. Details of Vale’s Participating Debentures are available on Vale’s website 138 SolGold plc; Annual Information Form, September 24, 2025 (Alpala & Tandayama America Underground) & News Release (Tandayama America Open Pit), November 26, 2025 139 Teck Resources Limited; Annual Information Form, February 18, 2026 140 First Quantum Minerals Ltd.; Taca Taca Project NI 43-101 Technical Report, February 19, 2026 141 Lundin Mining Corporation; News Release, February 18, 2026 142 Los Andes Copper Ltd.; Corporate Presentation, February 2026 143 Hudbay Minerals Inc.; Investor Presentation, February 2026 144 KGHM Polska Miedź S.A.; Mineral Resources and Reserves Report, December 31, 2014 145 Strickland Metals Limited; ASX Announcement, February 2, 2026 146 Glencore plc; Resources & Reserves as at December 31, 2014 147 Ring of Fire Metals Pty Ltd.; Technical Report on the Eagle’s Nest Project, January 24, 2024 148 Canada Nickel Company, Inc.; Crawford Nickel Sulfide Project NI 43-101 Technical Report, October 1, 2023 149 BHP Group Limited; Annual Report, August 19, 2025 150 Noront Resources Ltd.; Black Thor, Black Label and Big Daddy NI 43-101 Technical Report, July 27, 2015 & Eagle’s Nest Project NI 43-101 Technical Report, October 19, 2012 for Blackbird 151 Vale S.A.; Form 20-F, March 28, 2025. Details of Vale’s Participating Debentures are available on Vale’s website 152 Labrador Iron Ore Royalty Corporation; Annual Information Form, March 11, 2026 153 Franco-Nevada holds a 9.9% equity interest in Labrador Iron Ore Royalty Corporation (“LIORC”). LIORC, directly and through its wholly-owned subsidiary, owns a 15.1% equity interest in Iron Ore Company of Canada and receives a 7% gross overriding royalty on the operation and also receives a C$0.10/t commission on sales of iron ore M I N E R A L R E S O U R C E S A N D M I N E R A L R E S E R V E S TSX / NYSE: FNV Franco-Nevada Corporation ★ 133 132 ★ Franco-Nevada Corporation TSX / NYSE: FNV Mineral Resources and Mineral Reserves Mineral Resources and Mineral Reserves
Additional Infor ma t i o n Hoyle Pond, Timmins, Ontario | Image Courtesy of the ROM (Royal Ontario Museum), Toronto, Canada. ©ROM N E W P R O S P E R I T Y E X C L U S I O N Mineral Resources - Inclusive of Mineral Reserves Grade Contained Metal Category Tonnes 000s Au g/t Au 000 oz Measured 547,000 0.46 8,100 Indicated 463,000 0.34 5,100 M&I 1,010,000 0.41 13,300 Inferred — — — Mineral Reserves Grade Contained Metal Category Tonnes 000s Au g/t Au 000 oz Proven 481,000 0.46 7,100 Probable 350,000 0.35 3,900 Total 831,000 0.41 11,000 • Source: Taseko Mines Limited’s Corporate Presentation dated January 2026 • The source data above for the New Prosperity Project Mineral Resource and Mineral Reserve estimate and related technical report entitled “Technical Report on the 344 Million Tonne Increase in Mineral Reserves at the Prosperity Gold-Copper Project, British Columbia, Canada” has an effective date of November 2, 2009. Franco-Nevada is not treating the New Prosperity Mineral Resource and Mineral Reserve estimate as current and caution is advised when assessing the reliability of such estimate. Readers are further cautioned that the source data has not been updated since 2009 and, accordingly, caution is advised when assessing its conclusions in light of current operating and capital costs, appropriate technologies, metals price outlooks and like matters • Mineral Resources and Mineral Reserves as defined in accordance with NI 43-101 under guidelines set out in the CIM Standards on Mineral Resources and Mineral Reserves adopted by the CIM Council • Mineral Resources are reported inclusive of Mineral Reserves • Rows and columns may not total precisely due to rounding C O B R E P A N A M Á E X C L U S I O N Mineral Resources - Inclusive of Mineral Reserves Grade Contained Metal Category Tonnes 000s Au g/t Ag g/t Au 000 oz Ag 000 oz Measured 100,900 0.15 1.65 487 5,353 Indicated 3,212,000 0.06 1.33 6,224 136,987 M&I 3,312,900 0.06 1.34 6,710 142,339 Inferred 1,084,500 0.04 1.09 1,286 37,825 Mineral Reserves Grade Contained Metal Category Tonnes 000s Au g/t Ag g/t Au 000 oz Ag 000 oz Proven 98,400 0.15 1.61 475 5,093 Probable 2,669,300 0.06 1.35 5,125 116,062 Total 2,767,700 0.06 1.36 5,600 121,243 • Source: First Quantum Minerals Ltd.’s Annual Information Form dated February 10, 2026 • Cobre Panamá has been on P&SM with production halted since November 2023. Please refer to the “Cobre Panamá Updates – Panamá” section on page 42 of this Asset Handbook and the “Technical and Third-Party Information” section on page 144 of this Asset Handbook. Due to the status of Cobre Panamá, Mineral Resources and Mineral Reserves are being reported separately and are not included in the comprehensive Mineral Resources and Mineral Reserves tables above • Mineral Resources and Mineral Reserves as defined in accordance with NI 43-101 under guidelines set out in the CIM Standards on Mineral Resources and Mineral Reserves adopted by the CIM Council • Mineral Resources are reported inclusive of Mineral Reserves • Stockpiles have been added into the Mineral Resources and Mineral Reserves • Rows and columns may not total precisely due to rounding TSX / NYSE: FNV 134 ★ Franco-Nevada Corporation Mineral Resources and Mineral Reserves
Franco-Nevada Acreage Tabulation (1) Producing Advanced Exploration Total acres km 2 acres km 2 acres km 2 acres km² Precious Metals South America 820,307 3,320 249,822 1,011 337,931 1,368 1,408,060 5,699 Central America & Mexico 30,157 122 32,111 130 675 3 62,943 255 Canada 613,355 2,482 206,996 838 894,969 3,622 1,715,320 6,942 United States 90,852 368 123,732 501 210,047 850 424,631 1,719 Australia 1,439,221 5,824 274,336 1,110 728,023 2,946 2,441,580 9,880 Rest of World 1,668,412 6,752 216,209 875 61,215 248 1,945,836 7,875 Total Precious Metals 4,662,304 18,868 1,103,206 4,465 2,232,860 9,037 7,998,370 32,370 Diversified Iron Ore & Other Mining South America 731,714 2,961 111,350 451 3,106,238 12,571 3,949,302 15,983 Central America & Mexico 6,605 27 59,552 241 – – 66,157 268 Canada 44,973 182 142,365 576 341,011 1,380 528,349 2,138 United States 29,234 118 25,140 102 18,585 75 72,959 295 Australia Australia 29,757 120 58,440 236 1,086,754 4,398 1,174,951 4,754 Rest of World – – – – 265,842 1,076 265,842 1,076 Total 842,283 3,408 396,847 1,606 4,818,430 19,500 6,057,560 24,514 Diversified Energy (2) United States 2,772,581 11,220 – – 53,994 219 2,826,575 11,439 Canada 608,723 2,463 – – 308,912 1,250 917,635 3,713 Total 3,381,304 13,683 – – 362,906 1,469 3,744,210 15,152 Total Diversified 4,223,587 17,091 396,847 1,606 5,181,336 20,969 9,801,770 39,666 Total Estimated Acreage South America 1,552,021 6,281 361,172 1,462 3,444,169 13,939 5,357,362 21,682 Central America & Mexico 36,762 149 91,663 371 675 3 129,100 523 Canada 1,267,051 5,127 349,361 1,414 1,544,892 6,252 3,161,304 12,793 United States 2,892,667 11,706 148,872 603 282,626 1,144 3,324,165 13,453 Australia 1,468,978 5,944 332,776 1,346 1,814,777 7,344 3,616,531 14,634 Rest of World 1,668,412 6,752 216,209 875 327,057 1,324 2,211,678 8,951 Total 8,885,891 35,959 1,500,053 6,071 7,414,196 30,006 17,800,140 72,036 A S S E T C O U N T S Franco-Nevada’s assets are categorized by commodity and stage of development. By commodity, assets are characterized as “Precious Metals” or “Diversified” . Precious Metals includes gold, silver and PGM assets. Diversified includes iron ore, other mining and energy assets (which encompass oil, gas and natural gas liquids). “Producing” assets are those that have generated revenue from steady-state operations for Franco-Nevada or are expected to in the next year. “Advanced” assets are interests on projects which are not yet producing but where, in management’s view, the technical feasibility and commercial viability of extracting Mineral Resources are demonstrable. “Exploration” assets represent interests on projects where technical feasibility and commercial viability of extracting Mineral Resources are not demonstrable. Management uses the following criteria in its assessment of technical feasibility and commercial viability: 1. Geology: there is a known mineral deposit which contains Mineral Resources or Mineral Reserves; or the project is adjacent to a mineral deposit that is already being mined or developed and there is sufficient geologic certainty of converting the deposit into Mineral Resources or Mineral Reserves. 2. Accessibility and authorization: there are no significant unresolved issues impacting the accessibility and authorization to develop or mine the mineral deposit, and social, environmental and governmental permits and approvals to develop or mine the mineral deposit appear obtainable. For accounting purposes, the number of assets has been counted in different manners depending on the category. Royalties on a producing or advanced property are generally counted as a single asset even if Franco-Nevada has multiple different royalties on the property, such as at the Goldstrike complex. Streams covering a group of mines in close proximity and operated by a common operator, such as the Sudbury streams, have also been counted as one asset. However, royalties and streams on producing properties that have significant co-products have been counted twice, such as the Robinson royalties for gold and copper or the Sudbury streams for gold and PGM. Exploration royalties are simply counted by the number of royalty contracts and no effort has been made to consolidate royalties on the same property. Franco-Nevada’s energy interests are subdivided into Producing Assets, which are assets that are currently producing oil or natural gas, or Exploration Assets, which are undeveloped assets that are not producing oil or natural gas. Franco-Nevada’s energy interests consist of a variety of royalty interests and working interests which are derived from a large number of underlying leases, contractual agreements and mineral title covering land positions primarily in western Canada and Oklahoma, North Dakota, Pennsylvania, Louisiana and Texas in the United States. For accounting purposes, these leases, contracts and mineral title have been grouped into distinct land areas and tabulated as individual assets. In many cases, Franco-Nevada owns multiple royalties or working interests that pertain to the same land area, and in these circumstances, the interests are counted as a single asset. As of May 1, 2026, Franco-Nevada estimates that it holds 255 Precious Metals assets and 190 Diversified assets (107 Other Mining assets and 83 Energy assets) for a total of 445 assets. Franco-Nevada Asset Counts at May 1, 2026 Diversified Precious Metals Other Mining Energy Assets Total Producing 53 13 55 121 Advanced 37 9 – 46 Exploration 165 85 28 278 Total 255 107 83 445 A C R E A G E O F A S S E T S The following is a tabulation of the acreage of Precious Metals and Diversified lands subject to Franco-Nevada’s royalty, stream or other interests as at May 1, 2026. Acreage amounts are approximate or estimated and are compiled from available information contained in asset agreements and updated when possible using various sources including government recording offices, operator information such as technical reports, presentations and other sources. Acreage has been converted into standard measure by Franco-Nevada. (1) Represents management’s best available information as at May 1, 2026. Legal status of tenure and rate(s) of royalty, stream and other interests vary by agreement. Cobre Panamá, currently on preservation and safe management, is included in the above calculations and accounts for 32,111 acres (129.95 km 2 ) (2) Gross Acreage TSX / NYSE: FNV Franco-Nevada Corporation ★ 137 136 ★ Franco-Nevada Corporation TSX / NYSE: FNV Additional Information Additional Information Additional Information
B O A R D O F D I R E C T O R S Tom Albanese Tom Albanese is Chair Designate and is currently a director of Franco-Nevada. The Board of Franco-Nevada intends to appoint Tom Albanese as the independent Chair of its Board of Directors following Franco-Nevada's annual meeting on May 12, 2026. Mr. Albanese served as CEO of Vedanta Resources plc (2014 to 2017), CEO of Vedanta Limited (2014 to 2017) and was CEO of Rio Tinto plc and Rio Tinto Limited (2007 to 2013). Mr. Albanese is also a director of CoTec Holdings Corp. He previously served on the boards of Nevada Copper Corp., Vedanta Resources plc, Vedanta Limited, Rio Tinto plc, Rio Tinto Limited, Ivanhoe Mines Limited, Palabora Mining Company and Turquoise Hill Resources Limited. Mr. Albanese holds a Master's of Science degree in Mining Engineering and a Bachelor of Science degree in Mineral Economics both from the University of Alaska Fairbanks. Paul Brink Paul Brink is President & Chief Executive Officer and a director of Franco-Nevada. Prior to his appointment as CEO, Mr. Brink served as President & Chief Operating Officer of Franco-Nevada from May 2018 to May 2020. He has been with Franco-Nevada since its initial public offering in 2007 and successfully led its business development activities as SVP, Business Development from 2008 until his promotion to President & Chief Operating Officer in 2018. Mr. Brink is active with a number of not-for-profit organizations. He previously had roles in corporate development at Newmont, investment banking at BMO Nesbitt Burns and project financing at UBS. Mr. Brink holds a Bachelor’s degree in Mechanical Engineering from the University of Witwatersrand and a Master’s degree in Management Studies from Oxford University. Hugo Dryland Hugo Dryland is a director of Franco-Nevada. Mr. Dryland is also a Global Partner of Rothschild & Co, Chairman of the group’s Global Advisory Metals & Mining Sector and Non-Executive Chairman of the group’s Global Advisory business in Canada. Mr. Dryland joined Rothschild & Co in 1986 and has extensive experience in the mining, minerals, oil and gas, energy, utilities and infrastructure sectors, working on transactions spanning the globe. Throughout his career, Mr. Dryland has been actively involved in the leadership, oversight and execution of M&A mandates, financing advisory transactions and strategic advisory work undertaken in the mining and metals sectors. Mr. Dryland previously served on the boards of RCF Acquisition Corp. (2023), Antofagasta plc (2011 to 2016) and Antofagasta Minerals SA (2011 to 2016). Mr. Dryland holds Masters’ degrees in Business Administration and in Comparative Law from the University of Warwick and George Washington University, respectively. Derek Evans Derek Evans is a director of Franco-Nevada. Mr. Evans served as President & CEO of MEG Energy Corp. from August 2018 until May 2024 and as President and CEO and a director of Pengrowth Energy Corporation from May 2009 until March 2018. He also serves as director and Chair of AltaGas Ltd. Previously, Mr Evans served as Executive Chairman of the Pathways Alliance from May 2024 to February 2026. Mr. Evans has over 40 years of experience in a variety of operational and senior executive positions in the oil and gas business in Western Canada. Mr. Evans is also active in not-for-profit organizations and was a board member of MaRS (an innovation hub) from 2011 until 2023. Mr. Evans holds a Bachelor of Science degree in Mining Engineering from Queen’s University and is a registered Professional Engineer in Alberta. Mr. Evans is also a member of the Institute of Corporate Directors. Dr. Catharine Farrow Catharine Farrow is a director of Franco-Nevada, a Professional Geoscientist (PGO) and accredited Corporate Director (ICD.D) with over 30 years of experience in the mining industry. She is also an Independent Director of ALS Limited, and Aclara Resources Inc. (Lead Director). Dr. Farrow is on the Board of Governors of Laurentian University and is active in the mining and technology industries in both private companies and academia. From 2012 to 2017 she was Founding CEO, Director and Co-Founder of TMAC Resources Inc. Before TMAC, Dr. Farrow was COO of KGHM International (formerly Quadra FNX Mining Ltd.). Before FNX, Dr. Farrow was with both Inco Ltd. and the Ontario Geological Survey. She is a past Director of Eldorado Gold Corporation (2020 to 2025), and Centamin PLC (2019 to 2024). Catharine has been awarded an Honourary Doctor of Science from Acadia University (2025), and an Honourary Doctor of Business Administration from Laurentian University (2024). She has been honoured as one of the 100 Global Inspirational Women in Mining (2015 and 2018). She has also obtained Professional Certificates in Cybersecurity Leadership (2024) and AI Strategy (2025) from Cornell University. Catharine obtained her BSc (Hons) from Mount Allison University, her MSc from Acadia University and her PhD from Carleton University. Maureen Jensen Maureen Jensen is a director of Franco-Nevada. Ms. Jensen also serves as a director of the Bank of Canada. Previously, she served as Chair and Chief Executive Officer of the Ontario Securities Commission (the “OSC”) from 2016 until April 2020 and was the Executive Director and Chief Administrative Officer of the OSC from 2011 to 2016. Before joining the OSC, Ms. Jensen was Senior Vice President, Surveillance and Compliance at the Investment Industry Regulatory Organization of Canada. Ms. Jensen has held senior regulatory and business positions at the Toronto Stock Exchange and had a 20-year career in the mining industry. Ms. Jensen is Chair of Canada’s Ombudsman for Banking Services and Investments and is a Public Governor of FINRA in the United States. In 2022, Ms. Jensen was inducted into the Canadian Mining Hall of Fame. Ms. Jensen is a licensed professional geoscientist (P.Geo.) with Professional Geoscientists Ontario (PGO), holds the ICD.D and GCB.D designations, has a BSc, Doctor of Laws (Honoris Causa) and is a member of the Investment Industry Hall of Fame. Jennifer Maki Jennifer Maki is a director of Franco-Nevada. She is also a director of Baytex Energy Corp. and Pan American Silver Corp. She previously served as Chief Executive Officer of Vale Canada and Executive Director of Vale Base Metals (2014 to 2017) and previously held several other positions with Vale Base Metals, including Chief Financial Officer & Executive Vice-President and Vice-President & Treasurer. She has also served on the boards of not-for-profit organizations. Ms. Maki has a Bachelor of Commerce degree from Queen’s University and a postgraduate diploma from the Institute of Chartered Accountants, both in Ontario, Canada. She is also a Fellow Chartered Professional Accountant (FCPA) and a Fellow Chartered Accountant (FCA) and holds the ICD.D designation and the CERT Certificate in Cybersecurity Oversight. Daniel Malchuk Daniel Malchuk is a director of Franco-Nevada. Mr. Malchuk brings over 30 years of strategic, operational and financial experience in the natural resource industry to the Board. He currently serves as a director of SSR Mining Inc. and a Senior Advisor with Appian Capital Advisory LLP . Previously, Mr. Malchuk served as Chairman of Jetti Resources LLC and held various leadership positions with BHP Group Limited until his retirement in 2020 including President of Operations, Minerals Americas, President of Copper, President of Aluminum, Manganese, and Nickel, President, Minerals Exploration and Vice President, Strategy and Development. He is also a member of the Senior Advisory Board at the Pre-Columbian Art Museum in Santiago. Mr. Malchuk holds a Civil Industrial Engineer degree from Universidad de Chile and an MBA from University of California at Los Angeles (UCLA) Anderson School of Management. Jacques Perron Jacques Perron is a director of Franco-Nevada. Mr. Perron has over 40 years of experience in the mining industry and has extensive technical and operations experience. He currently serves as a director of Torex Gold Resources Inc., and as director and Chair of Arizona Metals Corp. Previously, Mr. Perron was a director of Centerra Gold Inc., President and Chief Executive Officer at a number of mining companies including Pretium Resources Inc., Thompson Creek Metals Company Inc. and St Andrew Goldfields Ltd. and prior thereto held senior executive roles at a number of other mining companies. Mr. Perron is also the Chair of the Canadian Mineral Industry Education Foundation. Mr. Perron has a Bachelor of Science degree in Mining Engineering from l’École Polytechnique de Montréal. TSX / NYSE: FNV Franco-Nevada Corporation ★ 139 138 ★ Franco-Nevada Corporation TSX / NYSE: FNV Additional Information Additional Information
E X E C U T I V E S C O R P O R A T E O R G A N I Z A T I O N Paul Brink, President & CEO Paul Brink is President & Chief Executive Officer and a director of Franco-Nevada. Prior to his appointment as CEO, Mr. Brink served as President & Chief Operating Officer of Franco-Nevada from May 2018 to May 2020. He has been with Franco-Nevada since its initial public offering in 2007 and successfully led its business development activities as SVP, Business Development from 2008 until his promotion to President & Chief Operating Officer in 2018. Mr. Brink is active with a number of not-for-profit organizations. He previously had roles in corporate development at Newmont, investment banking at BMO Nesbitt Burns and project financing at UBS. Mr. Brink holds a Bachelor’s degree in Mechanical Engineering from the University of Witwatersrand and a Master’s degree in Management Studies from Oxford University. Sandip Rana, Chief Financial Officer Sandip Rana, Chief Financial Officer, joined Franco-Nevada in April 2010. He previously served in treasurer and controller roles at old Franco-Nevada until 2002 and then acted as an international controller for Newmont. From 2003 to April 2010, Mr. Rana held financial roles at Four Seasons Hotels Limited where he last served as Vice-President Corporate Finance. Mr. Rana holds a Bachelor of Business Administration degree from the Schulich School of Business and is a Chartered Professional Accountant, CA. In February 2019, Mr. Rana was recognized as a Top Gun CFO by Brendan Wood International. Lloyd Hong, Chief Legal Officer & Corporate Secretary Lloyd Hong, Chief Legal Officer & Corporate Secretary, joined Franco-Nevada in December 2012. He previously was the Senior Vice-President, Legal Counsel and Assistant Secretary of Uranium One Inc. Prior to that, he was a partner with the Canadian law firm of Davis LLP (now DLA Piper (Canada) LLP) with a practice focused on corporate finance and mergers and acquisitions. Mr. Hong holds a Bachelor of Commerce degree from the University of Alberta and a Bachelor of Laws degree from Queen’s University. Mr. Hong is a member of The Law Society of Ontario and The Law Society of British Columbia (non-practising). Eaun Gray, Chief Investment Officer Eaun Gray, Chief Investment Officer, heads Franco-Nevada’s business development group. Mr. Gray was previously a Vice President at Rothschild & Co where he advised on mergers and acquisitions and debt and stream transactions. Prior to that, Mr. Gray worked for CIBC in investment and corporate banking. Mr. Gray completed a Master of Business Administration degree at the Tuck School at Dartmouth College (Edward Tuck Scholar), is a CFA Charterholder and received a Bachelor of Commerce from Queen’s University (First Class Honours). Franco-Nevada Corporation (Canada) FN Holdings ULC (Alberta) Franco-Nevada GLW Holdings Corp. (British Columbia) Franco-Nevada International Corporation (Barbados) Franco-Nevada Australia Pty Ltd (Australia) Franco-Nevada U.S. Corporation (Delaware) Franco-Nevada Delaware LLC (Delaware) 100% 100% 100% 100% 100% 100% The chart below depicts certain subsidiaries of Franco-Nevada including those subsidiaries in jurisdictions in which Franco-Nevada maintains an office that are wholly-owned by Franco-Nevada either directly or indirectly and are existing under the laws of the jurisdictions set out therein. As of December 31, 2025, Franco-Nevada International Corporation (formerly Franco-Nevada (Barbados) Corporation) is Franco-Nevada’s only subsidiary with assets and revenue greater than 10% of the consolidated assets and revenue of the Company. Intermediate holding companies have been omitted. TSX / NYSE: FNV Franco-Nevada Corporation ★ 141 140 ★ Franco-Nevada Corporation TSX / NYSE: FNV Additional Information Additional Information
N O N - G A A P F I N A N C I A L M E A S U R E S Adjusted EBITDA and Adjusted EBITDA per Share Adjusted EBITDA and Adjusted EBITDA per share are non-GAAP financial measures, which is defined by Franco-Nevada by excluding the following from net income (loss) and earnings (loss) per share (“EPS”): • Income tax expense/recovery; • Finance expenses; • Finance income; • Depletion and depreciation; • Impairment losses and reversals related to royalty, stream and working interests; • Gains/losses on disposal of royalty, stream and working interests; • Impairment losses and expected credit losses related to investments, loans receivable and other financial instruments; • Changes in fair value of investments, loans receivable and other financial instruments; and • Foreign exchange gains/losses and other income/expenses. Management uses Adjusted EBITDA and Adjusted EBITDA per share to evaluate the underlying operating performance of Franco-Nevada as a whole for the reporting periods presented, to assist with the planning and forecasting of future operating results, and to supplement information in its financial statements. Management believes that in addition to measures prepared in accordance with IFRS Accounting Standards such as net income and EPS, our investors and analysts use Adjusted EBITDA and Adjusted EBITDA per share to evaluate the results of the underlying business of Franco-Nevada and its ability to generate liquidity by producing operating cash flow to fund working capital needs, service debt obligations and fund acquisitions. While the adjustments to net income and EPS in these measures include items that are both recurring and non-recurring, management believes that Adjusted EBITDA and Adjusted EBITDA per share are useful measures of Franco-Nevada’s performance because they adjust for items which may not relate to or have a disproportionate effect on the period in which they are recognized, impact the comparability of our core operating results from period to period, are not always reflective of the underlying operating performance of our business and/or are not necessarily indicative of future operating results. Adjusted EBITDA and Adjusted EBITDA per share are only intended to provide additional information to investors and analysts and should not be considered in isolation or as a substitute for measures of performance prepared in accordance with IFRS Accounting Standards. They do not have any standardized meaning under IFRS Accounting Standards and may not be comparable to similar measures presented by other issuers. Adjusted EBITDA Margin Adjusted EBITDA Margin is a non-GAAP ratio which is defined by Franco-Nevada as Adjusted EBITDA divided by revenue. Franco-Nevada uses Adjusted EBITDA Margin in its annual incentive compensation process to evaluate management’s performance in increasing revenue and containing costs. Management believes that in addition to measures prepared in accordance with IFRS Accounting Standards, our investors and analysts use Adjusted EBITDA Margin to evaluate the Company’s ability to contain costs relative to revenue. Adjusted EBITDA Margin is intended to provide additional information to investors and analysts and should not be considered in isolation or as a substitute for measures of performance prepared in accordance with IFRS Accounting Standards. It does not have any standardized meaning under IFRS Accounting Standards and may not be comparable to similar measures presented by other issuers. Reconciliation of Net Income to Adjusted EBITDA: (expressed in millions, except per share amounts) For the year ended December 31, 2025 2024 Net (loss) income $ 1,112.1 $ 552.1 Income tax expense 303.9 211.8 Finance expenses 3.1 2.6 Finance income (28.2) (60.6) Depletion and depreciation 306.7 225.3 Impairment losses (4.8) – Gain on sale of royalty interest – (0.3) Foreign exchange gain and other income (36.7) 20.7 Adjusted EBITDA $ 1,656.1 $ 951.6 Basic weighted average shares outstanding 192.7 192.4 Basic (loss) earnings per share $ 5.77 $ 2.87 Income tax expense 1.58 1.10 Finance expenses 0.02 0.01 Finance income (0.16) (0.31) Depletion and depreciation 1.59 1.17 Impairment losses (0.02) – Gain on sale of royalty interest – – Foreign exchange gain and other (income) expenses (0.19) 0.11 Adjusted EBITDA per share $ 8.59 $ 4.95 Adjusted Net Income and Adjusted Net Income per Share Adjusted Net Income and Adjusted Net Income per share are non-GAAP financial measures, which is defined by Franco-Nevada by excluding the following from net income and EPS: • Foreign exchange gains/losses and other income/expenses; • Impairment losses and reversals related to royalty, stream and working interests; • Gains/losses on disposal of royalty, stream and working interests; • Impairment losses and expected credit losses related to investments, loans receivable and other financial instruments; • Changes in fair value of investments, loans receivable and other financial instruments; • Impact of income taxes on these items; • Income taxes related to the reassessment of the probability of realization of previously recognized or de-recognized deferred income tax assets; and • Income taxes relating to the revaluation of deferred income tax assets and liabilities as a result of statutory income tax rate changes in the countries in which the Company operates. Management uses Adjusted Net Income and Adjusted Net Income per share to evaluate the underlying operating performance of Franco-Nevada as a whole for the reporting periods presented, to assist with the planning and forecasting of future operating results, and to supplement information in its financial statements. Management believes that, in addition to measures prepared in accordance with IFRS Accounting Standards such as net income and EPS, our investors and analysts use Adjusted Net Income and Adjusted Net Income per share to evaluate the results of the underlying business of Franco-Nevada, particularly since the items that are adjusted for are typically not included in our guidance. While the adjustments to net income and EPS in these measures include items that are both recurring and non-recurring, management believes that Adjusted Net Income and Adjusted Net Income per share are useful measures of Franco-Nevada’s performance because they adjust for items which may not relate to or have a disproportionate effect on the period in which they are recognized, impact the comparability of our core operating results from period to period, are not always reflective of the underlying operating performance of our business and/or are not necessarily indicative of future operating results. Adjusted Net Income and Adjusted Net Income per share are intended to provide additional information to investors and analysts and should not be considered in isolation or as a substitute for measures of performance prepared in accordance with IFRS Accounting Standards. They do not have any standardized meaning under IFRS Accounting Standards and may not be comparable to similar measures presented by other issuers. Adjusted Net Income Margin Adjusted Net Income Margin is a non-GAAP ratio which is defined by Franco-Nevada as Adjusted Net Income divided by revenue. Franco-Nevada uses Adjusted Net Income Margin in its annual incentive compensation process to evaluate management’s performance in increasing revenue and containing costs. Management believes that in addition to measures prepared in accordance with IFRS Accounting Standards, our investors and analysts use Adjusted Net Income Margin to evaluate the Company’s ability to contain costs relative to revenue. Adjusted Net Income Margin is intended to provide additional information to investors and analysts and should not be considered in isolation or as a substitute for measures of performance prepared in accordance with IFRS Accounting Standards. It does not have any standardized meaning under IFRS Accounting Standards and may not be comparable to similar measures presented by other issuers. Reconciliation of Net Income to Adjusted Net Income: (expressed in millions, except per share amounts) For the year ended December 31, 2025 2024 Net income (loss) $ 1,112.1 $ 552.1 Impairment losses (4.8) – Gain on disposal of royalty interests – (0.3) Foreign exchange loss (gain) and other (income) expenses (36.7) 20.7 Tax effect of adjustments 4.6 (2.4) Other tax related adjustments Deferred tax expense related to the remeasurement of deferred tax liability due to changes in Barbados tax rate – 49.1 Change in unrecognized deferred income tax assets – (1.1) Adjusted Net Income $ 1,075.2 $ 618.1 Basic weighted average shares outstanding 192.7 192.4 Basic earnings (loss) per share $ 5.77 $ 2.87 Impairment losses (0.02) – Gain on disposal of royalty interests – – Foreign exchange loss (gain) and other expenses (income) (0.19) 0.11 Tax effect of adjustments 0.02 (0.01) Other tax related adjustments Deferred tax expense related to the remeasurement of deferred tax liability due to changes in Barbados tax rate – 0.26 Change in unrecognized deferred income tax assets – (0.02) Adjusted Net Income per share $ 5.58 $ 3.56 Calculation of Adjusted EBITDA Margin: (expressed in millions, except Adjusted EBITDA Margin) For the year ended December 31, 2025 2024 Adjusted EBITDA $ 1,656.1 $ 951.6 Revenue 1,822.8 1,113.6 Adjusted EBITDA Margin 90.9 % 85.5 % TSX / NYSE: FNV Franco-Nevada Corporation ★ 143 142 ★ Franco-Nevada Corporation TSX / NYSE: FNV Additional Information Additional Information
T E C H N I C A L A N D T H I R D - P A R T Y I N F O R M A T I O N Except where otherwise stated, the disclosure in this Asset Handbook relating to properties and operations on the properties in which Franco-Nevada holds royalty, stream or other interests is based on information publicly disclosed by the owners or operators of these properties and information/data available in the public domain as at March 12, 2026, and none of this information has been independently verified by Franco-Nevada. Specifically, as a royalty or stream holder, Franco-Nevada has limited, if any, access to properties included in its asset portfolio. Additionally, Franco-Nevada may from time to time receive operating information from the owners and operators of the properties, which it is not permitted to disclose to the public. Franco-Nevada is dependent on the operators of the properties and their qualified persons to provide information to Franco-Nevada or on publicly available information to prepare disclosure pertaining to properties and operations on the properties on which Franco-Nevada holds royalty, stream or other interests and generally has limited or no ability to independently verify such information. Although Franco-Nevada does not have any knowledge that such information may not be accurate, there can be no assurance that such third-party information is complete or accurate. Some information publicly reported by operators may relate to a larger property than the area covered by Franco-Nevada’s royalty, stream or other interest. Franco-Nevada’s royalty, stream or other interests often cover less than 100% and sometimes only a portion of the publicly reported mineral resources, mineral reserves and production of a property. Except where otherwise noted, the disclosure in this Asset Handbook relating to mineral resources and mineral reserves statements for individual properties is made as at December 31, 2025. Reconciliation to CIM Definitions In this Asset Handbook, Franco-Nevada has disclosed a number of Mineral Resource and Mineral Reserve estimates covering properties related to mining assets that are not based on Canadian Institute of Mining, Metallurgy and Petroleum definitions (“CIM”), but have instead been prepared in reliance upon other comparable international reporting codes, including JORC (Australia), SAMREC (South Africa) and Regulation S-K 1300 (collectively, the “Acceptable Foreign Codes”). Similar to the CIM, reporting standards adopted by these Acceptable Foreign Codes are all compliant with the international Mineral Resource and Mineral Reserve Guidelines defined by the Committee for Mineral Reserves International Reporting Standards (“CRIRSCO”). In each case, the Mineral Resources and Mineral Reserves reported in this Asset Handbook are based on estimates previously disclosed by the relevant property owner or operator, without reference to the underlying data used to calculate the estimates. Accordingly, Franco-Nevada is unable to reconcile the Mineral Resource and Mineral Reserve estimates prepared in reliance with the Acceptable Foreign Codes with that of CIM. Franco-Nevada sought confirmation from one of its technical advisory firms, that is comprised of engineers experienced in the preparation of Mineral Resource and Mineral Reserve estimates using CIM and each of the Acceptable Foreign Codes, of the extent to which an estimate prepared under an Acceptable Foreign Code would differ from that prepared under CIM. Franco-Nevada was advised that CIM are largely comparable to those of the Acceptable Foreign Codes and that the Mineral Resource and Mineral Reserve definitions and categories are similar to CIM as adopted in NI 43-101 and will typically result in reporting of substantially similar Mineral Resource and Mineral Reserve estimates. Such advisors further confirmed, without reference to the procedures in which the estimates prepared using Acceptable Foreign Codes that are reproduced in this Asset Handbook were conducted, that in the course of their preparation of a Mineral Resource or Mineral Reserve estimate they would effectively apply similar procedures to prepare and report the Mineral Resource or Mineral Reserve estimate regardless of the reliance on CIM or any of the Acceptable Foreign Codes. Mineral Resource and Mineral Reserve Estimates This Asset Handbook has been prepared in accordance with the requirements of Canadian securities laws in effect in Canada, which differ from the requirements of U.S. securities laws. Unless otherwise indicated, all mineral resource and mineral reserve estimates included in this Asset Handbook have been prepared by the owners or operators of the relevant properties (as and to the extent indicated by them) in accordance with National Instrument 43-101 — Standards of Disclosure for Mineral Projects (“NI 43-101”) and the Canadian Institute of Mining, Metallurgy and Petroleum Definition Standards (“CIM Definition Standards”). NI 43-101 is a rule developed by the Canadian securities regulatory authorities which establishes standards for all public disclosure an issuer makes of scientific and technical information concerning mineral projects. NI 43-101 permits a historical estimate made prior to the adoption of NI 43-101 that does not comply with NI 43-101 to be disclosed using the historical terminology if, among other things, the disclosure: (a) identifies the source and date of the historical estimate; (b) comments on the relevance and reliability of the historical estimate; (c) states whether the historical estimate uses categories other than those prescribed by NI 43-101; and (d) includes any more recent estimates or data available. Mining disclosure under U.S. securities law was previously required to comply with SEC Industry Guide 7 (“SEC Industry Guide 7”) under the United States Securities Exchange Act of 1934, as amended. The SEC has adopted rules to replace SEC Industry Guide 7 with new mining disclosure rules under sub-parts 1300 and 1301 of Regulation S-K of the United States Securities Act of 1933 (“Regulation S-K 1300”) which became mandatory for U.S. reporting companies beginning with the first fiscal year commencing on or after January 1, 2021. Under Regulation S-K 1300, the SEC now recognizes estimates of “Measured Mineral Resources”, “Indicated Mineral Resources” and “Inferred Mineral Resources”. In addition, the SEC has amended its definitions of “Proven Mineral Reserves” and “Probable Mineral Reserves” to be substantially similar to international standards. Readers are cautioned that despite efforts to harmonize U.S. mining disclosure rules with NI 43-101 and other international requirements, there are differences between the terms and definitions used in Regulation S-K 1300 and mining terms defined in the Canadian Institute of Mining, Metallurgy and Petroleum Standards, which definitions have been adopted by NI 43 - 101, and there is no assurance that any mineral resources or mineral reserves that an owner or operator may report as “measured mineral resources”, “indicated mineral resources”, “inferred mineral resources”, “proven mineral reserves” and “probable mineral reserves” under NI 43-101 would be the same had the owner or operator prepared the mineral resource or mineral reserve estimates under the standards of Regulation S-K 1300. In addition to NI 43-101 and S-K 1300, a number of mineral resource and mineral reserve estimates have been prepared in accordance with the JORC Code or the SAMREC Code each of which constitutes an “acceptable foreign code” for purposes of NI 43-101, which differ from the requirements of NI 43-101 and U.S. securities laws. Accordingly, information containing descriptions of the Corporation’s mineral properties set forth herein may not be comparable to similar information made public by U.S. companies subject to the reporting and disclosure requirements under U.S. federal securities laws and the rules and regulations thereunder. For more information, see “Reconciliation to CIM Definitions”. Darrol van Deventer, P . Eng., Vice President, Mining of Franco-Nevada is the qualified person that approved the scientific or technical information contained in this Asset Handbook related to mineral projects that are material (for purposes of NI 43-101) to Franco-Nevada. F O R W A R D - L O O K I N G I N F O R M A T I O N This Asset Handbook contains “forward-looking information” and “forward-looking statements” within the meaning of applicable Canadian securities laws and the United States Private Securities Litigation Reform Act of 1995, respectively, which may include, but are not limited to, statements with respect to future events or future performance, management’s expectations regarding Franco-Nevada’s growth, results of operations, estimated future revenues, performance guidance, carrying value of assets, future dividends and requirements for additional capital, Mineral Resource and Mineral Reserve estimates, production estimates, production costs and revenue, future demand for and prices of commodities, expected mining sequences, business prospects and opportunities, the performance and plans of third party operators, any ongoing or future audits being conducted by the Canada Revenue Agency (the “CRA”), the expected exposure for current and future tax assessments and available remedies, and statements with respect to the future status and any potential restart of the Cobre Panamá mine and related arbitration proceedings. In addition, statements relating to Mineral Resources and Mineral Reserves, gold equivalent ounces or mine lives are forward-looking statements, as they involve implied assessment, based on certain estimates and assumptions, and no assurance can be given that the estimates and assumptions are accurate and that such Mineral Resources and Mineral Reserves, GEOs or mine lives will be realized. Such forward-looking statements reflect management’s current beliefs and are based on information currently available to management. Often, but not always, forward-looking statements can be identified by the use of words such as “plans”, “expects”, “is expected”, “budgets”, “potential for”, “scheduled”, “estimates”, “forecasts”, “predicts”, “projects”, “intends”, “targets”, “aims”, “anticipates” or “believes” or variations (including negative variations) of such words and phrases or may be identified by statements to the effect that certain actions “may”, “could”, “should”, “would”, “might” or “will” be taken, occur or be achieved. Forward-looking statements involve known and unknown risks, uncertainties and other factors, which may cause the actual results, performance or achievements of Franco-Nevada to be materially different from any future results, performance or achievements expressed or implied by the forward-looking statements. A number of factors could cause actual events or results to differ materially from any forward-looking statement, including, without limitation: fluctuations in the prices of the primary commodities that drive royalty and stream revenue (gold, platinum group metals, copper, nickel, silver, iron ore and oil and gas); fluctuations in the value of the Canadian and Australian dollar, Brazilian Real, Mexican peso, and any other currency in which revenue is generated, relative to the U.S. dollar; changes in national and local government legislation, including permitting and licensing regimes and taxation policies and the enforcement thereof; proposed tariff and other trade measures that may be imposed by the United States and proposed retaliatory measures that may be adopted by its trading partners; the adoption and implementation of a global minimum tax on corporations; regulatory, political or economic developments in any of the countries where properties in which Franco-Nevada holds a royalty, stream or other interest are located or through which they are held; risks related to the operators of the properties in which Franco-Nevada holds a royalty, stream or other interest, including changes in the ownership and control of such operators; relinquishment or sale of mineral properties; influence of macroeconomic developments; business opportunities that become available to, or are pursued by Franco-Nevada; reduced access to debt and equity capital; litigation; title, permit or license disputes related to interests on any of the properties in which Franco-Nevada holds a royalty, stream or other interest; whether or not the Company is determined to have “passive foreign investment company” (“PFIC”) status as defined in Section 1297 of the United States Internal Revenue Code of 1986, as amended; potential changes in Canadian tax treatment of offshore streams; excessive cost escalation as well as development, permitting, infrastructure, operating or technical difficulties on any of the properties in which Franco-Nevada holds a royalty, stream or other interest; access to sufficient pipeline capacity; actual mineral content may differ from the Mineral Resources and Mineral Reserves contained in technical reports; rate and timing of production differences from Mineral Resource estimates, other technical reports and mine plans; risks and hazards associated with the business of development and mining on any of the properties in which Franco-Nevada holds a royalty, stream or other interest, including, but not limited to unusual or unexpected geological and metallurgical conditions, slope failures or cave-ins, sinkholes, flooding and other natural disasters, terrorism, civil unrest or an outbreak of contagious disease; the impact of future pandemics; and the integration of acquired assets. The forward-looking statements contained herein are based upon assumptions management believes to be reasonable, including, without limitation: the ongoing operation of the properties in which Franco-Nevada holds a royalty, stream or other interest by the owners or operators of such properties in a manner consistent with past practice; the accuracy of public statements and disclosures made by the owners or operators of such underlying properties; no material adverse change in the market price of the commodities that underlie the asset portfolio; the Company’s ongoing income and assets relating to determination of its PFIC status; no material changes to existing tax treatment; the expected application of tax laws and regulations by taxation authorities; the expected assessment and outcome of any audit by any taxation authority; no adverse development in respect of any significant property in which Franco-Nevada holds a royalty, stream or other interest; the accuracy of publicly disclosed expectations for the development of underlying properties that are not yet in production; integration of acquired assets; and the absence of any other factors that could cause actions, events or results to differ from those anticipated, estimated or intended. However, there can be no assurance that forward-looking statements will prove to be accurate, as actual results and future events could differ materially from those anticipated in such statements. Investors are cautioned that forward-looking statements are not guarantees of future performance. In addition, there can be no assurance as to (i) the outcome of any ongoing or future audit by the CRA or the Company’s exposure as a result thereof, or (ii) the future status and any potential restart of the Cobre Panamá mine or the outcome of any related arbitration proceedings. Franco-Nevada cannot assure investors that actual results will be consistent with these forward- looking statements. Accordingly, investors should not place undue reliance on forward-looking statements due to the inherent uncertainty therein. For additional information with respect to risks, uncertainties and assumptions, please refer to Franco-Nevada’s most recent Annual Information Form as well as our most recent Management’s Discussion and Analysis filed with the Canadian securities regulatory authorities on www.sedarplus.com and Franco-Nevada’s most recent Annual Report filed on Form 40-F filed with the SEC on www.sec.gov. The forward-looking statements herein are made as at March 12, 2026 (except where stated otherwise) and Franco-Nevada does not assume any obligation to update or revise them to reflect new information, estimates or opinions, future events or results or otherwise, except as required by applicable law. TSX / NYSE: FNV Franco-Nevada Corporation ★ 145 144 ★ Franco-Nevada Corporation TSX / NYSE: FNV Additional Information Additional Information
“ Oil and Gas Interests ” means the royalty interests, working interests and oil and natural as mineral rights in oil and natural gas properties owned by Franco- Nevada. “ open pit ” is a surface working open to daylight, such as a quarry. “ ore ” means a natural aggregate of one or more minerals which may be mined and sold at a profit, or from which some part may be profitably separated. “ ORR ” means Overriding Royalty: A percentage share of production, which is free of all costs of drilling and producing, and is created by the lessee or working interest owner and paid by the lessee or working interest owner. “ oz ” represents ounce (troy). 1 troy ounce = 1.097 avoirdupois ounce. “ oz/ton ” represents troy ounces per short ton. “ P&P ” means Proven and Probable. “ Pb ” means the chemical symbol for the element lead. “ Pd ” means the chemical symbol for the element palladium. “ PGM ” means the platinum group of metals, including but not limited to Palladium, Platinum, Rhodium, Osmium, and Rhenium. “ porphyry ” is an igneous rock of any composition that contains conspicuous, large mineral grains (phenocrysts) in a fine-grained matrix. “ ppm ” means parts per million. “ preliminary feasibility study” or “PFS” means a comprehensive study of the viability of a mineral project that has advanced to a stage where the mining method, in the case of underground mining, or the pit configuration, in the case of an open pit, has been established and an effective method of mineral processing has been determined, and includes a financial analysis based on reasonable assumptions of technical, engineering, legal, operating, economic, social, and environmental factors and the evaluation of other relevant factors which are sufficient for a qualified person, acting reasonably, to determine if all or part of the mineral resource may be classified as a mineral reserve. “ Probable Reserve ” in respect of Mineral Reserves has the meaning ascribed to the term “ Probable Mineral Reserve ” pursuant to CIM Definitions. “ Proven Reserve ” in respect of Mineral Reserves has the meaning ascribed to the term “ Proven Mineral Reserve ” pursuant to CIM Definitions. “ Pt ” means the chemical symbol for the element platinum. “ Qualified Person ” for the purposes of NI 43-101, is an individual who is an engineer or geoscientist with at least five years of experience in mineral exploration, mine development or operation or mineral project assessment, or any combination of these; and has experience relevant to the subject matter of the mineral project; and who is a member in good standing of a recognized self-regulatory organization of engineers or geoscientists. “ WI ” means Working Interest. Holders of working interests have an ownership position in the property and operation and hence are liable for cash calls on their share of capital, operating and environmental costs usually in proportion to their ownership percentage. Working interests are not considered to be royalties because of their ongoing funding requirements although, for profitable operations, they can be economically similar in their calculations to NPIs. “ Zn ” means the chemical symbol for the element zinc. “ Reserves ” means collectively, in respect of Mineral Reserves, Probable Reserves and Proven Reserves. “ Resources ” means a concentration or occurrence of diamonds, natural solid inorganic material, or natural solid fossilized organic material including base and precious metals, coal, and industrial minerals in or on the earth’s crust in such form and quantity and of such a grade or quality that it has reasonable prospects for economic extraction. “ Revenue-based Royalties ” are based on the value of the production or net proceeds received by the operator with defined deductions as specified by the royalty contract. Some forms of revenue-based royalties in the mining and energy industries are: “NSR” Net Smelter Return Royalty; “ORR” Overriding Royalty; “GR” Gross Royalty; and “FH” Freehold or Lessor Royalty. “ run-of-mine ore ” means mined ore which has not been subjected to any pre-treatment, such as washing, sorting or crushing prior to metallurgical processing. “ SAMREC ” means the South African Code for Reporting of Mineral Resources and Mineral Reserves prepared by the South African Mineral Committee under the auspices of the South African Institute of Mining and Metallurgy, as amended. “ smelting ” is an intermediate stage metallurgical process in which metal is separated from impurities by using thermal or chemical separation techniques. “ stope ” means an excavation in an underground mine from which ore is being or has been extracted. “ Streams ” are metal purchase agreements that allow the holder of the agreement to purchase all or a portion of the gold, silver or other products from a mine in exchange for an upfront payment and an additional payment on each delivery. Streams are not royalties because they are not an interest in land and there is an ongoing cash payment required to purchase the physical metal. “ strike ” means the trend or direction of the intersection of a dipping a layer of rock, fault, vein or other geologic feature with a horizontal surface. “ tailings ” means material rejected after recoverable valuable minerals have been extracted from the ore or concentrate. “ ton ” is 2,000 pounds. Syn: short ton. “ tonne ” means 1,000 kilograms. “ tpa ” means tonnes per annum. “ tpd ” means tonnes per day. “ vein ” means an epigenetic mineral filling of a fault or other fracture, in tabular or sheet-like form, often with associated replacement of the host rock; a mineral deposit of this form and origin. “ waste ” is rock which is not ore and usually has to be removed during the normal course of mining to get at the ore. G L O S S A R Y “ A$ ” means Australian dollars. “ Adjusted EBITDA ” and “ Adjusted EBITDA per share ” are non-IFRS measures, which exclude the following from net income and earnings per share: income tax expense/recovery; finance expenses and finance income; depletion and depreciation; non-cash costs of sales; impairment charges related to royalty, stream and working interests and investments; gains/losses on the sale of royalty, stream and working interests and investments; foreign exchange gains/losses and other income/expenses; and unusual non-recurring items. For additional information and a reconciliation of these measures to various IFRS measures, refer to the Company’s MD&A. “ Adjusted Net Income ” and “ Adjusted Net Income per share ” are non-IFRS financial measures, which exclude the following from net income and earnings per share: impairment charges related to royalty, stream and working interests and investments; gains/losses on the sale of royalty, stream and working interests and investments; foreign exchange gains/losses and other income/expenses; unusual non-recurring items; and the impact of income taxes on these items. For additional information and a reconciliation of these measures to various IFRS measures, refer to the Company’s MD&A. “ Ag ” means the chemical symbol for the element silver. “ AMR ” means Advanced Minimum Royalty and is rent paid to the royalty holder prior to the payment of royalties on production. Once production begins, the AMR payments are then credited in full against stream of production royalty payments. “ AOI ” means area of interest. “ Au ” means the chemical symbol for the element gold. “ bbl ” means barrel. “ Bbls/d ” means barrels per day. “ Bcf ” means billion cubic feet. “ Boe ” means barrels of oil equivalent. “ Boe/d ” means barrels of oil equivalent per day. “ CAGR ” means Compounded Annual Growth Rate. “ CIM ” means the Canadian Institute of Mining, Metallurgy and Petroleum. “ CIM Definitions ” means CIM Definition Standards for Mineral Resources and Mineral Reserves and CIM Estimation of Mineral Resources and Mineral Reserves Best Practice Guidelines. “ concentrate ” is the product of physical concentration process, such as flotation or gravity concentration, which involves separating ore minerals from unwanted waste rock. Concentrates require subsequent processing (such as smelting or leaching) to break down or dissolve the ore minerals and obtain the desired elements, usually metals. “ Cu ” means the chemical symbol for the element copper. “ cut-off grade ” means the lowest grade of Mineral Resource considered economic; used in the calculation of Mineral Resources and Mineral Reserves in a given deposit. “ diamond drill ” is a type of drill in which the rock cutting is done by abrasion, with a diamond impregnated bit, rather than by percussion. The drill cuts a core of rock which is recovered in long cylindrical sections. “ Inf. ” means Inferred. “ Inferred Resources ” has the meaning ascribed to the term “ Inferred Mineral Resource ” pursuant to CIM Definitions. “ JORC ” means the Australasian Code for Reporting of Mineral Resources and Mineral Reserves prepared by the Joint Ore Reserves Committee of the Australasian Institute of Mining and Metallurgy, Australian Institute of Geoscientists and Mineral Council of Australia, as amended. “ kg ” represents kilogram. “ km ” represents kilometre. “ km 2 ” represents square kilometre. “ koz ” means thousand ounces. “ kozpa ” means thousand ounces per annum. “ kt ” means thousand tonnes. “ ktpd ” means thousand tonnes per day. “ lb ” represents pound. “ LOM ” means life of mine. “ m ” means metres. “ M&I ” means Measured and Indicated. “ Mbbls/mbbls ” means thousand barrels. “ Mboe/mboe ” means thousand barrels of oil equivalent. “ Mcf/mcf ” means thousand cubic feet. “ Measured Resources ” has the meaning ascribed to the term “Measured Mineral Resource” pursuant to CIM Definitions. “ mineralization ” usually implies minerals of value occurring in rocks. “ Mineral Royalties ” means the royalty interests in precious and base metal properties and certain equity interests owned by Franco-Nevada. “ Mlbs ” means millions of pounds. “ MMbbl ” means million barrels of oil. “ MMcf/mmcf ” means million cubic feet. “ MMcf/d or mmcf/d ” means million cubic feet per day. “ Mo ” means the chemical symbol for the element molybdenum. “ Moz ” means million ounces. “ Mtpa ” means million tonnes per annum. Mtpd ” means million tonnes per day. “ NGLs ” means Natural Gas Liquids. “ NI 43-101 ” means National Instrument 43-101 – Standards of Disclosure for Mineral Projects of the Canadian Securities Administrators. “ Ni ” means the chemical symbol for the element nickel. “ NPI ” means Net Profit Interest: the profits after deduction of expenses. “ NPR ” means Net Proceeds Royalties: which is a royalty on the profits after deduction of expenses. “ NRI ” means Net Royalty Interest: paid net of operating and capital costs (similar to an NPI). “ NSR ” means Net Smelter Return: Which is the proceeds returned from the smelter and/or refinery to the mine owner less certain costs. Syn: “ core drill ”. “ dip ” is the angle between a horizontal plane and an inclined surface such as a rock formation, fault or vein. “ drift ” is a horizontal passage underground that follows along the length of a vein of rock formation. “ EIS ” means environmental impact statement. “ eq ” or “ Eq ” means equivalent. “ fault ” means a fracture in a rock where there has been displacement of the two sides. “ Fe ” means the chemical symbol for the element iron. “ feasibility study ” means a comprehensive study of a mineral deposit in which all geological, engineering, legal, operation, economic, social, environmental and other relevant factors are considered in sufficient detail that it could reasonably serve as a basis by a financial institution to finance the development of a deposit for mineral production. “ FH ” means Freehold or Lessor Royalty. “ flotation ” is a process by which mineral particles are induced to become attached to bubbles and float, in an ore and water slurry, so that the valuable minerals are concentrated at the slurry surface and separated from the worthless gangue. “ fracture ” means breaks in a rock, usually due to intensive folding or faulting. “ Franco-Nevada ” means Franco-Nevada Corporation and is also referred to as “ Franco ”, “ FNV ”, “ the Company ”, “ Corporation ”, “ management ”, “ we ”, or “ our ” in this Asset Handbook. “ Freehold ” means an interest in real property. “ g ” represents grams. “ g/t ” means grams per tonne. “ GR ” means Gross Royalty and is a royalty based on all revenues in cash or in-kind products received by the operator for the sale of product. “ grade ” means the concentration of each ore metal in a rock sample, usually given as weight percent. Where extremely low concentrations are involved, the concentration may be given in grams per tonne (g/t) or oz per ton (oz/t). “ GMR ” means Gross Margin Royalty, which is a royalty on the revenues after deduction of cash operating costs. Non-deductible costs generally include: capital costs (both development and sustaining), exploration, depreciation and other non-cash production costs. “ Guide 7 ” means the mining industry guide entitled “Description of Property by Issuers Engaged or to be Engaged in Significant Mining Operations” contained in the Securities Act Industry Guides published by the United States Securities and Exchange Commission, as amended. “ ha ” means hectares; 10,000 square metres. “ heap leaching process ” is the process of extracting gold and silver by placing broken ore on an impermeable pad and applying a diluted cyanide solution that dissolves a portion of the contained gold and silver, which are then recovered in metallurgical processes. “ Indicated Resources ” has the meaning ascribed to the term “Indicated Mineral Resource” pursuant to CIM Definitions. TSX / NYSE: FNV Franco-Nevada Corporation ★ 147 146 ★ Franco-Nevada Corporation TSX / NYSE: FNV Additional Information Additional Information
C O R P O R A T E I N F O R M A T I O N Executive Management Paul Brink President & CEO Sandip Rana Chief Financial Officer Lloyd Hong Chief Legal Officer & Corporate Secretary Eaun Gray Chief Investment Officer Directors David Harquail¹ Chair of the Board Tom Albanese² Chair Designate Paul Brink President & CEO Hugo Dryland Derek Evans Dr. Catharine Farrow Maureen Jensen Jennifer Maki Daniel Malchuk Jacques Perron Chair Emeritus Pierre Lassonde Listings of Common Shares Toronto Stock Exchange: FNV New York Stock Exchange: FNV Share Capital As at March 31, 2026 Common shares outstanding: 192,855,530 Reserved for options and other: 632,470 Fully diluted: 193,488,000 Auditors PricewaterhouseCoopers LLP Toronto, Canada Transfer Agent Computershare Investor Services Inc. 320 Bay Street, 14th Floor Toronto, Ontario M5H 4A6 Canada Toll Free: (800) 564-6253 Tel: (514) 982-7555 service@computershare.com Investor Information info@franco-nevada.com www.franco-nevada.com Tel: (416) 306-6300 Toll Free: (877) 401-3833 Head Office Franco-Nevada Corporation 199 Bay Street, Suite 2000 P .O. Box 285 Commerce Court Postal Station Toronto, Ontario M5L 1G9 Canada Tel: (416) 306-6300 Barbados Office Franco-Nevada International Corporation Ground Floor, Balmoral Hall, Balmoral Gap, Hastings, Christ Church Barbados, BB14034 Tel: (246) 434-8200 U.S. Office Franco-Nevada U.S. Corporation 1745 Shea Center Drive, Suite 400 Highlands Ranch, Colorado 80129 United States Tel: (720) 344-4986 Australia Office Franco-Nevada Australia Pty Ltd 44 Kings Park Road, Suite 41 West Perth, Western Australia 6005 Australia Tel: 61-8-6263-4425 1 Mr. Harquail is not standing for re-election to the Board. The Board of Franco-Nevada intends to appoint Mr. Harquail as Chair Emertius following Franco-Nevada's annual meeting on May 12, 2026. 2 The Board of Franco-Nevada intends to appoint Mr. Albanese as the independent Chair of its Board of Directors following Franco-Nevada's annual meeting on May 12, 2026. TSX / NYSE: FNV 148 ★ Franco-Nevada Corporation Additional Information
F R A N C O - N E V A D A . C O M T S X / N Y S E : F N V
G O L D S T R I K E Producing Location: Nevada, United States | Operator: Nevada Gold Mines LLC | Precious Metals: Au | Royalty: NSR: 2–4% / NPI: 2.4–6% Franco-Nevada holds royalties covering the majority of the Nevada Gold Mines LLC (“Nevada Gold Mines”) Goldstrike complex. Carlin Trend 2025 2024 2023 M&I Resources (koz Au) 1,2 24,390 24,390 26,016 Inf. Resources (koz Au) 1,2 9,431 9,268 10,081 P&P Reserves (koz Au) 1,2 14,309 15,447 15,772 M&I Royalty Ounces (000s) 1,3 304 280 354 Inf. Royalty Ounces (000s) 3 118 106 137 P&P Royalty Ounces (000s) 3 179 177 215 1 Please refer to the tables on pages 126–134 for a breakout of grade and tonnages by Mineral Resource category for Carlin Trend; all M&I categories are inclusive of Mineral Reserves 2 Under the Nevada Gold Mines joint venture, Barrick now reports Goldstrike, Gold Quarry and South Arturo as part of the Carlin operation category. Mineral Resources and Mineral Reserves include Goldstrike, Gold Quarry and South Arturo as well as other properties where Franco-Nevada has no royalties or stream interests 3 For Royalty Ounce calculation, Franco-Nevada estimates 24% of the Carlin Trend Mineral Resources and Mineral Reserves (28% in 2024, 34% in 2023) are subject to our royalty interests on Goldstrike, Gold Quarry and South Arturo and estimates an average royalty rate of 5.2% is applicable (4.1% in 2024, 4.0% in 2023) Goldstrike 2025 2024 2023 Total NSR Revenue to FNV ($ million) $ 12.3 $ 8.6 $ 4.4 Total NPI Revenue to FNV ($ million) $ 10.5 $ 10.8 $ 8.7 Total Revenue to FNV ($ million) $ 22.8 $ 19.4 $ 13.1 M&I Resources (koz Au) 1 n/a n/a n/a Inf. Resources (koz Au) 1 n/a n/a n/a P&P Reserves (koz Au) 1 n/a n/a n/a M&I Royalty Ounces (000s) 2,3 n/a n/a n/a Inf. Royalty Ounces (000s) 3 n/a n/a n/a P&P Royalty Ounces (000s) 3 n/a n/a n/a 1 Please refer to the table above for the Carlin Trend Mineral Resources and Mineral Reserves which include Goldstrike 2 All M&I categories are inclusive of Mineral Reserves 3 Please refer to the table above for the Carlin Trend Royalty Ounce calculation which includes Goldstrike The Goldstrike complex is located on the Carlin Trend, about 60 km northwest of the town of Elko, Nevada and includes the open pit Betze-Post mine, as well as the underground operations of Meikle and Rodeo immediately to the north. Mining activity commenced on the property in 1976 and, since 1987, has been operated by Barrick. Franco-Nevada holds both NSR (2–4%) and NPI (2.4–6%) royalties at Goldstrike as well as royalties at Gold Quarry and South Arturo which cover over 50% of the reported Carlin Mineral Reserves. The Mineral Reserves estimated above include Goldstrike open pit stockpiles subject to both NSR and NPI royalties. The royalties vary depending on the claim blocks, operating costs and capital investments, as shown in the schematic. As a result, royalty payments can vary substantially on a quarterly basis. In 2019, Barrick (61.5%) and Newmont (38.5%) combined their significant assets across Nevada to create the Nevada Gold Mines joint venture. Under this joint venture, Goldstrike is reported as part of the Carlin operation category by Barrick. Barrick announced 2025 production of 687 koz of gold from its 61.5% share of Carlin interests. Nevada Gold Mines noted that Carlin gold production for 2025 was 11% lower compared to 2024 due to lower underground grades mined, more Cortez ore displacing lower grade Carlin stockpiles and less leach pad production due to sequencing of the Gold Quarry open pit. Barrick has reported 2026 production guidance of 600–670,000 gold ounces from its 61.5% share of Carlin. Franco-Nevada anticipates 2026 Goldstrike royalty payments to be similar to 2025 as royalties on the underground material are expected to offset less stockpile production. Weimer 4% NSR Goldstrike Open Pit Mine Goldstrike Underground Mine Meikle/Rodeo SPLC Lease 6% NPI Bazza 2% NSR Bazza Strip 2% NSR 2.4% NPI Royal 3% NSR Extension 5% NPI 4% NSR Corbett 2% NSR Pandora 2% NSR Rodeo Creek 4% NSR Above 4600’ Post 5% NPI 4% NSR SJ 6% NPI Gold Bug 5% NPI 4% NSR Goldstrike 5% NPI 4% NSR Goldstrike Pacific Ocean Oregon Idaho Utah Nevada California Arizona Mexico Goldstrike Open Pit Mine FNV Royalties Goldstrike Underground mine Goldstrike 2–4% NSR / 2.4–6% NPI mile 0 1 N Focus asset for NGM with substantial invested capital Profit royalties provide more leverage to gold prices Current operator mine life of 18 years Franco-Nevada Corporation ★ 77 TSX / NYSE: FNV United States
B A L D M O U N T A I N Producing Location: Nevada, United States | Operator: Kinross Gold Corporation | Precious Metals: Au | Royalty: NSR / GR: 0.875–5% The Bald Mountain mine lies within the Southern Ruby Mountains of northeastern Nevada along the southern extension of the prolific Carlin Trend, 110 km southeast of Elko. 2025 2024 2023 Revenue to Franco ‑ Nevada ($ million) $ 20.6 $ 16.8 $ 11.7 M&I Resources (koz Au) 1 3,773 3,856 4,175 Inf. Resources (koz Au) 1 790 571 489 P&P Reserves (koz Au) 1 1,225 1,173 489 M&I Royalty Ounces (000s) 1,2 112 119 157 Inf. Royalty Ounces (000s) 2 21 14 18 P&P Royalty Ounces (000s) 2 26 23 19 1 Please refer to the tables on pages 126–134 for a breakout of grade and tonnages by Mineral Resource category; all M&I categories are inclusive of Mineral Reserves 2 For Royalty Ounce calculation, Franco-Nevada estimates 100% of Mineral Reserves (100% in 2024, 100% in 2023) and 99% of Mineral Resources (inclusive of Mineral Reserves) (99% of Mineral Resources inclusive of Mineral Reserves in 2024, 99% in 2023 exclusive of Mineral Reserves) are subject to our royalty interest and estimates an average rate of 2.15% is applicable for Mineral Reserves (1.92% in 2024, 3.79% in 2023), 3.01% is applicable for M&I Mineral Resources (inclusive of Mineral Reserves) (2.53% in 2024, 3.79% in 2023 exclusive of Mineral Reserves) and 2.72% is applicable for Inf. Mineral Resources (2.53% in 2024, 3.79% in 2023) Ore is sourced from multiple open pits over an estimated 600 km 2 property with processing at multiple conventional heap leaching facilities. Bald Mountain is the largest private mining land package in the U.S. It stretches 40 km north to south and 15 km east to west and is divided in three zones: North Zone, South Zone and JV Zone. Franco-Nevada’s Bald Mountain royalties cover a significant portion of the Bald Mountain property. Royalty rates range from 0.875%–5% NSR/GR. A detailed map of the royalties is shown in the schematic. At the end of 2015, Kinross Gold Corporation (“Kinross”) purchased from Barrick 100% of the North and South Zones while forming a 50/50 exploration joint venture partnership with Barrick on the JV Zone in between the North and South Zones. During 2018, Kinross acquired the remaining 50% portion of the JV Zone that it did not already own and is now the 100% owner of the full property. In 2025, 12.7 Mt of ore were placed on pads at Bald Mountain at a grade of 0.42 g/t versus 18.4 Mt of ore at a grade of 0.48 g/t in 2024. Bald Mountain produced 179,169 oz in 2025, comparable to the 181,047 oz produced in 2024. The decrease in ounces placed on the heap leach pads and grade were offset by the timing of ounces recovered from the heap leach pads. In December 2024, Kinross converted approximately 1.0 Moz to reserves, and made the decision to proceed with mining of Phase 1 at the Redbird pit. Following the success of Phase 1, in January 2026 the Company announced that it would be proceeding with the development of Redbird 2. The Redbird 2 project consists of Phase 2 of the Redbird pit along with five additional satellite pits that combined are expected to incrementally produce a total of approximately 640,000 gold oz. First production at Redbird 2 is expected in 2028, with average production of approximately 155,000 gold oz per year between 2028– 2031. This extends production at Bald Mountain until early 2032. The project leverages the existing infrastructure, equipment, and workforce at Bald Mountain, continuing the long history of successful open pit heap leach operations on the extensive land package of which Franco-Nevada royalties cover 99% of the 2025 year-end resource. With a M&I Resource of 145 Mt at a grade of 0.5 g/t containing 2.5M gold oz and a pipeline of high-quality targets, Kinross is exploring further opportunities for additional resource conversions and exploration success. Large land package and significant exploration upside The operator currently has a 7-year mine plan. M&I Resources could support production for 24 years and Inf. Resources for a further 5 years FNV Royalties Excluded from Royalty Pits/Deposits * Subject to possible reduction by third-party royalty North Block South Block Galaxy Poker Flats Bida Saga Yankee Targets Lux/Vantage Targets Top Sage Flats Belmont Horseshoe 4% NSR 4% NSR 4% NSR 4% NSR 4% NSR * 4% NSR * 4% NSR * 4% NSR * 4% NSR * 4% NSR * 4% NSR * 0.875 to 1.75% NSR 2.418% NSR Royale 1%-5% GR Redbird 5 1 LJ Ridge Banghart South Ridge Rat North Duke South Duke 2/3 1%-5% GR Winrock Bald Mountain Oregon Idaho Utah Nevada California Arizona Mexico Pacific Ocean Bald Mountain 0.875–5% NSR / GR kilometer 2 0 N TSX / NYSE: FNV 78 ★ Franco-Nevada Corporation United States
S T I L L W A T E R Producing Location: Montana, United States | Operator: Sibanye Stillwater Limited | Precious Metals: PGM | Royalty: NSR: 5% The Stillwater complex in Eastern Montana is comprised of the Stillwater mine (West and East) and East Boulder mine and is operated by Sibanye Stillwater Limited (“Sibanye-Stillwater”). 2025 2024 2023 Revenue to Franco ‑ Nevada ($ million) $ 15.4 $ 21.2 $ 26.1 M&I Resources (koz PGM) 1 39,800 38,100 44,100 Inf. Resources (koz PGM) 1 41,100 41,100 43,700 P&P Reserves (koz PGM) 1 19,400 19,000 26,300 M&I Royalty Ounces (000s) 1,3 675 570 886 Inf. Royalty Ounces (000s) 2,3 697 615 878 P&P Royalty Ounces (000s) 2,3 329 284 529 1 Please refer to the tables on pages 126–134 for a breakout of grade and tonnages by Mineral Resource category; all M&I categories are inclusive of Mineral Reserves 2 For Royalty Ounce calculation, Franco-Nevada estimates 98% of the Mineral Resources and Mineral Reserves are subject to our royalty interest 3 Given more significant smelting and refining charges, Franco-Nevada estimates an average rate of 4.50% is applicable (assuming 10% for charges) and PGM ounces converted into Royalty Ounces assuming $2,000/ounce Pt and $1,650/ounce Pd ($950/ounce Pt and $950/ounce Pd in 2024, $850/ounce Pt and $900/ounce Pd in 2023) Production began in 1986 at the Stillwater mine and in 2002 at the East Boulder mine. In 2014, the operator commenced the Blitz project which included developing a third access at Stillwater East. The production from the PGM orebodies is primarily palladium and platinum (“2E PGM”), representing 78% and 22%, respectively. Sibanye Gold Limited acquired Stillwater Mining Corporation in May 2017. Franco-Nevada has a 5% NSR royalty on all commercially recoverable metals produced from 810 of the 1,712 claims that cover the Stillwater complex. The amount of the royalty is reduced by permissible “onward processing” deductions, which have averaged between 10–15% of revenue over the last several years. Based on Franco-Nevada’s estimates, the NSR royalty currently covers 97% of the Stillwater Mineral Reserves and 100% of the East Boulder Mineral Reserves. Franco-Nevada’s royalty covers all current mining activity at Stillwater as the partial coverage only applies to Stillwater West, which was put on care and maintenance at the end of 2024. 2025 production decreased to 284,069 2E PGM ounces compared to 425,842 2E PGM ounces in 2024 due to restructuring of the operations in Q4 2024. The restructuring placed the Stillwater West mine on care and maintenance, with production focusing on lower volume, higher margin production from the East Boulder and Stillwater East mines. Production for 2026 is forecasted to be between 280 and 300 2E PGM koz as the operation continues to focus on lowering the cost structure to support sustained profitability. Sibanye-Stillwater announced in April 2026 plans to implement full in-stope mechanisation to drive productivity enhancements. This plan is expected to increase annual production to approximately 410 2E PGM kozpa by 2029 at unit costs of $1,000/2E PGM ounce. Stillwater West is expected to remain in care and maintenance during this period and provides future optionality and upside. The recent Section 45X tax credits as well as possible tariffs on Russian palladium could further support margins and production growth at the operations. The Stillwater and East Boulder reserves support a long mine life in excess of 35 years. Stillwater Wyoming AB SK MB North Dakota Nebraska Idaho Utah Colorado Montana South Dakota Stillwater Complex 5% NSR mile 0 1 N Franco- Nevada Royalty Franco- Nevada Royalty East Boulder Portal Site East Boulder Adit Stillwater Mill Site Camp Lake Boulder River East Boulder River Dry Fork Creek Lewis Gulch West Fork Stillwater Stillwater River Limit of Claims Sweetgrass Co. Park Co. Stillwater Co. Sweetgrass Co. County line Long Section (Not to scale) Plan View Stillwater East (Blitz) Stillwater West East Boulder Mine Non-Royalty mill area Lower Stillwater East (Lower Blitz) Current and future planned production layouts Franco-Nevada Royalty Land Only primary PGM producer in the U.S. Production likely to recover from current levels provided PGM prices remain robust The operator currently has a 35-year mine plan. M&I Resources could support production for 80 years and Inf. Resources for a further 83 years Franco-Nevada Corporation ★ 79 TSX / NYSE: FNV United States
M A R I G O L D Producing Location: Nevada, United States | Operator: SSR Mining Inc. | Precious Metals: Au | Royalty: NSR: 1.75–5% / GR: 0.5–4% The Marigold mine is located 64 km southeast of Winnemucca, Nevada on the Battle Mountain-Eureka Trend and is operated by SSR Mining Inc. (“SSR Mining”). 2025 2024 2023 Revenue to Franco ‑ Nevada ($ million) $ 9.6 $ 6.5 $ 11.2 M&I Resources (koz Au) 1 5,044 5,166 4,603 Inf. Resources (koz Au) 1 453 249 370 P&P Reserves (koz Au) 1 3,237 3,256 2,863 M&I Royalty Ounces (000s) 1,2 81 95 113 Inf. Royalty Ounces (000s) 2 3 5 9 P&P Royalty Ounces (000s) 2 58 60 70 1 Please refer to the tables on pages 126–134 for a breakout of grade and tonnages by Mineral Resource category; all M&I categories are inclusive of Mineral Reserves 2 For Royalty Ounce calculation, Franco-Nevada estimates 77% of the Mineral Reserves (81% in 2024, 96% in 2023), 74% of the M&I Mineral Resources (81% in 2024, 96% in 2023) and 50% of the Inf. Mineral Resources (81% in 2024, 96% in 2023) are subject to our royalty interest and estimates a rate of 2.34% is applicable for Mineral Reserves (2.28% in 2024, 2.55% in 2023), 2.19% is applicable for M&I Mineral Resources (inclusive of Mineral Reserves) (2.28% in 2024, 2.55% in 2023) and 1.49% is applicable for Inf. Mineral Resources (2.28% in 2024, 2.55% in 2023) The mine has been in continuous production since 1989 and is a large run-of-mine heap leach operation with several open pits. Marigold achieved 5.0 Moz of life of mine gold production in December 2024. Franco-Nevada has various royalties on the operation (1.75–5% NSR and 0.5–4% GR), as shown in the schematic, together covering a significant portion of the current Mineral Reserve base. In 2025, 19.3 Mt of ore were placed on pads at a grade of 0.39 g/t gold versus 27.7 Mt of ore placed on pads at a grade of 0.28 g/t gold in 2024. The mine produced 153,535 oz of gold versus 168,262 oz in 2024. 2026 gold production is expected to be between 170–200 koz. SSR Mining plans to invest $108M in sustaining capital at Marigold in 2026 primarily focused on fleet improvements to enable the development of a number of potentially significant mine life extension opportunities. An updated LOM production profile and technical report is expected within the next 12–18 months. Royalty payments to Franco-Nevada will fluctuate depending on where mining activity is occurring and are expected to increase in the medium term as mining moves onto higher royalty rate ground. SSR Mining’s strategy to advance brownfields targets proximal to existing infrastructure continues to yield encouraging results and the company plans to continue its exploration drilling in 2026 with a $48 million budget. The focus will be on oxide mineral reserve additions and conversion at Buffalo Valley, Mackay, Valmy and New Millennium. Franco-Nevada royalty ground covers Mackay and portions of the Valmy and New Millennium targets. Valmy Buffalo Valley and Trenton Canyon to the south. No FNV Royalty 5 North Pits 8 North Pit 8 South New Millennium Basalt & Antler Terry Zone North Terry Zone 1.75% NSR 1.75% NSR 1.75% NSR 1.75% NSR 5% NSR 5% NSR 5% NSR 5% NSR 5% NSR 5% NSR 5% NSR 5% NSR 5% NSR 5% NSR 5% NSR 5% NSR 3% NSR* 3% NSR* 3% NSR* 2.5%–4% GR* 2.5%–4% GR* 2.5%-4% GR* 2.5%–4% GR* 5% NSR 1.75% NSR Schematic Representation Only Valmy Mud Pits Red Dot Target Pit 2.5%– 4% GR* 0.5%–1.5% GR* Mackay Pit Marigold 1.75–5% NSR / 0.5–4% GR mile 1 0 Marigold Pacific Ocean Oregon Idaho Utah Nevada California Arizona MEXICO FNV Royalties Excluded from Royalty Pits * December 2009 Acquisition N Production growth expected in 2026 Continued resource expansion and encouraging exploration results The operator currently has a 7-year mine plan. M&I Resources could support production for 23 years and Inf. Resources for a further 2 years TSX / NYSE: FNV 80 ★ Franco-Nevada Corporation United States
kilometers 1 0 N Reserves 8.91% NSR Resources Gold Quarry Pit Outline Tusc Pit Outline >0.3 g/t Au Gold Quarry 8.91% NSR 8.91% NSR FNV Royalties Gold Quarry Pacific Ocean Oregon Idaho Utah Nevada California Arizona MEXICO G O L D Q U A R R Y Producing Location: Nevada, United States | Operator: Nevada Gold Mines LLC | Precious Metals: Au | Royalty: NSR: 8.91% 4 The Gold Quarry operation is part of the Nevada Gold Mines Carlin operations in north-central Nevada. 2025 2024 2023 Revenue to Franco ‑ Nevada ($ million) $ 5.0 $ 3.0 $ 3.0 M&I Resources (koz Au) 1,2 n/a n/a n/a Inf. Resources (koz Au) 1 n/a n/a n/a P&P Reserves (koz Au) 1 n/a n/a n/a M&I Royalty Ounces (000s) 2,3 n/a n/a n/a Inf. Royalty Ounces (000s) 3 n/a n/a n/a P&P Royalty Ounces (000s) 3 n/a n/a n/a 1 Please refer to the table on page 77 for the Carlin Trend Mineral Resources and Mineral Reserves which include Gold Quarry 2 All M&I categories are inclusive of Mineral Reserves 3 Please refer to the table on page 77 for the Carlin Trend Royalty Ounce calculation which includes Gold Quarry 4 Current minimum ounce payments expected unless significant change to key parameters Gold Quarry is a large open pit mine that has been in production since 1985 supplying ore as part of an integrated mining and processing complex. In 2019, Barrick (61.5%) and Newmont (38.5%) combined their significant assets across Nevada to create Nevada Gold Mines as a joint venture. Under this joint venture, Barrick reports Gold Quarry under its Carlin operations category and Newmont reports Gold Quarry under its Nevada Gold Mines category. Franco-Nevada’s royalty interest covers only a portion of the Gold Quarry property, as shown in the schematic. The Gold Quarry royalty is an 8.91% NSR. Franco-Nevada’s interest increased by 1.62% in 2025 due to the acquisition of a third-party royalty during the year. NSR payments are based on production, backstopped by three minimum payment obligations. The annual minimum royalty payment calculation is tied to Mineral Reserves and stockpiles attributed to the Gold Quarry royalty property. If reserves, or production levels on royalty ground increase, it is possible Franco-Nevada would return to higher levels of annual royalty payments. Franco-Nevada has received 1,350 GEOs per year since 2021 based on these backstops and expects this to increase to 1,650 GEOs per year starting in 2026 due to the above mentioned incremental royalty interest acquired by Franco-Nevada in 2025. In the medium term, Franco-Nevada expects its royalty from Gold Quarry to be 1,650 GEOs per annum, as the cumulative prepaid ounces delivered by Gold Quarry exceeds the attributable Gold Quarry known Mineral Reserves, which represents the lowest level of the minimum payment obligations. Annual minimum payment obligations Gold Quarry expected to be the open pit focus of Nevada Gold Mines’ Carlin operations beginning in 2027 Royalty registered on private lands The operator currently has a 11-year mine plan. M&I Resources could support production for 24 years Franco-Nevada Corporation ★ 81 TSX / NYSE: FNV United States
M E S Q U I T E Producing Location: California, United States | Operator: Equinox Gold Corp. | Precious Metals: Au | Royalty: NSR: 0.5–2% Mesquite is a gold operation located in southeast California, 70 km northwest of Yuma, Arizona and 230 km east of San Diego, California. 2025 2024 2023 Revenue to Franco ‑ Nevada ($ million) $ 5.5 $ 3.2 $ 3.1 M&I Resources (koz Au) 1 1,213 1,855 1,016 Inf. Resources (koz Au) 1 55 912 510 P&P Reserves (koz Au) 1 125 471 584 M&I Royalty Ounces (000s) 1,2 22 34 19 Inf. Royalty Ounces (000s) 2 1 17 9 P&P Royalty Ounces (000s) 2 2 9 11 1 Please refer to the tables on pages 126–134 for a breakout of grade and tonnages by Mineral Resource category; all M&I categories are inclusive of Mineral Reserves 2 For Royalty Ounce calculation, Franco-Nevada estimates 100% of the Mineral Resources and Mineral Reserves are subject to our royalty interest and estimates a rate of 1.85% is applicable The mine is an open pit, run-of-mine, heap leach operation. Franco-Nevada holds royalties on the entire Mesquite mine property that range from a 0.5–2% NSR, depending on the claim block, as shown on the schematic. Mesquite produced 85,998 oz of gold in 2025, an increase from 71,984 oz of gold produced in 2024 due to reaching the major ore source of the Ginger pit in March 2025 which had higher grades than the material mined in 2024. For 2026, Equinox Gold anticipates production of 70–80 koz of gold. Mining at Mesquite in 2026 will be focused on Brownie phase 4, Rainbow North and the Big Chief 8 pits. Equinox continues to work to extend the mine life at Mesquite through exploration and permitting with a $5 million to $10 million budget for 2026. Mesquite, California Brownie Big Chief Rainbow Vista 2% NSR 0.5% NSR 1% NSR Mesquite 0.5 –2% NSR Mesquite Pacific Ocean Oregon Idaho Utah Nevada California Arizona Mexico Royalty Property Pits mile 1 0 N Largest operating gold mine in California Ongoing resource expansion and permitting to enable mine life extension The operator currently has a 2-year mine plan. M&I Resources could support production for 16 years and Inf. Resources for a further 1 year TSX / NYSE: FNV 82 ★ Franco-Nevada Corporation United States
C A S T L E M O U N T A I N Producing Location: California, United States | Operator: Equinox Gold Corp. | Precious Metals: Au | Royalty: NSR: 2.65 –4.65% The Castle Mountain mining property is located in California, close to the Nevada border and is in the historic Hart Mining District, 120 km south of Las Vegas, Nevada. 2025 2024 2023 Revenue to Franco ‑ Nevada ($ million) $ 0.8 $ 1.3 $ 1.1 M&I Resources (koz Au) 1 5,575 5,638 5,638 Inf. Resources (koz Au) 1 1,422 1,422 1,422 P&P Reserves (koz Au) 1 4,105 4,168 4,168 M&I Royalty Ounces (000s) 1,2 157 159 159 Inf. Royalty Ounces (000s) 2 40 40 40 P&P Royalty Ounces (000s) 2 116 118 118 1 Please refer to the tables on pages 126–134 for a breakout of grade and tonnages by Mineral Resource category; all M&I categories are inclusive of Mineral Reserves 2 For Royalty Ounce calculation, Franco-Nevada estimates 100% of the Mineral Resources and Mineral Reserves are subject to our royalty interest and estimates a rate of 2.82% is applicable The Castle Mountain mine is operated by Equinox Gold and has land holdings that total greater than 40 km 2 of patented and unpatented claims. The mine was previously operated by Viceroy Gold and MK Resources and produced over 1.2 Moz of gold. Franco-Nevada holds a 2.65% NSR covering all the existing Castle Mountain mine and extending 10 miles from the boundary of the mine. In addition, Franco-Nevada acquired the ‘American Standard’ 2% NSR on the Pacific Clay claims, which comprise a portion of the JSLA pit in 2022. When combined with the 2.65% NSR, Franco-Nevada has a 4.65% NSR on the Pacific Clay claims. Redevelopment of Castle Mountain was planned in two phases. Small scale operations were initiated in Phase 1 while permits were progressed for Phase 2. In September 2024, mining operations at Castle Mountain were suspended to focus on Phase 2 permitting. Once permitted, Phase 2 is expected to produce approximately 220 kozpa of gold during a 12 plus year mine life. Equinox plans to issue an updated feasibility study in the second half of 2026. In June 2025, the Castle Mountain Expansion was accepted as a FAST-41 Project, and all federal permits are expected by the end of 2026 with an investment decision expected during the first half of 2027. The 2021 feasibility study showed a two-year construction period which would put first production from Phase 2 in 2029. Castle Mountain Mine Las Vegas Los Angeles Mexico California Nevada Oro Belle Mined Pit Jumbo Mined Pit JSLA Mined Pit South Waste Dump West Waste Dump Pacific Clay claims 4.65% NSR Heap Leach Pad 2.65% NSR Castle Mountain 2.65–4.65% NSR *Plus 10 Mile Area of Interest Royalty lands 2.65% NSR Pits Pacific Clay Claims 4.65% NSR 1,000 metre 0 2,000 N Permitting Phase 2 expansion to increase production to 220 koz per year Franco-Nevada’s royalty covers entire project area with a 10-mile area of interest The operator currently has a 14-year mine plan. M&I Resources could support production for 25 years and Inf. Resources for a further 6 years Franco-Nevada Corporation ★ 83 TSX / NYSE: FNV United States
i - 8 0 G O L D A S S E T S Producing Location: Nevada, United States | Operator: i-80 Gold Corp. | Precious Metals: Au & Ag | Royalty: NSR: 1.5–3% In February 2026, Franco-Nevada acquired a 1.5% NSR which increases to 3% in 2031 on all minerals produced from Granite Creek, the Ruby Hill Property (including Archimedes and Mineral Point), Cove and Lone Tree. 2025 2024 2023 Revenue to Franco ‑ Nevada ($ million) $ – $ – $ – M&I Resources (koz Au) 1 6,518 – – Inf. Resources (koz Au) 1 7,482 – – P&P Reserves (koz Au) 1 – – – M&I Resources (koz Ag) 1 127.7 – – Inf. Resources (koz Ag) 1 102.9 – – P&P Reserves (koz Ag) 1 – – – M&I Royalty Ounces (000s) 1,2 235 – – Inf. Royalty Ounces (000s) 2 269 – – P&P Royalty Ounces (000s) 2 – – – 1 Please refer to the tables on pages 126–134 for a breakout of grade and tonnages by Mineral Resource category; all M&I categories are inclusive of Mineral Reserves 2 For Royalty Ounce calculation, Franco-Nevada estimates 100% of the Mineral Resources and Mineral Reserves from Granite Creek, the Ruby Hill Complex (including Archimedes and Mineral Point), Cove and Lone Tree are subject to our royalty interest and estimates a rate of 1.5% is applicable which increases to 3.0% in 2031. Applicable production for both royalty rates has been approximated using the Q1 2025 PEA studies for each deposit The royalties also include a one-mile AOI beyond each property boundary. The royalty acquisition was part of i-80 Gold’s recapitalization plan to advance all projects through various stages of development and fund the refurbishment of the Lone Tree Autoclave plant. The Lone Tree Autoclave will be the only Autoclave in Nevada not owned by Nevada Gold Mines, giving i-80 Gold the ability to process refractory ore from underground development projects. Granite Creek – Producing: The Granite Creek property includes the currently producing underground operation and the advanced stage open pit resource. Ore from the underground is currently sold through a toll milling agreement until the Lone Tree Autoclave is refurbished, expected in 2028. The underground is expected to produce 30–40 koz of gold in 2026 and an updated feasibility study is expected mid-2026. Recent drilling at the South Pacific Zone demonstrates potential for resource expansion and will be advanced with a $10 million budget in 2026. The Granite Creek open pit resource will be advanced through permitting and technical studies through 2027 with construction starting in 2028 and first gold production in H2 2029. In addition to the interest acquired in February 2026, Franco-Nevada holds incremental NSR royalties ranging from 0.083% to 2.0% on the southern portions of the open pit resource. Archimedes and Mineral Point (part of the Ruby Hill Property) - Advanced: Construction commenced at the Archimedes underground in Q3 2025. Infill drilling of the deposit will be completed in Q2 2026 with first gold production expected in late 2026. Ore from Archimedes is planned to be sold through the same toll milling agreement as Granite Creek. A feasibility study is anticipated to be completed in Q1 2027, and ore will be sent to the Lone Tree Autoclave once refurbishment is complete. Mineral Point is a large oxide Au-Ag deposit with the potential to become one of Nevada’s largest open pit operations. In 2026, i-80 plans to perform ~131,000 meters of drilling with a $40 million to $45 million budget to update the Mineral Resource and provide data for a pre- feasibility/feasibility study, which is anticipated in H1 2027. Permitting and technical work will be advanced through 2029 with construction beginning in 2030 and first gold production estimated in H2 2031. Cove – Advanced: Cove is an underground resource and has high-grade brownfield gold deposits open for expansion. Permitting and technical work will be advanced through 2027 with construction beginning in 2028 and first gold production anticipated in H2 2029. Ore from Cove would be sent to the Lone Tree Autoclave for processing. In addition to the NSR, acquired as part of the Victoria Gold royalty portfolio in early 2026, Franco-Nevada holds cumulative production payment rights of C$5 million each, due upon production of 250,000, 500,000, 750,000 and 1,000,000 troy ounces of gold from the project. Lone Tree – Exploration: Lone Tree is a past producing open pit mine which ended mining activity in 2006. The property contains 428 koz of Indicated Mineral Resource and 2.8 Moz of Inf. Mineral Resource. i80 Gold Oregon Idaho Utah Nevada California Arizona Mexico Pacific Ocean Highway 50 Interstate 80 i-80 Gold Assets 1.5–3% NSR 25 0 kilometers N Lone Tree Granite Creek Cove Mineral Point and Archimedes Franco-Nevada Royalty Land Area of Interest ~200 kozpa AuEq by 2030 from 3 refractory deposits processed at Lone Tree Autoclave Additional 400 kozpa AuEq beyond 2030, anchored by Mineral Point and Granite Creek open pit Royalty covers expansive >250 km² land package with >16 Moz AuEq in total resources The operator currently has a 22-year mine plan TSX / NYSE: FNV 84 ★ Franco-Nevada Corporation United States
R O B I N S O N Producing Location: Nevada, United States | Operator: KGHM International Ltd. | Metals: Cu, Mo, Ag & Au | Royalty: NSR: 0.225% / other The Robinson open pit mining complex, operated by KGHM, produces copper, gold, silver and molybdenum and is located near Ely, Nevada. Franco-Nevada has three royalties covering the Robinson mine: 1. 0.225% NSR on all base metal and associated precious metal production; 2. 10% NSR on 51% of the gold production from the property in excess of 60 koz of gold per year; and 3. under a copper agreement, a price participation royalty on 51% of 40% of each pound of copper production from the property in excess of 130 Mlbs of copper produced per annum, multiplied by the spot price, less $1.00/lb adjusted for inflation (based on 1990 dollars). Amounts are only payable in any year in which the average price of copper during that year exceeds a $1.00/lb threshold, as adjusted for inflation (based on 1990 dollars). Franco-Nevada will likely only be paid on the base 0.225% NSR royalty for 2026 as production is expected to be below the royalty threshold level. In 2025, Robinson ceased extraction from Ruth West 5 (“RW5”) and is now mining from the Liberty pit as well as preparing Tripp-Veteran for mining. Liberty ore is of lower quality compared to RW5, which is expected to impact results in the coming quarters. Due to this, Franco-Nevada expects royalty revenue in 2026 to be slightly lower than 2025. Robinson currently has a 12-year mine life and Franco-Nevada expects annual royalty revenue to remain relatively consistent over that period. For Royalty Ounce calculation, Franco-Nevada estimates 100% of the gold and copper Mineral Resources and Mineral Reserves are subject to our royalty interest and estimates an average rate of 0.225% is applicable for gold and 0.1913% for copper (which factors a NSR smelting charge of 15%). Copper has been converted to Royalty Ounces assuming $5.50/lb ($4.25/lb in 2024, $3.75/lb in 2023) E A G L E P I C H E R Producing Location: Nevada, United States | Operator: US Silica Holdings, Inc. | Metals: De | Royalty: Production Payment EaglePicher is a diatomaceous earth operation in Pershing County, Nevada, located about 23 miles northwest of Lovelock. The royalty is based on a fixed payment per ton which fluctuates based on the average sales price from the prior year’s sales. The royalty covers approximately 15 km 2 of checkerboard lands. The intervening lands are public and EaglePicher holds unpatented placer claims on those lands as needed for mining. The mine has been in continuous operation since the 1950s with approximately 65% of production coming from Franco-Nevada land. The BLM approved an Environmental Assessment permit for the operation in 2024 which allows for additional disturbance and mine life extension. The current resource supports a mine life into the late 2030’s with exploration potential to further expand the mine life. The revenue received from EaglePicher in 2024 and 2025 was $463,000 and $613,000, respectively. Franco-Nevada has not included EaglePicher in Royalty Ounce estimates Franco-Nevada Corporation ★ 85 TSX / NYSE: FNV United States
C O P P E R W O R L D P R O J E C T Advanced Location: Arizona, United States | Operator: Hudbay Minerals Inc. | Metals: Cu, Mo, Ag & Au | Royalty: NSR: 2.085% Franco-Nevada has a 2.085% NSR royalty covering all metals, including copper, molybdenum, silver and gold extracted from the majority of claims covering the Copper World and East (formerly known as Rosemont) deposits in Pima County, approximately 30 miles southeast of Tucson, Arizona. 2025 2024 2023 Revenue to Franco ‑ Nevada ($ million) $ − $ – $ – M&I Resource (Mlbs Cu) 1,3 11,097 11,100 11,157 Inf. Resource (Mlbs Cu) 1,3 1,940 1,957 1,940 P&P Reserves (Mlbs Cu) 1,3 4,585 4,585 4,583 M&I Royalty Ounces (000s) 1,2,3 246 305 380 Inf. Royalty Ounces (000s) 2,3 44 55 66 P&P Royalty Ounces (000s) 2,3 99 123 156 1 Please refer to the tables on pages 126–134 for a breakout of grade and tonnages by Mineral Resource category; all M&I categories are inclusive of Mineral Reserves 2 For Royalty Ounce calculation, Franco-Nevada estimates 100% (100% in 2024, 100% in 2023) of the Mineral Resources and Mineral Reserves are subject to our royalty interest and estimates a rate of 1.772% (which factors a NSR smelting charge of 15%) for floatation material and a rate of 2.085% for leach material. Copper has been converted to Royalty Ounces assuming $5.50/lb ($4.25/lb in 2024, $3.75/lb in 2023) 3 Does not include silver or molybdenum Mineral Resource and Mineral Reserve estimates Hudbay Minerals Inc. (“Hudbay”) is the operator of the asset following its acquisition of Augusta Resource Corporation in 2014. The Copper World Project includes seven new deposits discovered in 2021 (then referred to as the “Copper World deposits”), together with the East deposit (formerly known as the “Rosemont deposit”). The property is situated near a number of large producing copper mines. In November 2021, Franco-Nevada acquired an incremental 0.585% NSR royalty interest on the Copper World Project from certain private sellers. The royalty has identical terms as an existing 1.5% NSR royalty that Franco-Nevada held and covers the same land package, including the Copper World deposits. Hudbay is focused on advancing the Copper World Project which is on private land and has obtained all required permits. In September 2023, Hudbay released an enhanced pre-feasibility study for the Copper World Complex. The pre-feasibility study announced a Mineral Reserve of 385 million ore tonnes at 0.54% copper and a Mineral Resource of 1,205 million ore tonnes at 0.42% copper. The pre-feasibility study also announced Inf. Mineral Resources of 275 million ore tonnes at 0.32% copper. The pre-feasibility study reflects a two-phase mine plan with the first phase reflecting a standalone operation with processing infrastructure on Hudbay’s private land and mining occurring on portions of the deposits located on patented mining claims. The Copper World Project anticipates producing an average of approximately 85 kt of copper per year for 20 years. The second phase expands mining activities onto federal land and extends the mine life well beyond 20 years. Hudbay announced a $600 million strategic investment from Mitsubishi Corporation in August 2025 for a 30% minority JV interest in Copper World. A detailed engineering and feasibility study are underway with results expected to be released mid-2026 and a construction sanctioning decision expected in 2026, which would allow for first production in 2029. Franco-Nevada has certain contingent payments to previous holders of the Copper World royalties, part of which are expected to be due after the release of the feasibility study in 2026. Hudbay announced the acquisition of Arizona Sonoran in March 2026 further strengthening their operating position in Arizona. The acquired Cactus project is expected to be sequenced after the construction of Copper World. Copper World Project 2.085% NSR 2.085% NSR kilometer 2 0 N Patented Royalty Licences Mineral Resources Unpatented Royalty Licences Excluded from Royalty Peach North Limb Elgin South Limb Broad Top Butte Bolsa Copper World East Deposit 2017 Reserve Pit 83 Copper World Project Pacific Ocean Oregon Idaho Utah Nevada California Arizona Mexico Franco-Nevada’s royalty covers all metals, including copper, molybdenum, silver and gold $600M strategic investment from Mitsubishi Corporation highlights quality of Copper World asset The operator currently has a 20-year mine plan. M&I Resources could support production for 61 years, with Inf. Resources for a further 14 years TSX / NYSE: FNV 86 ★ Franco-Nevada Corporation United States
S T I B N I T E G O L D Advanced Location: Idaho, United States | Operator: Perpetua Resources Corp. | Precious Metals: Au & Ag | Royalty: NSR: 1.7% Au, 100% Ag³ The Stibnite project is located in a historic mining town of the same name in Idaho, about 153 km northeast of Boise and is one of the highest grade open pit deposits in the U.S. 2025 2024 2023 Revenue to Franco ‑ Nevada ($ million) $ − $ − $ − M&I Resources (koz Au) 1 6,320 6,317 6,317 Inf. Resources (koz Au) 1 1,611 1,611 1,611 P&P Reserves (koz Au) 1 4,819 4,816 4,816 M&I Royalty Ounces (000s) 1,2 131 123 107 Inf. Royalty Ounces (000s) 2 33 31 27 P&P Royalty Ounces (000s) 2 98 93 82 1 Please refer to the tables on pages 126–134 for a breakout of grade and tonnages by Mineral Resource category; all M&I categories are inclusive of Mineral Reserves 2 For Royalty Ounce calculation, Franco-Nevada estimates 100% of the Mineral Resources and Mineral Reserves are subject to our royalty interest and for gold estimates a rate of 1.70% is applicable and that for silver, all of the payable silver by-product revenue over the life of mine will be received. Silver has been converted assuming $4,500/oz gold and $75.00/oz silver 3 Silver royalty is based on the expected payable silver with certain adjustments related to antimony concentrates The project is being advanced by Perpetua Resources Corp. (“Perpetua Resources”), who have consolidated 107 km 2 of unpatented and patented claims. Franco-Nevada holds a 1.7% NSR on gold production and, pursuant to a subsequent transaction that closed in March 2024, will receive all the expected payable silver by-product revenue over the life of mine. In March 2026, Perpetua Resources released an updated technical report on the Stibnite project. The project is expected to have a 15-year mine life with average annual gold production of 296 koz per year. The first four years have an average annual gold production of 463 koz per year. Stibnite has Mineral Reserves of 4.8 Moz of gold and 6.4 Moz of silver (105 Mt at 1.43 g/t gold and 1.91 g/t silver). M&I Mineral Resources are 6.3 Moz of gold and 9.4 Moz of silver (148 Mt at 1.33 g/t gold and 1.97 g/t silver). Inf. Mineral Resources are 1.6 Moz of gold and 2.3 Moz of silver (52 Mt at 0.96 g/t gold and 1.40 g/t silver). There is potential to significantly increase Mineral Resources and Mineral Reserves at the project with advancement of high potential exploration targets. The United States Forest Service (“USFS”) issued the Final Record of Decision (“ROD”) authorizing the project in January 2025 and the final federal permits were issued in May 2025. Since receiving the federal permits, Perpetua has completed $527 million of equity financing, announced a $317 million strategic equity investment and private placement with Agnico Eagle and JPMorganChase, as well as advanced an application with the Export-Import Bank of the United States (“U.S. EXIM”) for a loan of up to $2.7 billion. Early works construction was announced in October 2025, and Perpetua expects to close the U.S. EXIM loan in 2026 which will allow for a final investment decision. Commercial operations are expected in 2029. Royalty Property Prospects Mineral Deposits Patented Claims under option Utah Nevada California Stibnite Gold Project Boise Cascade McCall Coeur d'Alene Salt Yellow Pine Deposit West End Deposit Hangar Flats Deposit Historic Tailings Blow-out Mule Rabbit Scout Garnet Ridgetop Cinnamid Saddle Fern Upper Midnight Stibnite Gold 1.7% NSR Au 100% NSR Ag mile 0 1 N One of the largest and highest grade undeveloped open pit gold deposits in the U.S. The Stibnite project would be the only domestic source of antimony mined in the U.S. $2.7B indicative U.S. EXIM financing The operator currently has a 15-year mine plan. M&I Resources could support production for 21 years and Inf. Resources for a further 5 years Franco-Nevada Corporation ★ 87 TSX / NYSE: FNV United States
A R T H U R G O L D Advanced Location: Nevada, United States | Operator: AngloGold Ashanti plc | Precious Metals: Au | Royalty: NSR: 1% The Arthur Gold Project, located in the Beatty Mining District of southern Nevada, consists of the Silicon and Merlin deposits and represents an emerging tier - one gold asset in a stable and supportive mining jurisdiction. 2025 2024 2023 Revenue to Franco ‑ Nevada ($ million) $ – $ – $ – M&I Resources (koz Au) 1 9,350 – – Inf. Resources (koz Au) 1 6,340 – – P&P Reserves (koz Au) 1 4,940 – – M&I Royalty Ounces (000s) 1,2 97 – – Inf. Royalty Ounces (000s) 2 65 – – P&P Royalty Ounces (000s) 2 50 – – 1 Please refer to the tables on pages 126–134 for a breakout of grade and tonnages by Mineral Resource category; all M&I categories are inclusive of Mineral Reserves 2 For Royalty Ounce calculation, Franco-Nevada estimates 99% of Mineral Resources and Mineral Reserves are subject to our royalty interest and estimates an average rate of 1.0% is applicable. Silver has been converted assuming $4,500/oz gold and $75.00/oz silver The Arthur Gold Project comprises the Silicon and Merlin deposits and was formerly known as the Expanded Silicon Project. Following the successful completion of a concept study in 2023, the project advanced to a pre-feasibility study centred on the Merlin deposit. This work, supported by extensive drilling and optimisation studies, resulted in a first-time Probable Mineral Reserve of 4.9 Moz of gold (88 Mt at 1.75 g/t) and 7.8 Moz of silver (88 Mt at 2.76 g/t) as at December 31, 2025. In addition to the reported Mineral Reserves, the Arthur Gold project has M&I Resources of 4.4 Moz of gold (164.1 Mt at 0.84 g/t) and 17.6 Moz of silver (164.1 Mt at 3.33 g/t) as well as Inf. Mineral Resources of 6.3 Moz of gold (219.8 Mt at 0.90 g/t) and 16.0 Moz of silver (219.8 Mt at 2.26 g/t). The pre-feasibility study supports an initial 9-year mine life with average annual gold production of ~500 koz, with production front-loaded of approximately 800 koz per year. The project is predominantly oxide mineralisation (>95%) and envisions conventional processing flowsheets. Development plans include an integrated operation featuring a 7 Mtpa milling facility, a 5.5 Mtpa crushed heap - leach circuit, and open - pit mining using electric rope shovels and ultra - class haul trucks. To ensure environmental stewardship, the Arthur Gold Project plans to use filtered, dry-stacked tailings for enhanced water conservation. AngloGold Ashanti plc (“AngloGold Ashanti”) is forecasting $111 million of capital expenditures on the definitive feasibility study in 2026. A total of 104 kms were drilled during 2025 and drilling programs remain underway with the aim to convert additional mineral resource, expand the mineralized footprint and support additional technical studies. The pre-feasibility study is expected to be presented to the AngloGold Ashanti Board of Directors for approval to transition to the feasibility study phase in June 2026. Arthur Gold Oregon Idaho Utah Nevada California Arizona Mexico Pacific Ocean Arthur Gold 1% NSR 5 0 kilometers N Royalty Lands Resource Footprint Silicon Merlin Motherlode SNA Secret Pass Daisy West Daisy South Sterling Highway 95 Highway 95 Gold Center Beatty One of the largest ever greenfield discoveries in the U.S. with significant resource expansion potential Likely developed by AngloGold Ashanti into a tier-one gold asset in a stable and supportive jurisdiction The operator currently has a 9-year mine plan. M&I Resources could support production for 19 years and Inf. Resources for a further 13 years TSX / NYSE: FNV 88 ★ Franco-Nevada Corporation United States
C O P P E R C R E E K Advanced Location: Arizona, United States | Operator: Faraday Copper Corp. | Metals: Cu, Mo & Ag | Royalty: NSR: 1% and Production Decision Royalty Payments Copper Creek is a 3-km-long porphyry copper deposit located in Pinal County, less than two hours northeast of Tucson, Arizona. A 2023 Preliminary Economic Assessment (“PEA”) reported 4.2 billion pounds of copper in M&I Mineral Resources. The PEA has a 32-year mine life with average production of 51,100 payable copper equivalent tonnes per year during active mining. Capital investment is estimated at $798 million with a two-year construction period. The Globe and Copper Prince open pit deposits, covered by Franco-Nevada’s royalty, are currently scheduled to be mined within the first three years of operations. Faraday Copper Corp. (“Faraday”) is currently performing baseline environmental monitoring and data collection to support the permitting process. A 1% NSR is payable to Franco-Nevada on all production from certain areas within Faraday’s control. Franco-Nevada’s royalty covers approximately 70% of the Globe and 50% of the Copper Prince open pit resources as reported in the PEA released in 2023. Payment of $3,000,000 ($500,000 per year over 6 years) is due to Franco-Nevada following achievement of commercial production of minerals within a 5-mile radius of certain patented claims now held by Faraday. The Copper Creek mineral resource area is within this 5-mile radius and would therefore be expected to trigger such payments upon production. The Globe resource contains 9.88 Mt of sulphide/transitional ore at 0.40% copper and 2.71 Mt of oxide ore at 0.37% copper. The Copper Prince resource contains 20.72 Mt of sulphide/transitional ore at 0.45% copper and 5.89 Mt of oxide ore at 0.36% copper. Franco-Nevada estimates that resources containing 203 Mlbs of copper (22.1 Mt at 0.33% copper) fall on royalty ground. In 2026, Faraday plans on completing the 40,000 meter Phase IV exploration drill program focused on resource expansion and testing new targets, metallurgical programs to support coarser grind and tailings optimization and a gold assay program to support the inclusion of gold in the updated technical report expected after the Phase IV program is complete. In February 2026, Faraday announced the signing of a letter of intent to acquire BHP’s San Manuel property in Arizona, creating a multi-asset copper district. The acquisition accelerates the pathway to production for Copper Creek as the private land position of San Manuel has the potential for expedited production from the combined projects. For Royalty Ounce calculation, Franco-Nevada estimates 18% of the Mineral Resources and Mineral Reserves are subject to our royalty interest and estimates a rate of 1.275% is applicable for the copper Royalty Ounces (which factors in a NSR smelting charge of 15%). Copper has been converted to Royalty Ounces assuming $5.50/lb S T E R L I N G Advanced Location: Nevada, United States | Operator: AngloGold Ashanti plc | Precious Metals: Au | Royalty: NSR: 0.25% Sterling is a historic gold operation located 185 km northwest of Las Vegas, Nevada near Beatty, Nevada. In 2022, AngloGold Ashanti acquired 100% of Coeur’s wholly owned subsidiary, Coeur Sterling, Inc., which owned the Sterling property. Franco-Nevada holds ⅛ th of a 2% NSR, or an effective 0.25% NSR royalty, on approximately 272 lode mining claims with a small minimum advance royalty. Sterling underground mining operations were terminated at the end of May 2015. The acquisition consolidates AngloGold Ashanti’s ownership position in the Beatty District allowing for optimal development of the assets centered on developing the North Bullfrog and Arthur Gold Projects. As of December 31, 2024, AngloGold Ashanti reported a mineral resource including 0.91 Moz (33.4 Mt at 0.85 g/t) at Sterling. AngloGold Ashanti now reports Sterling as part of its Nevada Regional Deposits. Franco-Nevada has not included Sterling in Royalty Ounce estimates Franco-Nevada Corporation ★ 89 TSX / NYSE: FNV United States
S O U T H R A I L R O A D Exploration Location: Nevada, United States | Operator: Orla Mining Ltd. | Precious Metals: Au | Royalty: NSR: 1% The South Carlin Complex is located in the Bullion mining district of the southern Carlin trend in Elko County, Nevada. The South Carlin Complex has been actively explored since 1969 by several operators. Orla acquired the northern and southern portions of the South Carlin Complex through the acquisitions of Gold Standard Ventures in 2022 and Contact Gold in 2024. The South Carlin Complex contains the Dark Star and Pinion deposits which Orla is progressing through permitting. Orla expects to receive all permits by mid 2026 with first production in Q4 2027. Franco-Nevada’s royalty does not cover these deposits. Franco-Nevada’s royalty covers portions of the northern exploration area including the POD/Sweet Hollow deposit and newly discovered Spike oxide deposit. In December 2025, Orla announced that the Spike target had oxide gold confirmed over a 1.5 km strike length. Drill results released included 38.1 metres at 0.80 g/t gold and 21.3 meters at 0.76 g/t gold. Franco-Nevada has not included South Railroad in Royalty Ounce estimates M I D A S - H O L L I S T E R - F I R E C R E E K Exploration Location: Nevada, United States | Operator: Hecla Mining Company | Precious Metals: Au | Royalty: Midas/Fire Creek NSR – 2.5%, Hollister NSR – 3–5% High-grade projects offering near-term production potential and district-scale discovery opportunities. Hecla acquired the Midas, Hollister and Fire Creek properties from Klondex Mines in 2018. Midas and Hollister were put on care and maintenance in 2019 and Fire Creek later followed in 2021. The Midas property has a permitted ~1,200 tons/day mill, tailings facility, utilities and surface infrastructure. 2025 Midas exploration drilling at the Pogo & Sinter targets resulted in high-grade gold intersections, including 0.95 oz/ton over 2.2 feet and 0.46 oz/ton over 6.1 feet. Hecla has discussed plans to use the Midas Mill as a central processing facility and announced a 2026 exploration budget of $16 million in Nevada focused on identifying high-grade structures to justify a restart of production by 2031. Potential targets to feed the mill on which Franco-Nevada has royalties include: • SE Midas Area: High-grade gold discovery at the “Pogo Trend” (returning 6.42 oz/ton gold) and the Sinter Vein, located 1.5 miles southeast of the original Midas mine. • Hollister Mine: Located within hauling distance of the Midas mill, offering additional high-grade ore potential. For Royalty Ounce calculation, Franco-Nevada estimates 100% of Mineral Resources and Mineral Reserves are subject to our royalty interest and estimates an average rate of 2.5% is applicable for Fire Creek and Midas and 3.0% is applicable for Hollister. Silver has been converted assuming $4,500/oz gold and $75.00/oz silver S L E E P E R Exploration Location: Nevada, United States | Operator: Paramount Gold Nevada Corp. | Precious Metals: Au | Royalty: NSR: 2% Former high-grade producer of 1.7M ounces at average head grade of ~7 g/t gold from 1986-1996, located 25 miles northwest of Winnemucca, Nevada. The Sleeper mine is a past producing gold mine with a large M&I resource of 1.9 Moz (163 Mt at 0.361 g/t gold and 4.05 g/t silver) and 1.2 Moz Inf. Mineral Resources (120 Mt at 0.315 g/t gold and 2.45 g/t silver). Paramount released an updated SK-1300 Technical Report in September 2023 showing that the deposit has the potential to be mined by open pit methods with heap leach and bio-oxidation as the primary processing scenario. In April 2026, Paramount commenced an Initial Assessment of Sleeper. The Initial Assessment is intended to examine a potentially lower-cost, staged development approach focused on heap-leachable material only, including approximately 54 million tons of material of economic interest. In parallel, Paramount plans to initiate permitting for infill drilling targeting surface material at Sleeper, which could support future resource updates and contribute to subsequent pre-feasibility or feasibility studies. Permitting is expected to be straightforward and timely, as the proposed activities fall within the scope of the existing Plan of Operations. Completion of the Initial Assessment is expected in late Q2 2026. For Royalty Ounce calculation, Franco-Nevada estimates 100% of Mineral Resources and Mineral Reserves are subject to our royalty interest and estimates an average rate of 2.0% is applicable. Silver has been converted assuming $4,500/oz gold and $75.00/oz silver TSX / NYSE: FNV 90 ★ Franco-Nevada Corporation United States
Rest of World Subika (Ahafo) Tasiast Sabodala Edikan Perama Hill Kiziltepe Sissingué Pandora Séguéla Tasiast Sabodala Séguéla Producing Advanced Producing (Energy) Guadalupe-Palmarejo Duketon Yandal (Bronzewing) Australia Wiluna South Kalgoorlie Rogozna Milpillas Producing Advanced Exploration Producing Advanced Exploration Mining Assets Precious Metals Diversified Mt Keith Rebecca Western Limb Bullabulling Aphrodite Agate Creek Franco-Nevada Corporation ★ 91 TSX / NYSE: FNV
G U A D A L U P E - P A L M A R E J O Producing Location: Mexico | Operator: Coeur Mining, Inc. | Precious Metals: Au | Stream: 50% Gold Since January 2009, Franco-Nevada has received 50% of the gold produced from the Palmarejo complex located in Chihuahua Province, Mexico which is owned and operated by Coeur Mining, Inc. (“Coeur”). 2025 2024 2023 Revenue to Franco ‑ Nevada ($ million) $ 177.3 $ 84.8 $ 66.8 M&I Resources (koz Au) 1 1,956 2,104 2,090 Inf. Resources (koz Au) 1 1,265 643 381 P&P Reserves (koz Au) 1 928 681 769 M&I Royalty Ounces (000s) 1,2 695 693 556 Inf. Royalty Ounces (000s) 2 245 184 110 P&P Royalty Ounces (000s) 2 373 236 209 1 Please refer to the tables on pages 126–134 for a breakout of grade and tonnages by Mineral Resource category; all M&I categories are inclusive of Mineral Reserves 2 For Royalty Ounce calculation, Franco-Nevada estimates 98% of the Mineral Reserves (97% in 2024, 92% in 2023), 76% of the exclusive M&I Mineral Resource (90% in 2024, 89% in 2023) and 47% of the Inf. Mineral Resource (80% in 2023, 98% in 2023) are subject to our 50% stream interest. The stream interest has been factored by 82% to reflect $4,500/oz gold ($2,800/oz gold in 2024, $1,950/oz gold in 2023) and $800/oz ongoing payments (71% in 2024, 59% in 2023) The Palmarejo complex, which includes mining of the Palmarejo, Guadalupe and Independencia ore bodies, principally produces silver with a considerable gold by-product. It started in 2009 as an open pit and underground mine and is now only an underground operation. Starting in 2009, a Mexican subsidiary of Franco-Nevada received 50% of the gold produced from Palmarejo in return for a $75 million investment. The original contract was terminated in 2014 and Coeur fulfilled its obligation under that agreement in the third quarter of 2016, once they delivered the minimum ounce obligation of 400 koz of gold. In June 2014, FNIC, a subsidiary of Franco-Nevada, entered into a new 50% gold stream with Coeur on the Palmarejo complex with ongoing payments equal to the lesser of $800/oz (no inflation provision) and the then prevailing spot price for gold for each ounce delivered under the new gold stream agreement. The new agreement improved mine economics for Coeur and helped extend the mine life of the entire Palmarejo complex. The agreement applies to a land position totaling over 1,200 km 2 although it does not cover the adjacent concessions that Coeur acquired through the acquisition of Paramount Gold and Silver Corp. In 2014. Franco-Nevada provided an upfront $22 million deposit which was used to partially fund the development of the Guadalupe underground mine on the Palmarejo property. Mineral Reserves and Mineral Resources grew significantly in 2025 net of depletion and extended the mine life to approximately 11 years. Exploration success at Palmarejo in 2025, increased year-over-year silver and gold Mineral Reserves by 40% and 36%, respectively. Franco-Nevada estimates that over 87% of the existing Mineral Resources and Mineral Reserves are covered by the stream agreement. Franco-Nevada sold 50,609 oz of gold from the mine in 2025, compared to 35,678 oz of gold in 2024. Palmarejo has a mill throughput capacity of 7 ktpd and in 2025, along with its principal silver production, produced 100,768 oz of gold. Coeur’s 2026 gold production guidance for Palmarejo is between 95–105 koz. In 2026, Franco-Nevada expects sales from the Guadalupe-Palmarejo stream to be between 47,500– 52,500 GEOs. Palmarejo Agua Salada Mill Guadalupe Mine Complex La Nación La Bavisa Zapata La Patria Independencia Mine Complex Independencia West Pacific Ocean NM TX CA AZ MEXICO Guadalupe-Palmarejo Gold Stream Perimeter of gold stream property Excluded from Stream Deposits Guadalupe- Palmarejo kilometer 4 0 N Independencia East Over 95% of reserves on stream ground Mineral Resources and Mineral Reserves replenished depleted ore Stream has significant leverage to the gold price The operator currently has a 11-year mine plan. M&I Resources could support production for 16 years and Inf. Resources for a further 6 years TSX / NYSE: FNV 92 ★ Franco-Nevada Corporation Rest of World
W E S T E R N L I M B Producing Location: South Africa | Operator: Sibanye Stillwater Limited | Precious Metals: Au & Pt | Stream: Gold and Platinum Stream / Royalty: NSR 1% (Pandora) In December 2024, FNIC announced a $500 million precious metals stream on specified production from Sibanye-Stillwater Western Limb PGM Mining Operations in South Africa (the “Western Limb”). 2025 2024 2023 Revenue to Franco ‑ Nevada ($ million) $ 70.3 $ − $ − M&I Resources (koz PGM) 4 179,400 182,600 − Inf. Resources (koz PGM) 4 39,000 39,000 − P&P Reserves (koz PGM) 4 35,900 34,000 − Stream M&I Royalty Ounces (000s) 4,5 1,059 1,055 − Stream Inf. Royalty Ounces (000s) 5 190 190 − Stream P&P Royalty Ounces (000s) 5 349 320 − NSR M&I Royalty Ounces (000s) 4,6 113 101 − NSR Inf. Royalty Ounces (000s) 6 10 9 − NSR P&P Royalty Ounces (000s) 6 3 3 − 1 Based on 2023 production per Sibanye-Stillwater’s public disclosure and total 2023 supply per Johnson Matthey PGM market report (May 2024) 2 Assuming current projections of 4E PGM production based on Reserves and Replacement Projects at consensus commodity prices at the time of announcement 3 The ongoing payments are subject to reduction in certain circumstances 4 Please refer to the tables on pages 126–134 for a breakout of grade and tonnages by Mineral Resource category; all M&I categories are inclusive of Mineral Reserves 5 For Royalty Ounce calculation for the stream, Franco-Nevada estimates P&P Royalty Ounces include payable metal of the remaining deliveries before 237,000 of gold and 294,000 of platinum, with the balance of Mineral Reserves subject to an 80% gold stream. For M&I Royalty Ounces, Franco- Nevada assumes the P&P Royalty Ounces with the balance of M&I Resources subject to the 80% gold stream. For Inf. Royalty Ounces, Franco-Nevada assumes Inf. Mineral Resources are subject to the 80% gold stream. Platinum ounces have been converted into Royalty Ounces assuming $4,500/oz Au and $2,000/ounce Pt ($2,800/oz Au and $950/ounce Pt in 2024) and Franco- Nevada estimates 95% of the Mineral Reserves, 97% of the M&I Mineral Resources and 99% of the Inf. Mineral Resources are subject to our stream interest. Gold and platinum ounces delivered will be subject to an ongoing payment of 5% of spot prices, respectively to Sibanye-Stillwater. In the case of gold, the ongoing payment will increase to 10% following the delivery of 237 koz of gold 6 For Royalty Ounce calculation for the 1% NSR on Pandora, Franco-Nevada estimates a rate of 1.0% is applicable to Mineral Resources and Mineral Reserves that are subject to the Pandora royalty ground. PGM ounces have been converted into Royalty Ounces assuming ($4,500/oz Au, $2,000/ounce Pt, $1,650/ounce Pd and $7,735/ounce Rh ($2,800/oz Au, $950/ounce Pt, $950/ounce Pd and $5,000/ounce Rh in 2024) Sibanye-Stillwater’s South African PGM mining operations are located in the Western Limb of the Bushveld Complex and are an essential source of PGMs, providing approximately 15% of global platinum supply¹. The operations produced approximately 1.6 Moz 4E PGMs in 2025, consistent with 2024. The operations benefit from extensive existing infrastructure consolidated through the merger of three prior operators, which has unlocked numerous synergies and consist of the Marikana, Rustenburg, and Kroondal operations and a total of 13 underground mines. The integrated operations include concentrators, a smelter and refining complex. Under the stream agreement, gold deliveries are initially referenced to aggregate platinum, palladium, rhodium and gold (“4E PGM”) ounces contained in concentrate. Franco-Nevada receives gold ounces equal to 1.1% of physical 4E PGM ounces contained in concentrate until delivery of 87,500 oz of gold, then 0.75% of 4E PGM ounces contained in concentrate until total delivery of 237 koz of gold, which is currently expected to occur in approximately 25 years. Thereafter, Franco-Nevada will receive 80% of gold contained in concentrate for the remaining LOM. Franco-Nevada receives platinum deliveries equal to 1.0% of platinum contained in concentrate until the delivery of 48 koz of platinum, then increase to 2.1% of platinum contained in concentrate until total delivery of 294 koz of platinum, after which there will be no further platinum deliveries. The stream GEO profile is comprised of approximately 70% gold and 30% platinum deliveries 2 at consensus commodity prices as of the date of transaction. Gold and platinum ounces delivered are subject to an ongoing payment of 5% of spot prices to Sibanye-Stillwater. In the case of gold, the ongoing payment will increase to 10% following completion of the 4E PGM link (after the delivery of 237 koz of gold to Franco-Nevada)³. The stream is referenced to production from an area which extends over 500 km 2 and has a mine life up to 2070 based on board approved ore Reserves and certain pre-feasibility and feasibility stage mechanized UG2 replacement projects being studied, which leverage existing infrastructure. The Siphumelele mechanised UG2 project was recently included in Mineral Reserves demonstrating the value being unlocked by these projects. In addition, the K4 shaft at Marikana is also successfully ramping up production (41% increase year-over-year) to 99,605 4E PGM ounces in 2025, moving Marikana down the cost curve. The stream transaction was closed on February 28, 2025, with an effective date of September 1, 2024. Franco-Nevada expects deliveries of gold and platinum ounces in 2026 from the Western Limb operations to be relatively consistent with 2025, where we received 16,933 oz of gold and 9,185 oz of platinum. Benefits from integrated and established infrastructure, including smelting Operations benefit from a unique and diversified basket of metals, supporting margins Large land package covering over 500 km² with Reserves representing only a small portion of the known 4E PGM Resources The operator currently has a 45-year mine plan. Extensive M&I resource to support potential mine life extensions Rustenburg N4 Rustenburg Kroondal Khuseleka Kwezl Thembelani Bathopele UG2 outcrop Merensky outcrop Kopaneng Siphumelele Bathopele OP Project Newman Project Kwezi Shallows Project Thembelani Deeps Project Siphumelele Project Markina Project Khuseleka Project Turk Project 4B Project Rowland Project Pandora Deeps Project K4 K3 K4 EPC EPL Base Metals Refinery Karee WLTR Marikana K1 K2 Retrofit Waterval Rowland W1 1E Lift 4B Newman Saffy E1 E2 E3 E4 Project Saffy Deeps Project Kroondal Deeps Project E3 Ext Simunye Bambanani K6 Marikana Schaapkraal Hoedspruit Pandora 1% NSR Western Limb Gold and Platinum Stream N kilometer 10 0 Project Area Refinery Concentrator Operational Shaft Prospecting license Mining license Area of Interest Siphumelele Newman Project Markina Project 4B Project Rowland Project Pandora Deeps Project K4 K3 K4 EPC EPL Base Metals Refinery Karee WLTR Marikana Rowland W1 1E Lift 4B Newman Saffy E1 E2 E3 E4 Project Saffy Deeps Project E3 Ext Marikana Schaapkraal Hoedspruit Pandora 1% NSR Western Limb Gold and Platinum Stream N kilometer 10 0 Project Area Refinery Concentrator Operational Shaft Prospecting license Mining license Kopaneng Siphumelele Newman Project Siphumelele Project Markina Project Turk Project 4B Project Rowland Project Pandora Deeps Project K4 K3 K4 EPC EPL Base Metals Refinery Karee WLTR Marikana K1 K2 Retrofit Rowland W1 1E Lift 4B Newman Saffy E1 E2 E3 E4 Project Saffy Deeps Project Kroondal Deeps Project E3 Ext Simunye Bambanani Marikana Schaapkraal Hoedspruit Pandora 1% NSR Western Limb Gold and Platinum Stream N kilometer 10 0 Project Area Refinery Concentrator Operational Shaft Prospecting license Mining license Area of Interest Franco-Nevada Corporation ★ 93 TSX / NYSE: FNV Rest of World
S U B I K A ( A H A F O ) Producing Location: Ghana | Operator: Newmont Corporation | Precious Metals: Au | Royalty: NSR: 2% Franco-Nevada has a 2% NSR royalty which covers a 78 km 2 area on the southern portion of Newmont’s Ahafo South mine in Ghana (shown in the schematic). Ahafo South is a separate mine from Newmont’s Ahafo North mine which is located 30 km to the north. 2025 2024 2023 Revenue to Franco ‑ Nevada ($ million) $ 45.4 $ 34.7 $ 19.4 M&I Resources (koz Au) 1 9,500 8,400 8,600 Inf. Resources (koz Au) 1 2,000 1,300 1,600 P&P Reserves (koz Au) 1 4,100 4,600 5,100 M&I Royalty Ounces (000s) 1,2 58 61 66 Inf. Royalty Ounces (000s) 2 12 9 12 P&P Royalty Ounces (000s) 2 39 51 63 1 Please refer to the tables on pages 126–134 for a breakout of grade and tonnages by Mineral Resource category; all M&I categories are inclusive of Mineral Reserves 2 For Royalty Ounce calculation, Franco-Nevada estimates 48% of Mineral Reserves (55% in 2024, 62% in 2023), 31% of the M&I Mineral Resources (36% in 2024, 38% in 2023) and 31% of the Inf. Resources (36% in 2024, 38% in 2023) are subject to our royalty interest and estimates an average rate of 2.0% is applicable The 2% NSR is payable on all ounces produced from the Rank (formerly Ntotoroso) concession. The majority of the Subika deposit, the northern portion of the Awonsu deposit, and the southern tip of the Amoma deposit fall within the Rank mining lease boundary. It is estimated that 48% of project reserves as of December 31, 2025, fall on Franco-Nevada’s royalty ground. In 2025, Ahafo South produced 664 koz of gold compared with 798 koz in 2024. Ahafo production in 2026 is expected to be 440 koz of gold, decreasing relative to 2025 as mining activities in the Subika open pit were completed as planned in Q3 2025. Newmont continues to increase its investment in exploration and advanced projects, including at the Subika underground. Exploration beneath the Subika open pit (majority on royalty ground) and Apensu open pit (not on royalty ground) continues to highlight the potential for the next phase of high grade underground growth at Ahafo South. This is expected to meaningfully extend the life of the Subika underground mine (majority on royalty ground), with additional upside from deeper and lateral extensions utilizing existing surface infrastructure and processing capacity. Subika, Ghana Subika (Ahafo) NSR: 2% N Note: not to scale Mina Justa Atlantic Ocean Burkina Faso Cote D’ivoire Togo Benin Nigeria Niger Mali Algeria Subika Ghana 2% NSR Awonsu Apensu Subika Plant and Offices Ntotoroso Amoma Kenyase FNV Royalties Deposits Estimate 48% of Ahafo South reserves fall on royalty ground Exploration success expected to extend the life of the Subika UG mine The operator currently has a 8-year mine plan. M&I Resources could support production for 22 years and Inf. Resources for a further 5 years TSX / NYSE: FNV 94 ★ Franco-Nevada Corporation Rest of World
T A S I A S T Producing Location: Mauritania | Operator: Kinross Gold Corporation | Precious Metals: Au | Royalty: NSR: 2% Franco-Nevada has a 2% NSR royalty on the Tasiast mine operated by Kinross. 2025 2024 2023 Revenue to Franco ‑ Nevada ($ million) $ 32.8 $ 30.5 $ 24.5 M&I Resources (koz Au) 1 6,797 7,070 6,985 Inf. Resources (koz Au) 1 2,377 1,632 1,504 P&P Reserves (koz Au) 1 4,401 4,705 5,055 M&I Royalty Ounces (000s) 1,2 136 141 140 Inf. Royalty Ounces (000s) 2 48 33 30 P&P Royalty Ounces (000s) 2 88 94 101 1 Please refer to the tables on pages 126–134 for a breakout of grade and tonnages by Mineral Resource category; all M&I categories are inclusive of Mineral Reserves 2 For Royalty Ounce calculation, Franco-Nevada estimates 100% of the Mineral Resources and Mineral Reserves are subject to our royalty interest and estimates a rate of 2.0% is applicable Kinross acquired Tasiast in September 2010 through its acquisition of Red Back Mining Inc. The royalty originally covered three large permit areas in Mauritania, West Africa and covers the Tasiast main trend, including the Fennec satellite pit, and Tasiast Sud. In 2025, Tasiast produced 503,429 oz of gold, down from 622,394 oz in 2024, due to planned lower grades and mine sequencing. Kinross expects 2026 production to be approximately 505,000 oz of gold and estimates 2027 production will remain around the 500,000 ounce level based on ongoing mine plan optimizations. Production from 2025 through 2027 is lower than 2024 primarily due to the stripping phase of West Branch 5. The current mine plan sees Tasiast running until 2035, which will include the processing of low-grade stockpiles on the back end of the mine life. Kinross is actively evaluating several technical and strategic pathways to extend the Tasiast mine life beyond 2035, with a primary focus on underground mining at the West Branch orebody and future open pit pushbacks at both West Branch and the Piment zones. Potential new growth projects targeting the post-2030 period include a West Branch 6 layback, regional satellite open pits, and bulk-tonnage underground mining. Exploration continues to demonstrate significant long-term potential for underground extensions and satellite deposits, with Kinross advancing technical studies across multiple targets. In 2025, approximately 44,000 metres of drilling were completed, primarily targeting depth extensions of the West Branch orebody, where recent results have extended mineralization to at least 1.8 kms along strike and down plunge. At the Fennec satellite deposit on the TMLSA license, drilling in 2024 and 2025 continued to add reserves and improve geological definition. Additional exploration remains ongoing on the SENISA licenses, where 51,135 metres were drilled through year end 2024. Franco-Nevada’s royalty covers both the TMLSA and SENISA license areas. Tasiast, Mauritania Tasiast Mauritania Mali Senegal Algeria Atlantic Ocean N kilometer 10 0 Tasiast NSR: 2% Tasiast Main Trend Plant Site Tasiast Sud 2% NSR Tasiast Mining License Tasiast License Area, March 2012 Tasiast Sud Gold Prospects Resource/Reserve Target Trends FNV Royalties Bulk-tonnage underground and open pit satellite potential to extend mine life Prospective 75 km long greenstone belt The operator currently has a 10-year mine plan. M&I Resources could support production for 13 years and Inf. Resources for a further 5 years Franco-Nevada Corporation ★ 95 TSX / NYSE: FNV Rest of World
S A B O D A L A Producing Location: Senegal | Operator: Endeavour Mining Corporation | Precious Metals: Au | Stream: Fixed gold deliveries / 6% Gold Stream In December 2013, FNIC, provided Teranga Gold Corporation (“Teranga”) with a $135 million deposit to fund the acquisition by Teranga of additional future ore sources for its Sabodala mill. 2025 2024 2023 Revenue to Franco ‑ Nevada ($ million) $ 32.6 $ 22.6 $ 18.3 M&I Resources (koz Au) 1 5,190 5,186 6,333 Inf. Resources (koz Au) 1 1,766 1,322 1,380 P&P Reserves (koz Au) 1 2,768 3,260 4,086 M&I Royalty Ounces (000s) 1,2 99 95 111 Inf. Royalty Ounces (000s) 2 47 35 31 P&P Royalty Ounces (000s) 2 44 52 60 1 Please refer to the tables on pages 126–134 for a breakout of grade and tonnages by Mineral Resource category; all M&I categories are inclusive of Mineral Reserves 2 For Royalty Ounce calculation, Franco-Nevada accounts for the balance of the Fixed Delivery Period of 105,750 ounces. In 2025, Franco-Nevada estimates 45% of the remaining Mineral Reserves (45% in 2024, 47% in 2023), 46.5% of the remaining M&I Mineral Resources (46.5% in 2024, 47% in 2023) and 55.5% of the remaining Inf. Mineral Resources (55.5% in 2024, 47% in 2023) at the Sabodala-Massawa Complex are subject to a rate of 4.8% (6.0% gold stream which is factored by 80% to estimate equivalent Royalty Ounce rate) With the acquisition, Teranga was able to expand its land package to over 950 km 2 including much of a 70 km prospective greenstone belt. In February 2021, Endeavour Mining Corporation (“Endeavour”) acquired Teranga. Over the first six years following the stream acquisition, Teranga delivered 22,500 oz of gold annually to Franco-Nevada, under a fixed arrangement, for a total of 135 koz of gold delivered. The fixed delivery period was fulfilled in December 2019, and between January 2020 and August 2020, Franco-Nevada received 6% of the gold produced from either the Sabodala or Oromin Joint Venture (“OJVG”) properties. In December 2019, Teranga announced an agreement to acquire the adjacent Massawa gold project and commenced processing ore from the project in 2020. Franco-Nevada’s stream does not extend to the Massawa gold project area. In September 2020, Franco-Nevada amended its existing Sabodala gold purchase and sale agreement with Teranga to compensate for displacement from the processing of Massawa ore through the Sabodala processing facilities and to provide for the commingling of Sabodala and Massawa ores. The amended agreement provides that commencing in September 2020, Teranga, now Endeavour, will make fixed deliveries of 783.33 oz of refined gold per month until 105,750 oz of gold have been delivered to Franco-Nevada (the “Fixed Delivery Period”) and 6% of production from the stream area thereafter. Following the Fixed Delivery Period, which is expected to end in October 2031, a reconciliation will be performed to determine if Franco-Nevada would have received more or less than 105,750 oz of gold under the 6% variable stream during such period. Endeavour will be entitled to a credit for an over-delivery which will be applied against the 6% variable stream until depleted and Franco-Nevada will be entitled to a one-time additional delivery in the case of an under-delivery. Franco-Nevada will make ongoing payments for each ounce of gold delivered equal to 20% of the spot gold price. In 2025, Sabodala-Massawa produced 273,533 oz of gold, with the majority produced from Massawa. Endeavour’s 2026 production guidance for Sabodala-Massawa is between 260–305 koz of gold. To date production from Sabodala has been less than the fixed ounces delivered to Franco-Nevada. kilometer 2.5 0 N Sabodala Gold Stream OJVG Concession Sabodala Concession Deposits Senegal Mali Mauritania Sabodala Dakar Guinea Atlantic Ocean 10 kilometres from mill Mill OJVG Sabodala Sabodala West Golouma Deposits Masato Deposit Niakafiri Deposit Sabodala Pit Tailings Gora Deposit Fixed gold deliveries per year until 2031, and thereafter 6% of gold production from Sabodala concessions Land package offers significant exploration potential The operator currently has a 7-year mine plan. M&I Resources could support production for 19 years and Inf. Resources for a further 6 years TSX / NYSE: FNV 96 ★ Franco-Nevada Corporation Rest of World
* Additional royalty lands to south not shown due to scale. Baneygo Erlistoun King John Garden Well Dogbolter Gloster Moolart Well Petra Rosemont Reichelts Find Russells Find Tooheys Well 2% NSR 2% NSR Perth Port Hedland Kalgoorlie Norseman Kambalda N Duketon BRAZIL BOLIVIA PARAGUAY Current Royalty Tenements Original Royalty Tenements Deposits Excluded from Royalty N kilometer 30 0 Duketon 2% NSR D U K E T O N Producing Location: Australia | Operator: Regis Resources Ltd. | Precious Metals: Au | Royalty: NSR: 2% Franco-Nevada has a 2% NSR royalty encompassing 2,678 km 2 of the Duketon gold project in Western Australia. 2025 2024 2023 Revenue to Franco ‑ Nevada ($ million) $ 10.6 $ 10.5 12.0 M&I Resources (koz Au) 1 2,590 1,790 1,850 Inf. Resources (koz Au) 1 680 680 610 P&P Reserves (koz Au) 1 1,082 798 950 M&I Royalty Ounces (000s) 1,2 42 31 31 Inf. Royalty Ounces (000s) 2 11 12 11 P&P Royalty Ounces (000s) 2 18 14 17 1 Please refer to the tables on pages 126–134 for a breakout of grade and tonnages by Mineral Resource category; all M&I categories are inclusive of Mineral Reserves 2 For Royalty Ounce calculation, Franco-Nevada estimates 85% (89% in 2024, 88% in 2023) of Mineral Reserves and 81% of the Mineral Resources (84% in 2023, 84% in 2023) are subject to our royalty interest and estimates a rate of 2.0% is applicable The project, operated by Regis Resources Ltd. (“Regis”), comprises six active mines and several satellite deposits at various stages of development. The royalty extends to all identified Mineral Resources and Mineral Reserves, with the exception of the Gloster, Ben Hur, King of Creation and Anchor satellite deposits, as well as portions of the Erlistoun, Dogbolter and Petra satellite deposits. Franco-Nevada estimates that 85% of Duketon reserves and and 81% of Duketon resources are subject to Franco-Nevada’s royalty. Regis reported gold production of 233,315 ounces in 2025 and has issued guidance of 220–240 koz for the fiscal year ending June 30, 2026. In 2025, approximately 68% of total Duketon production was subject to Franco-Nevada’s royalty, with a comparable portion anticipated for 2026. The Duketon operations feature three mills–Moolart Well, Garden Well, and Rosemont–with a combined processing capacity of 10 Mtpa. Ore is sourced primarily from the Garden Well and Rosemont underground mines, as well as the King of Creation open pit. Multiple low-grade stockpiles supplement feed to all three mills. Production guidance 220–240 koz of gold for year ending June 30, 2026 Annual reserve updates continue to extend mine life M&I Resources could support production for 11 years and Inf. Resources for a further 3 years Franco-Nevada Corporation ★ 97 TSX / NYSE: FNV Rest of World
S O U T H K A L G O O R L I E Producing Location: Australia | Operator: Northern Star Resources Limited | Precious Metals: Au | Royalty: NSR: 1–4% Northern Star Resources Limited (“Northern Star”) operates the South Kalgoorlie Operation (“SKO”) which has maintained continuous gold production since 1989. 2025 2024 2023 Revenue to Franco ‑ Nevada ($ million) $ 12.5 $ 10.5 $ 6.2 M&I Resources (koz Au) 1 1,992 4,930 1,338 Inf. Resources (koz Au) 1 1,162 2,540 894 P&P Reserves (koz Au) 1 714 1,546 320 M&I Royalty Ounces (000s) 1,2 80 63 46 Inf. Royalty Ounces (000s) 2 46 33 31 P&P Royalty Ounces (000s) 2 29 20 12 1 Please refer to the tables on pages 126–134 for a breakout of grade and tonnages by Mineral Resource category; all M&I categories are inclusive of Mineral Reserves 2 For Royalty Ounce calculation, Franco-Nevada estimates 100% of Mineral Resources and Mineral Reserves (32% in 2024) are subject to our royalty interest and estimates a rate of 4.0% is applicable for Mineral Resources and Mineral Reserves SKO is situated 15 kms south of Kalgoorlie in Western Australia. Franco-Nevada holds a net smelter return royalty ranging from 1.75% to 4% on gold, and 1% to 2.25% on other minerals, covering 470 km 2 of SKO tenements. This includes the HBJ underground mine, the Mt Marion and Pernatty satellite deposits. While historically production from SKO was processed through the 1.2 Mtpa Jubilee Mill, Northern Star placed the Jubilee Mill on care and maintenance in July 2022, redirecting ore to the Kanowna Belle processing facilities. Effective January 1, 2023, the royalty agreement was amended, increasing the royalty rate on the HBJ underground mine from 1.75% to 4%. Northern Star consolidates reporting for SKO with the Kanowna Belle gold mine, and reported combined gold production of 168,545 ounces at the Kalgoorlie Operations for the year ended December 31, 2025. Franco-Nevada estimates that royalty-eligible production represents approximately 54% of the total output from these operations. In 2025, Franco-Nevada received $12.5 million in royalty revenue from SKO. Exploration efforts continue, highlighted by the Hercules discovery announced in May 2023, located 20 kms west of the HBJ mine on tenements subject to a 1.75% royalty payable to Franco-Nevada. In May 2025, Northern Star announced a maiden Mineral Resource of 916 koz at Hercules (13.4 Mt at 2.1 g/t), along with a Mineral Reserve of 246 koz (2.4 Mt at 3.1 g/t). SKO reserves total 714 koz of gold and resources total 3,154 koz of gold. 916 koz of gold maiden Mineral Resource at Hercules Expect steady production to continue from HBJ underground mine M&I Resources could support production for 22 years and Inf. Resources for a further 13 years TSX / NYSE: FNV 98 ★ Franco-Nevada Corporation Rest of World
S É G U É L A Producing Location: Côte d’Ivoire | Operator: Fortuna Mining Corp. | Precious Metals: Au | Royalty: NSR: 0.6% Franco-Nevada holds a 0.6% NSR on the Séguéla gold mine, owned and operated by Fortuna Mining Corp. (“Fortuna”). 2025 2024 2023 Revenue to Franco ‑ Nevada ($ million) $ 2.9 $ 2.2 $ 1.4 M&I Resources (koz Au) 1 2,004 1,412 1,535 Inf. Resources (koz Au) 1 736 677 245 P&P Reserves (koz Au) 1 1,543 1,016 1,154 M&I Royalty Ounces (000s) 1,2 12 8 9 Inf. Royalty Ounces (000s) 2 4 4 2 P&P Royalty Ounces (000s) 2 9 6 7 1 Please refer to the tables on pages 126–134 for a breakout of grade and tonnages by Mineral Resource category; all M&I categories are inclusive of Mineral Reserves 2 For Royalty Ounce calculation, Franco-Nevada estimates 100% of the Mineral Resources and Mineral Reserves are subject to our royalty interest and estimates a rate of 0.6% is applicable (0.6% in 2024, 0.6% in 2023) In March 2021, Franco-Nevada acquired a 1.2% NSR on the license covering the Séguéla gold mine in Côte d’Ivoire from Roxgold Inc. (“Roxgold”). Fortuna acquired Roxgold in July 2021 and achieved first gold at Séguéla in 2023. The royalty included a 50% buyback option, which Fortuna exercised in March 2024. A feasibility study in 2021 outlined a 9-year mine life averaging 120 kozpa of gold. Séguéla produced 152,426 ounces of gold in 2025 compared with 137,781 ounces in 2024 and is expected to produce between 160–170 koz in 2026. As of December 31, 2025, Séguéla has P&P Mineral Reserves of 1.54 Moz of gold (15.96 Mt at 3.01 g/t), in addition to exclusive Indicated Resources of 461 koz of gold (5.16 Mt at 2.78 g/t) and Inf. Resources of 736 koz of gold (9.17 Mt at 2.50 g/t). Year-over-year, Mineral Reserves increased by 31%, primarily due to the first-time estimation of underground Mineral Reserves at the Sunbird deposit totaling 401 koz (3.50 Mt at 3.60 g/t). The 2026 brownfields exploration budget for Séguéla is $12 million. This includes approximately 69,000 meters of drilling to upgrade resources primarily at the Sunbird underground project and for infill and expansion drilling at the Kingfisher deposit, along with continued target generation, which is all on royalty ground. Fortuna is expecting a plant expansion study in May 2026 to potentially increase production from approximately 165–200 kozpa of gold. Séguéla 0.6% NSR kilometer 5 0 N Ancien Agouti Boulder Winy Gabbro W Antenna South Antenna North Antenna West P1 Kwenko Siakasso N P7 P2 Kwenko W Koula Antenna Sunbird Schist Resource Pit Target Target Strat Séguéla NSR Area Pelite Kingfisher Sunbird Underground maiden Mineral Reserve adds 401 koz of gold Exploration upside on land package covered by royalty Potential plant expansion being studied The operator currently has a 9-year mine plan. M&I Resources could support production for 12 years and Inf. Resources for a further 4 years Franco-Nevada Corporation ★ 99 TSX / NYSE: FNV Rest of World
E D I K A N Producing Location: Ghana | Operator: Perseus Mining Limited | Precious Metals: Au | Royalty: NSR: 1.5% In 2011, Franco-Nevada acquired an effective 1.5% NSR royalty on Perseus Mining Limited’s (“Perseus”) Edikan gold mine within the Ashanti Gold Belt in Ghana, which includes two mining leases of approximately 93 km 2 . 2025 2024 2023 Revenue to Franco ‑ Nevada ($ million) $ 7.3 $ 7.1 $ 6.1 M&I Resources (koz Au) 1 1,265 1,306 1,634 Inf. Resources (koz Au) 1 336 280 283 P&P Reserves (koz Au) 1 629 506 771 M&I Royalty Ounces (000s) 1,2 19 20 25 Inf. Royalty Ounces (000s) 2 5 4 4 P&P Royalty Ounces (000s) 2 9 8 12 1 Please refer to the tables on pages 126–134 for a breakout of grade and tonnages by Mineral Resource category; all M&I categories are inclusive of Mineral Reserves 2 For Royalty Ounce calculation, Franco-Nevada estimates 100% of the Mineral Resources and Mineral Reserves are subject to our royalty interest and estimates a rate of 1.5% is applicable Edikan is a large-scale, low-grade multi open pit operation, which began commercial production in 2012 with ore being processed through a centralized processing facility. Edikan produced 151,741 oz of gold in 2025, down from 193,066 oz in 2024. Perseus has set a production target of 154–169 koz for their 2026 financial year, which ends June 30, 2026. Perseus has also guided 720–750 koz of gold production over 5-years, as of June 2025, and announced that the mine life for Edikan could extend to 2032 with diversified ore sources in the plan. It is expected that approximately 60% of the metal production in the June 2025 five year plan will come from Edikan, with the remainder coming from the Nkosuo claims. Mining at the Nkosuo prospect, located approximately 10 km from the Edikan mill and not covered by Franco- Nevada’s royalty, commenced in Q4 2024. While this ore is processed at the Edikan mill to increase project life, the operator remains focused on new exploration targets and resource conversion within trucking distance that could potentially fall on royalty ground. Plans to mine cutbacks of the Fetish and Esuajah North pits, both which are covered by the royalty, are currently progressing with applications submitted to the relevant regulators for approval to commence mining at both areas. An updated feasibility study is also underway for the Esuajah South underground deposit, which is covered by the royalty and included in the current five year plan. Edikan, Ghana Exploration License Mining License and Royalty Area Deposit Accra Edikan Ghana N kilometer 10 0 Edikan 1.5% NSR Ayanfuri Mine Licenses Mill Site Esuajah South Esuajah North Fetish Chirawewa Ataasi Mampon Abnabna Fobinso Dadieso 1.5% NSR Exploration potential to further extend current mine life The operator currently has a 7-year mine plan. M&I Resources could support production for 13 years and Inf. Resources for a further 3 years TSX / NYSE: FNV 100 ★ Franco-Nevada Corporation Rest of World
Y A N D A L ( B R O N Z E W I N G ) Producing Location: Australia | Operator: Northern Star Resources Limited. | Precious Metals: Au | Royalty: NSR: 1.5–2% Bronzewing is situated within the Yandal Greenstone Belt in Western Australia. Franco-Nevada’s royalty encompasses 590 km 2 covering all identified Mineral Resources. 2025 2024 2023 Revenue to Franco ‑ Nevada ($ million) $ 2.5 $ 1.1 $ 0.5 M&I Resources (koz Au) 1 4,029 3,764 3,882 Inf. Resources (koz Au) 1 636 468 518 P&P Reserves (koz Au) 1 1,962 2,143 2,320 M&I Royalty Ounces (000s) 1,2 38 35 36 Inf. Royalty Ounces (000s) 2 6 4 5 P&P Royalty Ounces (000s) 2 17 19 20 1 Please refer to the tables on pages 126–134 for a breakout of grade and tonnages by Mineral Resource category; all M&I categories are inclusive of Mineral Reserves 2 For Royalty Ounce calculation, Franco-Nevada estimates 47% of Mineral Resources and Mineral Reserves (47% in 2024, 47% in 2023) are subject to our royalty interest and estimates a rate of 2.0% is applicable Between 1994 and 2004, Bronzewing produced 2.19 Moz of gold from multiple open pit and underground deposits, followed by an additional 0.19 Moz from open pit operations between 2010 and 2013. Ownership of the project has changed on several occasions since 2013. Most recently, Northern Star Resources acquired Bronzewing in November 2019 through a A$193 million take over. Subsequently, Northern Star invested A$180 million to expand the Thunderbox Mill’s capacity from 3.0–6.0 Mtpa. The expansion was completed in December 2022. Northern Star’s Thunderbox Operations comprise ore from both Bronzewing/Orelia (royalty ground) and Thunderbox/Bannockburn (not royalty ground) being treated through the Thunderbox Mill. Mining activities recommenced at Bronzewing in April 2023 with ore being extracted from the Orelia open pit gold deposit and transported 100 km south to the Thunderbox Mill for processing. In 2025, Northern Star reported total gold production of 222,160 oz at Thunderbox Operations, with approximately 16% of this production subject to Franco-Nevada’s royalty. Franco-Nevada received $2.5 million in royalty revenue from Bronzewing in 2025. Franco-Nevada estimates that 44% of reserves and 47% of resources at Thunderbox Operations are subject to Franco- Nevada’s royalty. The Yandal project also includes the Julius deposit, where Franco-Nevada holds a 1.5% NSR royalty under a separate agreement. In 2021, Northern Star developed Julius as a satellite deposit to the Jundee Gold Mine. Mining ceased at Julius in June 2022, although some stockpile ore remains. Franco-Nevada received $0.3 million in royalty revenue from Julius in 2025. Yandal (Bronzewing) 1.5–2% NSR kilometer 10 0 N Current Royalty Tenements Excluded from Royalty Perth Port Hedland Kalgoorlie Wiluna Leinster Norseman Kambalda Yandal N BRAZIL BOLIVIA PARAGUAY Orelia Operating mine Ore transported and processed at a central mill M&I Resources could support production for 18 years and Inf. Resources for a further 3 years Franco-Nevada Corporation ★ 101 TSX / NYSE: FNV Rest of World
Kiziltepe, Türkiye W I L U N A Producing Location: Australia | Operator: Wiluna Mining Corporation Limited | Precious Metals: Au | Royalty: NSR: 3.6% Franco-Nevada holds a 3.6% NSR royalty on all gold production from the Wiluna Gold Project in Western Australia, encompassing the entire 1,150 km 2 property. Discovered in 1896, Wiluna has yielded more than 4.0 Moz of gold to date, with production occurring almost continuously from 1987 through 2022. The site features a 2.1 Mtpa CIL treatment plant and has processed ore from multiple open pit and underground deposits. Wiluna Mining Corporation Limited (“WMC”) commissioned a 750 ktpa Sulphide Ore Concentrate Plant in 2021; however, WMC entered Voluntary Administration on July 20, 2022. Mining activities ceased on December 14, 2022, while stockpile processing extended until February 2023. Wiluna gold resources total 7.0 Moz and gold reserves total 345 koz. Franco-Nevada entered into a Forbearance and Convertible Note Deed with the Administrators of WMC in August 2023. Under this agreement, royalty payments continue to accrue to Franco-Nevada from August 2023 to December 2024, but Franco-Nevada agreed not to enforce its rights under the royalty agreement while WMC seeks to recapitalize and relist on the ASX. Royalty payments resumed on January 1, 2025. Throughout 2025, small-scale tailings reprocessing took place to help offset ongoing care and maintenance expenses. Wiluna’s total gold production in 2025 amounted to 20,932 oz and Franco-Nevada received $4.2 million of royalty revenue from Wiluna in 2025. WMC’s Voluntary Administration concluded on December 31, 2025 and control transitioned to WMC’s board of directors. M&I Resources could support production for 25 years and Inf. Resources for a further 34 years For Royalty Ounce calculation, Franco-Nevada estimates 100% of Mineral Resources and Mineral Reserves are subject to our royalty interest and estimates a rate of 3.6% is applicable K I Z I L T E P E Producing Location: Türkiye | Operator: Zenit Madencilik San. ve Tic. A.S. | Precious Metals: Au & Ag | Royalty: NSR: 2.5% Franco-Nevada has a 2.5% NSR on the Kiziltepe gold-silver mine located in Türkiye which started production in 2017. Kiziltepe is operated by Zenit Madencilik San. ve Tic. A. Ș ., a joint venture owned by Özaltın Holding A. Ş . (53%), Ariana Resources PLC (23.5%), and Proccea Construction Co. (23.5%). Zenit operates both the Kiziltepe and Tav ş an mines; however, Tav ş an is not subject to Franco-Nevada’s royalty. During 2024 to 2025, ore from both Kiziltepe and Tav ş an was processed through the Kiziltepe processing plant. The Kiziltepe mine produced 20,866 oz of gold in 2024. In 2025, combined production from the Kiziltepe and Tav ş an mines totaled 19,517 oz of gold and 70,673 oz of silver. Franco-Nevada estimates that approximately 60% of 2025 production was sourced from Kiziltepe. Starting in 2026, Tav ş an has operated as a standalone heap leach facility and no further production is expected at Kiziltepe. Further exploration is ongoing, with potential mine life extensions across multiple vein systems covered by Franco-Nevada’s royalty. For Royalty Ounce calculation, Franco-Nevada estimates 100% of the Mineral Resources and Mineral Reserves are subject to our royalty interest and estimates a rate of 2.5% is applicable TSX / NYSE: FNV 102 ★ Franco-Nevada Corporation Rest of World
P A N D O R A Producing Location: South Africa | Operator: Sibanye Stillwater Limited | Precious Metals: PGM | Royalty: NSR: 1% Franco-Nevada’s 1% Pandora NSR covers part of Sibanye-Stillwater’s Marikana operations within their Western Limb PGM Mining Operations in South Africa. In February 2025, the 5% net profit interest previously held by Franco-Nevada on the Pandora property was converted to a 1% net smelter return royalty, with an effective date of January 1, 2025. Sibanye-Stillwater’s Pandora property forms a portion of its Marikana operations and is 100% owned following its acquisition of Lonmin plc (“Lonmin”) in June 2019 and includes the currently operating E3 decline. The royalty ground includes extensive underground resources. Sibanye-Stillwater has identified a number of projects in various stages of pre-feasibility and feasibility studies which have the potential to meaningfully extend the mine life and substantially increase production levels from the royalty ground. These projects include an extension of the E3 decline and development of the E4 project that would substantially increase production levels. In addition, some ore that would likely be accessed longer term from the Saffy shaft also fall on the royalty ground. For Royalty Ounce calculation, please refer to page 93 for the Western Limb table, map and notes which includes the 1% NSR on Pandora S I S S I N G U É Producing Location: Côte d’Ivoire | Operator: Perseus Mining Limited | Precious Metals: Au | Royalty: NSR: 0.5% In 2013, Franco-Nevada acquired a 0.5% NSR on tenements that comprise the Sissingué gold project located in Côte d’Ivoire operated by Perseus. The project is comprised of the Sissingué Gold Mine (“SGM”) and the satellite deposits Fimbiasso and Bagoé, located approximately 40 kilometres from the Sissingué processing facilities. Franco-Nevada’s royalty covers SGM, which includes the Airport West target, but does not cover the Fimbiasso and Bagoé claims. Perseus commenced commercial gold production in 2018 and reported 2025 calendar year production from Sissingué of 53,411 ounces of gold. Perseus has set a production target of 78–87 koz of gold for their 2026 financial year, which ends June 30, 2026, and has also guided 265–275 koz of gold production in their five-year outlook, as of June 2025. It is expected that approximately 55% of the metal production in the June 2025 five-year plan will come from Sissingué, with the remainder coming from the Fimbiasso and Bagoé claims. As of February 2026, Perseus announced that the mine life for Sissingué could extend to 2030. This would include continued mining at Sissingué Stage 4, commencement of new mining areas at Bagoé and Airport West in 2026, and the Sissingué Stage 5 cutback in 2027. Production in the latter years was forecast to come primarily from the Fimbiasso and Bagoé satellite deposits, which is not covered by Franco-Nevada’s royalty. At the Sissingué Gold Mine and Fimbiasso Satellite Pits, ongoing exploration continues to identify extensions to existing mineral deposits and other prospects that have significant potential to extend the life of the Sissingué operation. Recent drilling has focused on resource definition and infill programs at Airport West and the Sissingué Main Pit, with approximately 3,000 meters of RC and diamond drilling completed in the 2025 reporting period. Grade control drilling at the Sissingué Main Pit has continued to discover additional material, though mining of narrow structures has led to higher dilution and lower grades than predicted by block models. For Royalty Ounce calculation, Franco-Nevada estimates 100% of Mineral Resources and Mineral Reserves at Sissingué are subject to our royalty interest and estimates a rate of 0.5% is applicable Franco-Nevada Corporation ★ 103 TSX / NYSE: FNV Rest of World
R E B E C C A Advanced Location: Australia | Operator: Ramelius Resources | Precious Metals: Au | Royalty: NSR: 1.5% The Rebecca Gold project is situated in Western Australia, approximately 150 km east of Kalgoorlie. Franco-Nevada’s 1.5% NSR royalty encompasses a 160 km 2 area, which includes all Rebecca Mineral Resources. Ramelius Resources completed a Definitive Feasibility Study (DFS) for the Rebecca Gold Project in October 2025, and the Board approved Final Investment Decision. The DFS outlines plans for a 3.25 million tonne per annum processing plant located adjacent to the Rebecca deposit, with total preproduction development costs estimated at A$340 million. The project is forecast to deliver 1,086 koz over a nine-year mine life, with 730 koz sourced from the Rebecca deposits. First gold production forecast to commence in Q4 2028. Franco-Nevada’s royalty excludes the Roe deposits. The operator currently has a 9-year mine plan. For Royalty Ounce calculation, Franco-Nevada estimates 100% of Mineral Resources and Mineral Reserves are subject to our royalty interest and estimates a rate of 1.5% is applicable P E R A M A H I L L Advanced Location: Greece | Operator: Eldorado Gold Corporation | Precious Metals: Au | Royalty: NSR: 2% Franco-Nevada has a 2% NSR on the Perama Hill project held by Eldorado Gold Corporation (“Eldorado”). The Perama Hill gold project is located in the Thrace region of northeastern Greece and consists of two mining titles covering an area of 19 km 2 and two mining exploration licenses covering an area of 18 km 2 . Perama Hill has an estimated gold Mineral Reserve of 912 koz (8.9 Mt at 3.18 g/t) and contemplates operating as a small open pit mine using a conventional carbon-in-leach gold recovery circuit. The Mineral Reserve supports an 8-year mine plan, producing approximately 100 koz of gold per year. The project also has an additional estimated Inf. Mineral Resource of 2.1 Moz (31.8 Mt at 2.10 g/t). Eldorado has reported that Perama Hill is the next mine it expects to develop in Greece after the Skouries project and that construction could commence as early as 2027. Exploration potential in the region supports opportunities for growth and project optimization and studies are ongoing to prepare for permitting documentation. The EIA was submitted in 2025 and approval is expected by year-end 2026, with community engagement well underway to ensure transparent dialogue and incorporate stakeholder feedback. For Royalty Ounce calculation, Franco-Nevada estimates 100% of Mineral Resources and Mineral Reserves are subject to our royalty interest and estimates a rate of 2.0% is applicable. Silver has been converted assuming $4,500/oz gold and $75.00/oz silver M I L P I L L A S Producing Location: Mexico | Operator: Industrias Peñoles, S.A.B. de C.V. | Metals: Cu | Royalty: Production Payment Franco-Nevada has a production payment royalty on the Milpillas copper mine in Sonora, Mexico operated by Industrias Peñoles, S.A.B. de C.V. (“Peñoles”). The royalty is $0.04/lb of copper produced, if the price of copper is above $1.20/lb. The royalty ground totals an estimated 30 km 2 and covers an underground copper mine and heap leach operation. The royalty was acquired by Franco-Nevada in September 2020 as part of a portfolio of 24 royalties from Freeport-McMoRan Inc. In 2025 Franco-Nevada received $0.96 million in royalty payments from Milpillas. As of December 2024, Milpillas had an estimated mine life of 2 years and a Mineral Reserve of 68,250 tonnes of copper (3.5 Mt at 1.95% copper). Franco-Nevada has not included Milpillas in Royalty Ounce estimates TSX / NYSE: FNV 104 ★ Franco-Nevada Corporation Rest of World
A G A T E C R E E K Advanced Location: Australia | Operator: Savannah Goldfields Limited | Precious Metals: Au | Royalty: NSR: 1% The Agate Creek Gold project is situated in Queensland, approximately 200 km west of Townsville. Franco-Nevada’s 1% NSR encompasses a 293 km 2 area, which includes all Agate Creek Mineral Resources. Savannah Goldfields Ltd (“Savannah”) has applied to amend the Agate Creek Environmental Authority and plans to resume mining at Agate Creek in Q2 2026 following receipt of the updated environmental authority. Agate Creek has an estimated Mineral Resource of 422 koz (15.5 Mt at 0.8 g/t) and an estimated Mineral Reserve of 36 koz (0.5 Mt at 2.5 g/t). Savannah will process Agate Creek ore at its 0.2 million tonne per annum Georgetown processing facility located 90 km north of Agate Creek. There was no production from Agate Creek in 2025. For Royalty Ounce calculation, Franco-Nevada estimates 100% of Mineral Resources and Mineral Reserves are subject to our royalty interest and estimates a rate of 1.0% is applicable M T K E I T H Advanced Location: Australia | Operator: BHP Group Limited | Metals: Ni | Royalty: NPI: 0.25% / GR: 0.375% Franco-Nevada holds a 0.375% gross royalty and a 0.25% NPI royalty on properties encompassing the Mt Keith nickel operation in Western Australia, situated 450 km north of Kalgoorlie. These royalties extend across 236 km 2 , covering the entirety of Mt Keith, the Jericho Nickel deposit (approximately 25 km northwest of Mt Keith), and portions of the Yakabindie deposits (approximately 25 km south of Mt Keith). The Mt Keith open pit was actively mined from 1993 until October 2024, when BHP suspended all Western Australia Nickel operations due to low nickel prices (BHP intends to review the decision in February 2027). The Mt Keith concentrator processes approximately 11 Mt of ore per year, achieving 70% recoveries. Annual production capacity ranges from 35–40 kt of nickel in concentrate. A total of 4.1 Mt of contained nickel resources remain at Mt Keith, Jericho, and Yakabindie. Franco-Nevada’s royalty covers approximately 60% of total resources (100% of Mt Keith and Jericho and 25% of Yakabindie). For Royalty Ounce calculation, Franco-Nevada estimates 100% of the Mineral Resources and Mineral Reserves are subject to our royalty interest and estimates a rate of 0.50% is applicable. Franco-Nevada has also applied an NSR smelting charge of 30%. Nickel has been converted to Royalty Ounces assuming $7.39/lb ($7.89/lb in 2024, $7.89/lb in 2023) A P H R O D I T E Advanced Location: Australia | Operator: Genesis Minerals Limited | Metals: Au | Royalty: GR: 2.5% The Aphrodite Gold project is situated in Western Australia, approximately 65 km north of Kanowna Belle. Franco-Nevada’s 2.5% GR encompasses a 29 km 2 area, which includes all Aphrodite Mineral Resources. In 2023 Genesis Minerals Limited (“Genesis”) purchased a group of assets, including Aphrodite, for A$ 600 million. Aphrodite has an estimated Mineral Resource of 1.6 Moz (23 Mt at 2.2 g/t). Previous owners contemplated operating Aphrodite as an open pit and underground mine, processing the refractory ore using a conventional carbon-in-leach gold recovery circuit incorporating a flotation circuit to produce a gold concentrate. Genesis’ exploration program is currently testing gaps within the existing large open pit resource and investigating strike extensions and parallel structures. Franco-Nevada receives A$250 thousand annual minimum royalty payment from Genesis. For Royalty Ounce calculation, Franco-Nevada estimates 100% of Mineral Resources and Mineral Reserves are subject to our royalty interest and estimates a rate of 2.5% is applicable Franco-Nevada Corporation ★ 105 TSX / NYSE: FNV Rest of World
B U L L A B U L L I N G Advanced Location: Australia | Operator: Minerals 260 Limited | Precious Metals: Au | Royalty: GR: 2.45% Au The Bullabulling Gold Project is situated in Western Australia, approximately 65 km west of Kalgoorlie. Franco-Nevada’s 2.45% GR encompasses a 27 km 2 area, which includes all Bullabulling Mineral Resources. 2025 2024 2023 Revenue to Franco ‑ Nevada ($ million) $ – $ – $ – M&I Resources (koz Au) 1 3,000 1,400 2,190 Inf. Resources (koz Au) 1 1,500 890 1,020 P&P Reserves (koz Au) 1 – – – M&I Royalty Ounces (000s) 1,2 74 8 11 Inf. Royalty Ounces (000s) 2 37 5 5 P&P Royalty Ounces (000s) 2 – – – 1 Please refer to the tables on pages 126–134 for a breakout of grade and tonnages by Mineral Resource category; all M&I categories are inclusive of Mineral Reserves 2 For Royalty Ounce calculation, Franco-Nevada estimates 100% of Mineral Resources and Mineral Reserves (60% in 2024, 50% in 2023) are subject to our royalty interest and estimates a rate of 2.45% is applicable (1% in 2024, 1% in 2023) In February 2026 Franco-Nevada acquired a A$170 million gross royalty from Minerals 260 Limited (“Minerals 260”) as part of a strategic funding agreement to support development of the Bullabulling Gold Project. The royalty acquisition added to Franco-Nevada’s historical 1.0% gross royalty over certain project tenements, effectively increasing it to a 2.45% gross royalty over all Bullabulling Mineral Resources. Bullabulling has M&I Mineral Resources of 3.0 Moz Au (93 Mt at 1.0 g/t Au) and Inferred Mineral Resources of 1.5 Moz (42 Mt at 1.1 g/t Au). Minerals 260 expects to publish a Pre-Feasibility Study in July 2026, along with a maiden Mineral Reserve. A final investment decision is expected early 2027, and first gold production potentially as soon as H2 2028. Minerals 260’s intended strategy is to incrementally develop and expand Bullabulling to accelerate and optimize production. Based on Franco-Nevada’s review and current resources potential throughput can potentially be expanded in phases to 7–8 Mtpa. Strategic funding proceeds will enable Minerals 260 to accelerate development of Bullabulling through the expansion of resources drilling and growth, bringing forward camp construction and other infrastructure to fast-track development, and facilitate the ordering of long lead items. Franco-Nevada’s royalty covers a large resource base, including the Phoenix, Bacchus, Dicksons and Kraken deposits which cover 8.5 kilometres of strike-length on the Bullabulling trend, and the Gibraltar deposit which currently spans 1 kilometre strike-length on a sub-parallel trend. Perth Bullabulling Bullabulling 2.45% GR Other Mineral 260 Tenements Minerals 260 Mining Tenements 2.5 km Area Of Interest (AOI) Resource Pit Shell 2 0 kilometers N Dicksons Phoenix Bacchus Kraken Gibraltar 2.45% GR 2.45% GR AOI ~530 km to Perth ~65 km to Kalgoorlie Great Eastern Highway PFS expected July 2026 along with maiden Mineral Reserve First gold production potentially as soon as H2 2028 M&I Resources could support production for 17 years and Inf. Resources for a further 8 years TSX / NYSE: FNV 106 ★ Franco-Nevada Corporation Rest of World
R O G O Z N A Exploration Location: Serbia | Operator: Strickland Metals Limited | Metals: Au, Ag, Cu, Pb & Zn | Royalty: NSR: 2% (Au) / 1.5% (all other metals) Franco-Nevada holds a 2% NSR from gold and 1.5% NSR from all other metals on Strickland Metals’ Rogozna project located near Novi Pazar approximately 400 km south of Belgrade in southern Serbia. The Rogozna Gold and Base Metals Project, located in the Raška District of southern Serbia, lies within the Tethyan Metallogenic Belt, which hosts multiple, giant, porphyry-related deposits. Rogozna hosts a large-scale magmatic hydrothermal system, featuring skarn-based copper gold (+/- Zinc, Silver, and Lead) mineralisation. The key prospects within the project are Shanac, Gradina, Medenovac and Copper Canyon. Strickland completed a maiden Indicated Resource estimate at Shanac of 1.25 Moz AuEq (30 Mt at 1.3 g/t gold equivalent) in April 2026. In addition, Rogozna hosts an Inf. Mineral Resource 7.35 Moz AuEq (191 Mt at 1.2 g/t gold equivalent). A large drill program is planned for 2026, targeting 70,000 meters of drilling with multiple mineral resource updates planned. Strickland Metals is concurrently progressing technical studies in parallel targeting delivery of a pre-feasibility study in 2027. For Royalty Ounce calculation, Franco-Nevada estimates 100% of the Mineral Resources and Mineral Reserves are subject to our royalty interest and estimates a rate of 1.86% (1.83% in 2024) reflecting 2.0% for gold Royalty Ounces, 1.5% for silver Royalty Ounces and 1.275% for copper Royalty Ounces (which factors a NSR smelting charge of 15%). Copper has been converted to Royalty Ounces assuming $5.50/lb ($4.25/lb in 2024) and silver has been converted to Royalty Ounces assuming $4,500/oz gold and $75.00/oz silver ($2,800/oz gold and $31.00/oz silver in 2024) Mining License Gold Prospects Gold Deposits Rogozna 2% (Au) / 1.5% (all other metals) NSR 0 5 Copper Canyon Gradina Shanac Red Creek N kilometer Administrative Boundary Medenovac Veliki Cesme Major Thrust/Suture Serbia Romania Hungary Croatia Bosnia Rogozna Kotlovi Large-scale deposit currently hosting 1.25 Moz AuEq M&I Mineral Resources and 7.35 Moz AuEq Inf. Mineral Resources Rapidly advancing project, with resource updates and an economic study expected in the near-term Franco-Nevada Corporation ★ 107 TSX / NYSE: FNV Rest of World
M I N I N G E X P L O R A T I O N A S S E T S Franco-Nevada has interests in 250 exploration stage mining properties (165 precious metals assets and 85 diversified (mining) assets) as at May 1, 2026. Exploration assets represent interests on projects where technical feasibility and commercial viability of extracting Mineral Resources are not demonstrable. Some of these assets have associated Mineral Resources that, to be economic, may require additional Mineral Resources, higher commodity prices, permitting approval, lower geopolitical risk or a better financing environment. A good portion of the properties are inactive and may not see activity again. Some of the properties are in proximity to producing or advanced projects. Franco-Nevada has not visited or audited its full list of exploration assets and has relied on operator reports and/or public disclosures to determine which properties are in good standing. It is possible some properties may have lapsed. The following table is a list of the mining exploration assets of Franco-Nevada as at May 1, 2026. Assets that have had their terms or leases expire and have been written off by Franco-Nevada are not listed. Mining Exploration Assets as at May 1, 2026 Asset Operator Interest and % 1 South America Para South Iron Project, Brazil Talon Ferrous Mineracao Ltda 0.5–1% NSR (All Metals) Terra Escura, Brazil Talon Ferrous Mineracao Ltda/Votorantim S.A. 1–2% NSR (All Metals); 4% Cash Dividends Trairao Iron Project, Brazil Talon Ferrous Mineracao Ltda $0.2995/tonne (Fe) Various–Vale, Brazil Vale S.A. Various (Fe) Bronce West, Chile Masglas America Corporation SpA 1–2% NSR (All Minerals) Calvario, Chile Austral Gold Limited (Minera Mena Chile Limitada) 1–2% NSR (All Minerals) El Alto, Chile Barrick Mining Corporation 0.54–2.7% NSR (Cu, Au) La Coipa, Chile Kinross Gold Corporation 3% NSR (Au) Mirador, Chile Austral Gold Limited (Minera Mena Chile Limitada) 1–2% NSR (All Minerals) Morros Blancos, Chile Pampa Metals Corp. (Pampa Metals Chile SpA) 1–2% NSR (All Minerals) Reina Hija, Chile Sumitomo Metal Mining Co., Ltd. (Sumitomo Metal Mining Chile Ltda) 1–2% NSR (All Minerals) San Guillermo, Chile Austral Gold Limited (Guanaco Compania Minera SpA) 1–2% NSR (All Minerals) San Valentino, Chile Atacama Copper Exploration Limited 1–2% NSR (All Minerals) Ayahuanca, Peru Apumayo S.A.C. 1% NSR (Au) Choreveco, Peru Minera del Norte S.A./Aruntani S.A.C. 0.1–0.3% NSR (Au) Conga, Peru Newmont Corporation 1.8% NSR (Au) Cristiana, Peru Fresnillo Peru S.A.C. 1.5% NSR (All Metals) Los Pinos, Peru Tamerlane Ventures Inc. 0.5% NSR (All Metals) Mansa Musa (Minasnioc), Peru Private Investors 2% NSR (All Metals) Parinacochas (Urbaque), Peru Hochschild Mining plc 2% NSR (All Minerals) Pukaqaqa (Antoro Sur), Peru Nexa Resources Peru S.A.A. 1–2% NSR (All Minerals) Quilish, Peru Newmont Corporation 1.8% NSR (Au) Yanamina, Peru EV Resources Ltd. 5% NSR (All Minerals) Canada Carruthers, British Columbia Cariboo Rose Resources Ltd. 2.5% NSR (All Minerals) (buyback option on 1.5%) New Prosperity, British Columbia Taseko Mines Limited Stream (Au) Scottie, British Columbia Scottie Resources Corp. 2% NSR (All Minerals) Spences Bridge (Talisker), British Columbia Talisker Resources Ltd. 2.5% NSR (All Minerals) Spences Bridge (Westhaven), British Columbia Westhaven Gold Corp. 2% NSR (All Minerals) Taken, British Columbia Independence Gold Corp. 2–4% NSR (All Minerals) (buyback option to 1%) Tide, British Columbia Brigade Holdings Limited 1.5% NSR (All Minerals) Trout Lake (MAX Moly Mine), British Columbia Cameo Industries Corp. 2.5% NSR (All Minerals) Maverick (Nokomis), Manitoba Minnova Corp. 2–3% NSR (All Minerals) Maverick (Puffy Lake), Manitoba Minnova Corp. 2–3% NSR (All Minerals) Oxford Lake, Manitoba Big Ridge Gold Corp. 1.5–2.5% NSR (All Minerals) Clarence Stream, New Brunswick Galway Metals Inc. 1% NSR (All Minerals) Golden Ridge, New Brunswick Darryl Leblanc 2% NSR (All Minerals) Buchans, Newfoundland and Labrador Canterra Minerals Corporation 2% NSR (All Minerals) (buyback option on 1%) LabMag (Taconite), Newfoundland and Labrador Abaxx Technologies Inc. 1.666% GR (Iron Ore-Taconite) Mary March, Newfoundland and Labrador Canstar Resources Inc. 1% NSR plus other (All Minerals) Mazenod, Northwest Territories BFR Copper & Gold Inc. 2% NSR (All Minerals) (buyback option on 1%) Redstone (Coates Lake), Northwest Territories H. Coyne and Sons Ltd. (Redbed Resources Corp.) 3–4% NSR (Cu, Ag) Hyde, Nunavut Exploratus Ltd. 2.5% NSR (All Minerals) Black Thor, Ontario Wyloo Muketei Ltd. 2–3% NSR (Cr, Ni, Cu) Butler and Sanderson (Diagnos), Ontario Wyloo Ring of Fire Ltd./Macdonald Mines Exploration Ltd. ROFR on Diagnos Royalty (Diamonds/Base Metals) Catharine 1, Ontario Canadian Exploration Services Limited 1/3 of a 2–3% NSR (All Minerals) Catharine 4, Ontario Canadian Exploration Services Limited/Northstar Gold Corp. 2–3% NSR (All Minerals) Cline Lake, Ontario Alamos Gold Inc. 0.75% NSR (All Minerals) Detour (Gowest), Ontario Agnico Eagle Mines Limited 1% NSR (All Minerals) (buyback option on 0.5%) Detour (Mikwam), Ontario and Quebec Aurelius Minerals Inc. 0.4824% NSR (All Minerals) Diagnos, Ontario Wyloo Muketei Ltd. 2% NSR (All Minerals) TSX / NYSE: FNV 108 ★ Franco-Nevada Corporation Mining Exploration Assets
Asset Operator Interest and % 1 Canada Continued Eagle’s Nest, Ontario Wyloo Ring of Fire Ltd. 1% GR (All Minerals) Edwards, Ontario Alamos Gold Inc. (Richmont Mines Inc.) 2% NSR (All Minerals) Golden Highway (Aquarius), Ontario Agnico Eagle Mines Limited 1–2% NSR (All Minerals) Golden Highway (Central Timmins), Ontario Grace Gold Ltd. 0–1% NSR (All Minerals) Golden Highway (Kerrs Leases), Ontario Canoe Mining Ventures Corp. (Sheltered Oak Resources Corp.) 1–2% NSR (Au) Golden Highway (Stock), Ontario McEwen Mining Inc. 1% NSR (All Minerals) Golden Highway (Stoughton), Ontario Vault Minerals Limited 0.5–2.5% NSR (Au) Hemlo (JOA), Ontario Hemlo Mining Corp. 0.5–1% NSR (Au) Kerr-Addison, Ontario Gold Candle Ltd. 1% NSR (All Minerals) Kirkland Lake (Amalgamated Kirkland Claims), Ontario Agnico Eagle Mines Limited 2% NSR (Au) Kirkland Lake (Gracie West & Amalgamated Kirkland Extensions), Ontario Agnico Eagle Mines Limited 2% NSR (Au) Kirkland Lake (Kirkland Lake West), Ontario Agnico Eagle Mines Limited 2–3% NSR (Au) Kyle, Ontario Wyloo Muketei Ltd. 2% NSR (All Minerals) Larose, Ontario Tashota Resources Inc. 0.5% NSR (All Minerals) MacFadyen & Pele, Ontario Wyloo Muketei Ltd. 2% NSR (All Minerals) Marathon PGM (Sally Deposit), Ontario Generation Mining Limited/Sibanye Stillwater Limited 2% NSR (Pt, Pd) Musselwhite (North), Ontario Orla Mining Ltd. 2% NSR (All Minerals) Red Lake (Madsen: Newman-Heyson claims), Ontario West Red Lake Gold Mines Inc. 1.5–2% NSR (All Minerals) Red Lake (Newman-Todd), Ontario Trillium Gold Mines Inc./Heliostar Metals Ltd. 1.5–2% NSR (Au) Red Lake (Skinner), Ontario Prosper Gold Corp. 1% NSR (All Minerals) Ring of Fire (Original Noront Properties), Ontario Wyloo Ring of Fire Ltd. 2% NSR (All Minerals) Shining Tree (Creso), Ontario Ore Group Option to acquire 2% NSR (All Minerals) Shining Tree (Knight), Ontario Golden Harp Resources Inc. 2–3% NSR (Au) Sudbury-Podolsky, Ontario Magna Mining Inc. Stream (Au, PGM) Sungold, Ontario Interbanc Capital Corp. 2% NSR (All Minerals) Timmins (Cripple Creek), Ontario Alamos Gold Inc. 0.3825–1.75% NSR (Au) Timmins (First Atlantic Nickel), Ontario First Atlantic Nickel Corp. 5% NSR (All Minerals) Timmins (Kreative), Ontario Kreative Ventures Limited 5% NSR (All Minerals) Timmins (Sewell), Ontario GFG Resources Inc. 1.5–2.5% NSR (Au) Timmins (West Porcupine), Ontario GFG Resources Inc. 2% NSR (All Minerals) Timmins (Whitney 1), Ontario John Prochnau 2.5% NSR (All Minerals) Timmins (Whitney 2), Ontario Discovery Silver Corp. 2.5% NSR (All Minerals) Wawa, Ontario RPX Gold Inc. 1.5% NSR (All Minerals) Windarra (East Property), Ontario Wesdome Gold Mines Ltd. 0.5% NSR (All Minerals) Benoist, Quebec Exploits Discovery Corp. 1% NSR (All Minerals) (buyback option on 0.5%) Cadillac-Sphinx, Quebec Agnico Eagle Mines Limited 1.5% NSR (All Minerals) Casa Berardi (Dieppe), Quebec Orezone Gold Corporation 2–3% NSR (Au) Destiny (Rochebaucourt), Quebec Big Ridge Gold Corp. 3% NSR (All Minerals) Eastmain, Quebec Benz Mining Corp. 1–1.15% NSR on initial 250K oz (Au) Estrades-Caribou, Quebec Yorbeau Resources Inc. 1.275–2.125% NSR (Au, Base Metals) Fenelon, Quebec Wallbridge Mining Company Limited 1% NSR (All Minerals) Galinee, Quebec Nuvau Minerals Corp. 1.5–2% NSR (Au) Heva-Hosco, Quebec Orezone Gold Corporation Stream (Au) Martiniere, Quebec Wallbridge Mining Company Limited 2% NSR (All Minerals) Matagami JV, Quebec Nuvau Minerals Corp. 2% NSR (All Minerals) Matagami PD1, Quebec Nuvau Minerals Corp. Net Carried Interest plus other (All Minerals) Mia, Quebec Q2 Metals Corp. 2% NSR (All Minerals) Norlartic-Camflo, Quebec Agnico Eagle Mines Limited 25% NPI (All Minerals) N2 (Northway-Noyon), Quebec Wallbridge Mining Company Limited (Formation Metals Inc. as optionee) 1% NSR (All Minerals) Phoenix, Quebec Bonterra Resources Inc. 0.5% NSR (All Minerals) (buyback option on 0.25%) Wilson (Verneuil), Quebec Cartier Resources Inc. 0.5% NSR (All Minerals) Crawford Lake, Saskatchewan Denison Mines Corp. 2% NSR (All Minerals) (buyback option on 1%) AurMac, Yukon Banyan Gold Corp. 1% NSR (Net of 5% buyback) (Au) Canalask, Yukon GT Resources Inc. 1% NSR (Net of $1M buydown) (Ni) Flume, Yukon Commander Resources Ltd. 2.5% NSR (All Minerals) (buyback option to 1%) Hy, Yukon Lions Bay Mining Corp. 2% NSR (All Minerals) (buyback option to 1%) Hyland, Yukon Banyan Gold Corp. 0–1% NSR (Net of $1M buydown) (Au) United States Chilito-Cyprus Christmas, Arizona Grupo Mexico, S.A.B. de C.V. (Asarco LLC) $0.02/lb (Cu); beyond 650M lbs production Planet, Arizona Planet Mining Company LLC 2% NSR (All Minerals) (buyback option on 1%) Zeolites, Arizona Imagin Minerals Inc. et al. $1.50/ton plus escalator (Clay) Darwin, California Project Darwin LLC 5% NSR plus other (Au, etc.) Cripple Creek, Colorado Searchlight Exploration, LLC 3% NSR (Au, Ag) La Plata Allard Stock, Colorado Metallic Minerals Corp. 1.5% NSR (All Minerals) Corbin Wickes, Montana Montana Goldfields, Inc. 5% NSR (Au) Franco-Nevada Corporation ★ 109 TSX / NYSE: FNV Mining Exploration Assets
Asset Operator Interest and % 1 United States Continued Elkhorn, Montana Montana Goldfields, Inc. 1.1875% NSR (Au) Lewis and Clark County, Montana Hartmut W. Baitis et al. 1% NSR (All Minerals) Carlin (Currant Creek), Nevada Carlin Gold Corporation 3% NSR (All Minerals) Carlin (South Railroad), Nevada Orla Mining Ltd. 1% NSR (All Minerals) Carlin (Willow Creek), Nevada Carlin Gold Corporation 1% NSR (All Minerals) Dune, Nevada Integra Resources Corp. (Millennial NV LLC) 2% NSR (All Minerals) (buyback option on 1%) EaglePicher Diatomite II, Nevada EP Minerals, LLC $0.25/short ton plus other (Diatomite) Eden, Nevada Integra Resources Corp. (Millennial NV LLC) 2% NSR (All Minerals) (buyback option on 1%) Fire Creek, Nevada Hecla Mining Company 2.5% NSR (Au, Ag) Gabbs, Nevada P2 Gold Inc. 2% NSR (All Minerals) (buyback option on 1%) Getchell, Nevada Barrick Mining Corporation/i-80 Gold Corp. 2% NSR (Au) Goldstrike (Rodeo Creek), Nevada Nevada Gold Mines LLC 4% NSR; capped at $500K (Au, Ag) Hollister, Nevada Hecla Mining Company 3–5% NSR (Au, Ag) Isabella Pearl, Nevada Fortitude Gold Corp. 3% NSR (Au) Limousine Butte, Nevada NevGold Corp. 1.5–2.5% NSR (Au) Lone Tree, Nevada i-80 Gold Corp. (Osgood Mining Company, LLC) 1.5–3% NSR (Au) Marigold (SAR), Nevada SSR Mining Inc. 5% NSR (Au) Marigold (Trout Creek), Nevada Nevada Gold Mines LLC 3% NSR (Au) Marr, Nevada Integra Resources Corp. (Millennial NV LLC) 2% NSR (All Minerals) (buyback option on 1%) Midas, Nevada Hecla Mining Company 2.5% NSR (Au, Ag) Mountain View 1, Nevada Integra Resources Corp. (Millennial NV LLC) 1% NSR (All Minerals) Mountain View 2, Nevada Integra Resources Corp. (Millennial NV LLC) 0.5% NSR (Au) Nevada Mineral-Eureka County, Nevada Nevada Gold Mines LLC 2% NSR (All Minerals) Ocelot, Nevada Integra Resources Corp. (Millennial NV LLC) 2% NSR (All Minerals) (buyback option on 1%) Preble, Nevada Barrick Mining Corporation/Nevada Gold Mines LLC 10% NP (Au) Preble (Pinson Fee), Nevada Barrick Mining Corporation 1.5–7.5% NSR (Au, Ag) Rain-Emigrant-Saddle, Nevada Nevada Gold Mines LLC 1.5% NSR (All Minerals) Relief Canyon, Nevada Americas Gold and Silver Corporation 2% NSR (Au) Sandman, Nevada Borealis Mining Company Ltd. (Sandman Resources Inc.) 0.5674% NSR on initial 200K oz (Au) Sleeper, Nevada Paramount Gold Nevada Corp. 2% NSR (All Minerals) Tonkin Springs, Nevada McEwen Mining Inc. 1–2% NSR (Au) Wildcat, Nevada Integra Resources Corp. (Millennial NV LLC) 0.5% NSR (Au) Boling Dome, Texas Total E&P USA, Inc./H & L New Gulf, Inc. $0.0028225 per long ton (Sulfur) Hobson Pearson, Texas Uranium Energy Corp. 20% OR (Uranium) Kings Canyon, Utah Pine Cliff Energy Ltd. 4% NSR (Au) Silver Bell, Utah Unico, Inc. 5% NSR plus other (Au, Cu, Pb, Zn) Tintic, Utah Ivanhoe Electric Inc. 1% NSR (All Minerals) TUG (Tecoma), Utah Fronteer Development (USA) Inc. 5% NSR (All Minerals) Shirley Basin (Davy Crockett), Wyoming Ur-Energy Inc. (Pathfinder Mines Corporation) 4% GR (Uranium) Australia Mt Fitch, Northern Territory Northern Territories Resources Pty Ltd 1–3% NSR (Cu, Pb, Zn, Co, Ni, U) Brown’s Creek, New South Wales Australian Native Landscapes/Hargraves Resources NL 2.25% NSR (All Minerals) Brown’s Creek (Blayney), New South Wales Regis Resources Limited 2.25% NSR (All Minerals) Brocks Creek (Zapopan), Northern Territory Bacchus Resources Pty Ltd A$20/oz (Au) Reynolds Range, Northern Territory Prodigy Gold NL 1–2.5% NSR (Au) Rover, Northern Territory Castile Resources Limited 1.5–2.5% NSR (All Minerals) Spring Hill, Northern Territory PC Gold Pty Ltd A$5.70–13.30/oz (Au) Tennant Creek, Northern Territory Emmerson Resources Limited/Tennant Consolidated Mining Group Pty Ltd 1.29% NSR (Au) Tennant Creek (Chariot), Northern Territory Emmerson Resources Limited A$17.10 or A$30/oz (Au) Tennant Creek-Evolution, Northern Territory CuFe Limited/Evolution Mining Limited 1.29% NSR (Au) Tennant Creek (Orlando), Northern Territory CuFe Limited/Evolution Mining Limited A$30/oz; capped at 64K oz (Au) Bowen Basin (Various), Queensland (31 assets) Peabody Energy Corp/Pembroke Resources South Pty Ltd Production Payment (Coal) Crush Creek, Queensland Navarre Minerals Limited 2.75% GR (All Minerals) King Vol (Walsh River), Queensland Aurora Metals Limited Production Payment (Zn) Millmerran (Power Station), Queensland Genuity Pty Ltd 8.3125% NPI of cashflow; NPV threshold (Coal) Top Camp, Queensland Mayfair Corporations Group Pty Ltd 0.5% GR (Au)/NPI (Other Minerals) Twin Hills, Queensland GBM Resources Ltd 2.5% NSR (Au) Peculiar Knob, S. Australia Peak Iron Mines Pty Ltd Production Payment (Fe) Third Plain, S. Australia Perilya Limited/AIC Mines Limited 0.5% NSR (Zn) Moina, Tasmania Mazel Resources Pty Ltd A$125K lump sum at commencement of mining Rosebery Extension, Tasmania MMG Limited 2.6305% (Au, Ag, Other Minerals) Admiral Hill, W. Australia Genesis Minerals Limited Production Payment (Au) Agnew, W. Australia Gold Fields Limited 2.5% GR (All Minerals) Agnew (Cox), W. Australia Gold Fields Limited 5% GR (Au) Agnew (Miranda Gold), W. Australia Gold Fields Limited 3% GR (Au) Agnew (Miranda Nickel), W. Australia Gold Fields Limited 0.5% of production (Ni) TSX / NYSE: FNV 110 ★ Franco-Nevada Corporation Mining Exploration Assets
Asset Operator Interest and % 1 Australia Continued Agnew (Miranda Nickel No2), W. Australia Gorilla Gold Mines Ltd 0.5% of production (Ni) Agnew (Vivien Gold Mine), W. Australia Ramelius Resources Limited 3% GR (Au) Camelback, W. Australia GME Resources Limited A$0.50/tonne (Ni) Bullfinch, W. Australia Torque Metals Limited 1% NSR (Au) Butcher Well, W. Australia AngloGold Ashanti Limited/Northern Star Resources Limited 1% NSR; 50K oz production threshold (Au) Butcher Well Area, W. Australia AngloGold Ashanti Limited/Northern Star Resources Limited 0.68–1% NSR (Au) Cue Gold (Day Dawn), W. Australia Westgold Resources Limited 1% GR (Au) Duketon (Southwest), W. Australia Regis Resources Limited 2% NSR (All Minerals) Duketon (West), W. Australia Regis Resources Limited/Duketon Mining Limited (Ni only) 2% NSR (All Minerals) Edna May, W. Australia Ramelius Resources Limited 1.5% GR (All Minerals) Flushing Meadow, W. Australia Yandal Resources Limited 1% NSR (Au, Other Minerals) Flying Fox, W. Australia IGO Limited 2% GR (Ni) FMG Hamersley, W. Australia Fortescue Metals Group Ltd A$0.05/tonne; capped at A$1M (Fe) Glenburgh, W. Australia Gascoyne Resources Ltd 1.5% NPI (All Minerals) Granny Smith (Windich South), W. Australia Gold Fields Limited 1% NSR (All Minerals) Gum Creek (Gidgee/Wyooda Thangoo), W. Australia Horizon Gold Limited 1.25% GR (Au) Gum Creek (Sandstone II/Howards), W. Australia Horizon Gold Limited A$0.35/dry tonne (All Minerals) Jaguar Project (Western Claim), W. Australia Aeris Resources Limited 1–2% NSR (Cu, Zn, Other Metals) Lake Maitland, W. Australia Toro Energy Limited (Uranium)/Mega Uranium Ltd (Au, Other Minerals) 1% NSR (All Minerals) Marvel Loch (May Queen), W. Australia Shandong Tianye Real Estate Development Group Co., Ltd. A$0.50–1.00/cubic metre (Au) Mt Newman-Victory, W. Australia St Barbara Limited/ Venari Minerals NL 0.07% GR (All Minerals) Mungari (Carbine North/Chadwin’s Dam), W. Australia Evolution Mining Limited 3% NPI (All Minerals) Mungari (Lady Jane), W. Australia Evolution Mining Limited 4.5% GR (Au) Munni Munni, W. Australia Alien Metals Ltd One-time payment on production (Au and/or Pt) Murrin Murrin Gold, W. Australia ICM Limited 2.625% NSR (Au, Sulfides) Paddington (Breakaway Dam/12 Mile), W. Australia Zijin Mining Group Co., Limited A$1/ton (All Minerals) Paddington (Matt Dam), W. Australia Zijin Mining Group Co., Limited A$0.60/tonne (Au) Polar Bear, W. Australia Westgold Resources Limited 2% NSR (All Minerals) Randwick Gold Hill, W. Australia E Bouverie, Trindal P/L, Lucas Gold P/L et al. 1–1.5% GR (Au) Red October, W. Australia Matsa Resources Limited 1.75% NSR (Au) South Kalgoorlie (Location 48), W. Australia BHP Group Limited 1–1.75% NSR (Au, Ag, Other Minerals) South Kalgoorlie (St Ives), W. Australia Gold Fields Limited 1–1.75% NSR (Au, Ag, Other Minerals) Super Pit (Western Lease), W. Australia Northern Star Resources Limited 2.5% GR (Au) Talga Talga, W. Australia Novo Resources Corp. 1.5% NSR (Au) Western Tamani (Coyote), W. Australia Black Cat Syndicate Limited A$5-15/oz on production between 300K-1M oz (Au) Yundamindera, W. Australia Nex Metals Explorations Ltd/Arika Resources Ltd 1% NSR (Au) Rest of World Urasar, Armenia Hayasa Metals Inc. (Hayasa Resources Corp LLC) 0.625% NSR (All Minerals) Maibulak deposit, Kazakhstan KAZ Minerals plc $10.41/oz plus escalator (Au) CEXCI, Philippines Nickel Asia Corporation Production Payment; capped at $10M Rogozna (KMC), Serbia Strickland Metals Limited 1.5–2% NSR (Au, Base and Other Metals) Cerro San Pedro, Mexico New Gold Inc. 1.95% NSR (Au, Ag) Cooke 4, South Africa Sibanye Stillwater Limited Stream (Au) Kasese, Uganda Scully Royalty Ltd. 10% of free cash flow; capped at $10M (Co) Aği Daği-Camyurt, Türkiye Tumad Madencilik Sanayi ve Ticaret A.S. 2% NSR (Au) Hasandagi, Türkiye Öznar Maden Yatırımları A. Ş . 2% NSR (Au) Karadag, Türkiye ACG Metals Limited 2.5% NSR (Au) Torul, Türkiye ACG Metals Limited 1.5% NSR (Au) 1 Royalty terms have been simplified for presentation purposes. Different terms may apply to certain portions of properties or by commodity. Some royalties may have sliding scales tied to commodity price. Others may include participation in sale proceeds of property or gross sales Franco-Nevada Corporation ★ 111 TSX / NYSE: FNV Mining Exploration Assets
TSX / NYSE: FNV 112 ★ Franco-Nevada Corporation
Hoyle Pond, Timmins, Ontario | Image Courtesy of the ROM (Royal Ontario Museum), Toronto, Canada. ©ROM E n erg y Assets
E N E R G Y A S S E T S Franco-Nevada has owned and invested in energy assets since inception. Our energy investments have allowed us to be opportunistic through the commodity cycles, adding growth and diversity to our portfolio. Energy revenue was 11% of Franco-Nevada’s overall revenue in 2025. The scale of the energy sector along with its many participants has provided access to a diverse set of operators and a broad range of royalty opportunities. Until 2016, Franco-Nevada’s focus was primarily on the Western Canadian Sedimentary Basin. Starting in late 2016, we added exposure to the SCOOP/STACK basins in Oklahoma and the Midland/Delaware basins in Texas due to their attractive economics, favourable regulatory environment and access to market. We subsequently shifted our focus to natural gas, adding royalty assets in the Marcellus shale in Appalachia in 2019, and in the Haynesville shale in East Texas in late 2020 and in Louisiana in 2024. Franco-Nevada’s assets include production from existing wells in addition to exposure to undeveloped acreage which hosts the potential for new well locations which extend production volumes into the future. In order to provide an estimate of future reserves and asset life, we engage third-party reserve evaluators to provide estimates for the Proved and Probable categories, and where appropriate, the Possible, and Contingent resource categories for currently producing formations. These estimates inform our view of future well locations and resources and demonstrate long-lived assets. The assets often also benefit from additional upside exposure in the form of unexploited hydrocarbon-bearing formations at depth and potentially from enhanced hydrocarbon recovery techniques. Major Producing Assets as of May 1, 2026 United States Marcellus, Range Resources Natural Gas & NGLs Haynesville, TG Natural Resources, Others Natural Gas SCOOP/STACK, Continental Resources, Others Oil & Natural Gas Permian Basin, XTO Energy, Others Oil Canada Weyburn Unit, Whitecap Resources Oil Orion, Strathcona Resources Oil We have been opportunistic through the energy commodity cycles and have accumulated assets in North America’s premium oil and gas basins. Oil and Gas Information Advisory In this Asset Handbook, certain natural gas volumes have been converted to barrels of oil equivalent on the basis of six Mcf to one bbl. Boe and mboe may be misleading, particularly if used in isolation. A conversion ratio of six Mcf to one bbl is based on an energy equivalency ratio and does not represent a value equivalency. ENERGY ASSETS U.S. Energy 116 Permian Basin 116 SCOOP/STACK 117 Marcellus 118 Haynesville 119 Canadian Energy 120 Weyburn Unit 120 Orion 121 Other Producing Energy Assets 122 Energy Exploration Assets 123 TSX / NYSE: FNV 114 ★ Franco-Nevada Corporation
U.S. and Canadian Energy Assets Cold Lake Anadarko Basin Permian Basin Midland Delaware Stack Scoop Peace River Orion Athabasca Weyburn Williston Basin Appalachian Basin Marcellus Haynesville Neal Hot Springs Oil Gas Geothermal Franco-Nevada Corporation ★ 115 TSX / NYSE: FNV North America
P E R M I A N B A S I N Location: Texas & New Mexico, United States | Operator: XTO Energy (ExxonMobil), Diamondback Energy, Permian Resources, Others | Energy: Oil Royalty: Various Royalty Rates Franco-Nevada has exposure to the Permian Basin in West Texas, through both the Midland and Delaware sub-basins. 2025 2024 2023 Revenue to Franco ‑ Nevada ($ million) $ 43.9 $ 45.4 $ 47.6 Production (Mboe) 1 1,083 913 1,007 Commodity Split (%) 2 Oil 52% 57% 51% Gas 25% 20% 30% NGL 23% 23% 19% 1 Production is referenced in barrels of oil equivalent net to Franco-Nevada 2 Percentage based on production revenue from each commodity 3 Asset life is calculated as the Proven, Probable and Possible reserve volumes divided by the prior year production volume These two basins are considered among the most economic and prolific shale oil plays in the U.S. and have been the key drivers behind U.S. oil production growth over the last decade. The Permian is the most active shale play in North America. Effective in the first quarter of 2017, Franco-Nevada purchased a package of royalties in the Midland Basin for approximately $115 million. The Midland Basin comprises the eastern portion of the broader Permian Basin. The royalty acreage is highly diversified, covering a significant portion of the core of the Midland basin and providing exposure to multiple benches in the Wolfcamp and Spraberry formations. The royalties consist of approximately 97% mineral title rights, along with some GORR interests, which apply to approximately 1,036 acres (net to Franco-Nevada). The acreage hosts numerous operators, however, XTO Energy, a subsidiary of ExxonMobil Corporation, operates the largest portion of royalty acreage following their acquisition of Pioneer Natural Resources in 2024. In the third quarter of 2017, Franco-Nevada acquired a package of royalties in the Delaware Basin for approximately $101 million. The Delaware Basin constitutes the western portion of the broader Permian Basin, situated in West Texas and southeast New Mexico. Located west of the Midland Basin, the Delaware Basin exhibits many geological similarities and is favoured by operators due to its stacked pay potential and exceptional economics. The current focus of operators in the Delaware Basin are the Wolfcamp and Bonespring horizons. The royalties consist of approximately 94% mineral title rights, along with some GORR interests, which apply to approximately 676 acres (net to Franco-Nevada). There are various operators across the acreage who continue to direct capital toward the Delaware Basin, which will result in continued development of our assets over time. Franco-Nevada’s Permian assets generated $43.9 million in revenue in 2025, a 3.2% decrease from 2024, reflecting softer oil prices. Despite slightly lower rig activity for the year, there were a record number of new wells completed on our land base in 2025, many of which will be brought into production in the coming year. The Permian assets have an estimated asset life of approximately 21 years³, with additional stacked formations that may be exploited in the future. REAGAN GLASSCOCK MIDLAND ECTOR UPTON CRANE HOWARD MARTIN ANDREWS BORDEN DAWSON CROCKETT IRION Midland Basin WINKLER PECOS REEVES WARD CULBERSON LOVING LEA EDDY JEFF DAVIS New Mexico Texas San Simon Channel Northwest Shelf Central Basin Platform Delaware Basin Net Royalty Acres by County 23% Reeves 16% Martin 15% Glasscock 11% Midland 8% Howard 7% Loving 5% Reagan 4% Upton 3% Ward 3% Culberson 3% Eddy 1.% Lea 1% Other Permian Basin FNV Royalty Acreage Texas Midland Basin Delaware Basin New Mexico Permian Basin N 16 mile 10 0 0 kilometer Royalties provide exposure to Midland and Delaware Basins Permian represents one of the most active and economic plays in North America Exposure to upside through multiple formations at depth TSX / NYSE: FNV 116 ★ Franco-Nevada Corporation North America
S C O O P / S T A C K Location: Oklahoma, United States | Operator: Continental Resources, Ovintiv Inc., Devon Energy, ConocoPhillips, Others | Energy: Oil and Natural Gas Royalty: Various Royalty Rates Through several discrete transactions, Franco-Nevada has accumulated a large royalty position in the SCOOP and STACK plays in Oklahoma. 2025 2024 2023 Revenue to Franco ‑ Nevada ($ million) 1 $ 42.0 $ 31.4 $ 33.1 Production (Mboe) 1 1,174 1,027 1,028 Commodity Split (%) 2 Oil 31% 25% 25% Gas 64% 70% 70% NGL 5% 5% 5% 1 Includes revenue and production net to Franco-Nevada from both Continental Royalty Acquisition Venture and other SCOOP/STACK royalties 2 Percentage based on production revenue from each commodity 3 Asset life is calculated as the Proven, Probable and Possible reserve volumes divided by the prior year production volume. In the fourth quarter of 2016, Franco-Nevada purchased royalty rights in the STACK shale play, located in the Anadarko Basin of Oklahoma, for approximately $100 million. The primary horizon of focus in the area is the Meramec, although the royalties have exposure to multiple horizons at depth, including the Woodford and Osage formations. In the second quarter of 2017, Franco-Nevada expanded its portfolio by acquiring additional mineral title and royalty interests for $27.6 million. This transaction enhanced Franco-Nevada’s existing position in the STACK and introduced new exposure to the SCOOP shale play to the south. In total, the assets consist of GORRs and mineral title rights which apply to approximately 1,430 acres (net to Franco-Nevada). The top three operators on the acreage are Ovintiv Inc. (formerly Encana), Devon Energy, and ConocoPhillips, following its acquisition of Marathon Oil in Q4 2024. These operators reduced their drilling activity in the play in 2020 owing to a sharp drop in commodity prices. Although drilling rates have since rebounded, they remain significantly below the peak levels observed in 2019. In the fourth quarter of 2018, Franco-Nevada and Continental Resources entered into a transaction whereby Franco-Nevada acquired $120 million in existing royalties owned by Continental and formed a jointly owned entity (the “Royalty Acquisition Venture”) to acquire up to $400 million in royalty rights under Continental’s area of operations. Through the Royalty Acquisition Venture, Franco-Nevada funds 80% of the acreage cost and receives 50–75% of distributions, depending on performance against pre-set volume targets. Franco-Nevada received approximately 70% of distributions in 2025, and anticipate our share of distributions to increase going forward, toward a maximum of 75%. In exchange for the partial capital carry in favour of Continental, the venture provides Franco-Nevada with an opportunity to acquire royalty rights at the grass-roots level, leverage the value of Continental’s drilling plans, and benefit from the company’s knowledge of local land title and geology. Additionally, Continental manages the assets, relieving Franco-Nevada of any administrative burden. The venture was designed to acquire royalty rights primarily within acreage operated by Continental, offering robust economics, proximity to infrastructure, and future upside through stacked hydrocarbon-bearing horizons. In the fourth quarter of 2022, Harold Hamm, Continental’s founder, privatized the company through an acquisition of the outstanding publicly traded shares. As of December 31, 2025, Franco-Nevada had contributed $483.5 million to the venture, with a remaining commitment of approximately $36.5 million. Franco-Nevada’s SCOOP/STACK assets generated $42.0 million in revenue in 2025, a 34% increase from 2024, reflecting stronger performance and rebounding gas prices. The SCOOP/STACK assets have an estimated asset life of approximately 19 years³. GARFIELD N km 0 40 Black Oil Volatile Oil Condensate Dry Gas DEWEY BLAINE KINGFISHER MAJOR CANADIAN OKLAHOMA LINCOLN CREEK OKFUSKEE HUGHES COAL ATOKA BRYAN MARSHALL JOHNSTON PONTOTOC SEMINOLE POTTAWATOMIE CLEVELAND MCCLAIN GARVIN MURRAY CARTER LOVE JEFFERSON STEPHENS CLAY COTTON WICHITA WILBARGER TILLAMAN JACKSON KIOWA GRADY GREER WASHITA COMANCHE LOGAN PAYNE CADDO CUSTER Pressure Transition miles 0 25 SCOOP/STACK STACK FNV Royalty Acreage Oklahoma City OKLAHOMA SCOOP TEXAS KANSAS ARKANSAS NEW MEXICO MISSOURI COLORADO Anadarko Basin STACK SCOOP SCOOP/STACK includes both oil and gas-rich areas Exposure to multiple formations at depth Franco-Nevada share of distributions expected to increase Note: Map does not show acreage under Royalty Acquisition Vehicle with Continental Franco-Nevada Corporation ★ 117 TSX / NYSE: FNV North America
M A R C E L L U S Location: SW Pennsylvania, United States | Operator: Range Resources | Energy: Natural Gas and NGLs | Royalty: 1% Overriding Royalty Franco-Nevada has a 1% royalty on the majority of Range Resources Corporation’s (“Range”) operated position in Southwest Pennsylvania. 2025 2024 2023 Revenue to Franco ‑ Nevada ($ million) $ 30.5 $ 26.9 $ 28.0 Production (Mboe) 1 1,383 1,462 1,436 Commodity Split (%) 2 Oil 2% 2% 2% Gas 63% 63% 63% NGL 35% 35% 35% 1 Production is referenced in barrels of oil equivalent net to Franco-Nevada, although is comprised mostly of gas and natural gas liquids 2 Percentage based on production revenue from each commodity 3 Asset life is calculated as the Proven, Probable and Possible reserve volumes divided by the prior year production volume The royalty is calculated as 1% of gross production, less minor deductions from approximately 338,000 net acres of Range’s working interest position in Washington, Western Allegheny and Southern Beaver counties in Pennsylvania. The royalty applies to existing production and future development from the Marcellus shale formation as well as future potential development from the Utica and Upper Devonian formations. The royalty is registered on title and is a direct interest in real property. The Marcellus is one of the most prolific and active gas and liquids plays in North America. Range’s acreage is situated within a liquids-rich portion of the Marcellus, enhancing well economics and the overall cost structure. Range helped pioneer the Marcellus shale in 2004 with the successful drilling of the Renz #1 well in Washington County, Pennsylvania. Since then, Range has developed a track record of growing reserves from its asset base. Range’s position in Southwest Appalachia is considered to have one of the longest core inventory lives among U.S. natural gas producers, and its diversified portfolio of transportation capacity mitigates in-basin pricing risk. In 2025, Franco-Nevada received $30.5 million in revenue from the Marcellus royalty. The Marcellus has an estimated asset life of approximately 22 years³ and payback is expected in 2030. There is additional potential in the Utica and Upper Devonian formations, most of which is not included in the above estimate, that may increase the longevity of the asset. Range Resources drill pad, SW Pennsylvania Appalachian Basin Marcellus Diverse exposure to natural gas and natural gas liquids Long-life asset with strong underlying economics Secure land title with exposure to undeveloped formations at depth TSX / NYSE: FNV 118 ★ Franco-Nevada Corporation North America
H A Y N E S V I L L E Location: East Texas & Louisiana, United States | Operator: TG Natural Resources, Expand Energy, Sabine Oil & Gas, Others | Energy: Natural Gas Royalty: Various Royalty Rates Franco-Nevada owns a portfolio of royalty rights in the Haynesville natural gas play in East Texas and Louisiana, which it purchased in two separate acquisitions from Mesa Minerals Partners LLC I & II. 2025 2024 2023 Revenue to Franco ‑ Nevada ($ million) $ 29.8 $ 21.0 $ 26.0 Production (Mboe) 1 1,671 1,918 1,886 Commodity Split (%) 2 Oil 0% 0% 0% Gas 99% 99% 99% NGL 1% 1% 1% 1 Production is referenced in barrels of oil equivalent net to Franco-Nevada, although is comprised mostly of natural gas 2 Percentage based on production revenue from each commodity 3 Asset life is calculated as the Proven, Probable and Possible reserve volumes divided by the prior year production volume The first part of the portfolio was acquired in December of 2020 for $135 million, followed by the acquisition of the second portion of the portfolio in January of 2024 for $125 million. The Haynesville is one of the most active natural gas plays in North America, owing to its strong well performance and strategic proximity to infrastructure along the U.S. Gulf Coast, which reduces transportation costs and provides exposure to an expanding Liquified Natural Gas export market. The royalties consist of approximately 2,775 acres of mineral rights in East Texas and 1,330 acres in Louisiana (net to Franco-Nevada). The royalty position associated with our first acquisition is situated in a core area of the East Texas portion of the Haynesville, characterized by a shallower part of the basin where the producing Haynesville formation is thickest. TG Natural Resources (“TGNR”) acquired Rockcliff Energy in 2023 and is the principal operator in this region. Through our second acquisition, Franco-Nevada gained exposure to a broad land position in Louisiana, providing exposure to both the Haynesville and overlying Middle Bossier formations. This acreage is operated by major natural gas producers including Expand Energy, Aethon Energy, and Comstock Resources. Aethon is set to be acquired by Mitsubishi Corporation in a transaction expected to close in Q2 2026. Revenue totalled $29.8 million in 2025, representing an increase from 2024 revenues due to an increase in natural gas prices. The first acquisition achieved payback in 2025, while the second part of our portfolio is expected to achieve payback in 2036. The Haynesville has an estimated asset life of approximately 17 years³. The royalties also provide development potential in the Cotton Valley formation, which may be further exploited in the future. Haynesville N 15 0 mile 10 0 kilometer Texas Eagle Ford Barnett Haynesville Bossier NEW MEXICO Louisiana Oklahoma Arkansas Regional Basins Tuscaloosa Fayetteville Woodford Spraberry Bend Permian Basin Anadarko Basin Ardmore Basin Arkomo Basin Fort Worth Basin FNV Royalty Acreage Harrison Panola Shelby Rusk Nacogdoches San Augustine Angelina Sabine Natchitoches Red River De Soto Bienville Webster Bossier Caddo Texas Louisiana Natural gas exposure with diverse operators Close proximity to U.S. Gulf Coast enhances economics Secure land title with proven production history Franco-Nevada Corporation ★ 119 TSX / NYSE: FNV North America
W E Y B U R N U N I T Location: Saskatchewan, Canada | Operator: Whitecap Resources Inc. | Energy: Oil | Royalty: NRI: 11.71% /ORR: 0.44% / WI: 2.56% Franco-Nevada, after Whitecap Resources Inc. (“Whitecap”), has the second largest economic interest in the Weyburn Unit, one of the world’s largest geological CO 2 storage projects. 2025 2024 2023 Revenue to Franco ‑ Nevada ($ million) $ 36.9 $ 44.6 $ 50.1 Production (Mboe) 1 641 675 675 Commodity Split (%) 2 Oil 100% 100% 100% Gas 0% 0% 0% NGL 0% 0% 0% 1 Net to FNV based on 0.44% ORR, 11.71% NRI and 2.56% WI. ORR and W.I. volumes are a percentage of gross production. NRI volumes are pro-rated based on our profit, reflecting a net interest 2 Percentage based on production revenue from each commodity 3 Asset life is calculated as the P&P reserve volumes divided by the prior year production volume The Weyburn Unit is situated approximately 129 km southeast of Regina, Saskatchewan, spanning roughly 216 km 2 on a gross basis (net 31 km 2 ) in which the Mississippian Midale beds are unitized. Franco-Nevada holds a 11.71% NRI, a 0.44% ORR and a 2.56% WI in the Weyburn Unit. Production commenced from the Midale zone within the unitized area in 1955 under primary depletion (solution gas expansion). The Weyburn Unit was established in 1963 to implement a waterflood pressure maintenance program. In 2000, Cenovus, the operator at that time, initiated CO 2 injection in a portion of the Weyburn Unit as an enhanced oil recovery (“EOR”) method. At present, CO 2 is being sourced from the Dakota Gasification Company in North Dakota and the Boundary Dam power station in Saskatchewan. Gross production of the Weyburn Unit is approximately 20,800 Boe/d of light oil & NGL’s. For 2025, Franco-Nevada’s revenue from the Weyburn Unit totaled $36.9 million. Weyburn revenues are linked to the Edmonton Light oil benchmark price which averaged C$85.61/bbl in 2025. NRI revenue is recognized net of capital and operating cost deductions, resulting in increased leverage to the oil price. Oil production, including NGLs, net to Franco-Nevada was 1,755 Boe/d. Franco-Nevada takes product-in-kind for its WI and NRI shares of this production and markets it through a third-party marketer. Weyburn is a highly economic reservoir, although our NRI and WI in the unit have higher leverage to commodity price swings than our revenue-based royalties. Weyburn has an estimated asset life of approximately 19 years³. Weyburn Unit wells Unitized land Note: not to scale T7 T6 T5 R13W2 R12W2 R14W2 N Weyburn Unit Note: not to scale R15W2 R14W2 R13W2 R12W2 R11W2 R10W2 R9W2 R8W2 R15W2 R14W2 R13W2 R12W2 R11W2 R10W2 R9W2 R8W2 T9 T8 T7 T6 T5 T4 T3 T9 T8 T7 T6 T5 T4 T3 Weyburn, SK Unitized land Midale, SK N Low decline asset with proven production history CO 2 EOR project commenced in 2000 and continues to be rolled out Interests are leveraged to commodity prices TSX / NYSE: FNV 120 ★ Franco-Nevada Corporation North America
O R I O N Location: Alberta, Canada | Operator: Strathcona Resources Ltd. | Energy: Oil | Royalty: 4% Gross Overriding Royalty Franco-Nevada acquired a 4% GORR on the Orion Thermal Project in the Cold Lake region of Alberta from OSUM Oil Sands Corp. for C$92.5 million in 2017. 2025 2024 2023 Revenue to Franco ‑ Nevada ($ million) $ 12.1 $ 14.0 $ 13.6 Production (Mboe) 248 262 302 Commodity Split (%) 1 Oil 100% 100% 100% Gas 0% 0% 0% NGL 0% 0% 0% 1 Percentage based on production revenue from each commodity 2 Asset life is calculated as the P&P reserve volumes divided by the prior year production volume In 2021, OSUM was acquired by Strathcona Resources Ltd. (“Strathcona”), who currently operates the project. The royalty pertains to the Clearwater formation and allows for the deduction of transportation and diluent expenses associated with transporting the product to market. Orion is a Steam Assisted Gravity Drainage (“SAGD”) operation that commenced commercial production in 2007. The project’s infrastructure includes a central processing facility, surrounded by several well pads which supply the plant. In 2025, average production reached approximately ~17,600 barrels per day of bitumen. The asset is permitted to produce up to 25,000 barrels per day of bitumen. Franco-Nevada recorded revenue of $12.1 million in 2025. Royalty payments are based on the WCS benchmark price and are influenced by fluctuations in the differential with WTI, as well as by the cost of diluent necessary to transport the product to market. Orion has an estimated asset life of approximately 35 years 2 . Orion processing facilities, Alberta Grand Prairie Calgary Lloydminster Hardisty Edmonton Fort McMurray Cold Lake Peace River Alberta Saskatchewan Orion Athabaska Lloydminster Hardisty Edmonton Cold Lake Orion N Orion Alberta Saskatchewan Liquids Pipeline Long-life resource located in Canada Stable year-over-year production volumes Potential for future capacity expansion Franco-Nevada Corporation ★ 121 TSX / NYSE: FNV North America
O T H E R P R O D U C I N G E N E R G Y A S S E T S Location: BC / AB / SK / MB, Canada and Oregon, U.S. | Operator: Various | Royalty: ORR / FH: 0.5–20% Franco-Nevada has other interests in Western Canada which generate revenue primarily through lessor royalties and GORRs. 2025 2024 2023 Revenue to Franco ‑ Nevada ($ million) $ 8.2 $ 9.4 $ 9.0 Production (Mboe) 1 242 263 227 Commodity Split (%) 2 Oil 48% 51% 44% Gas 42% 38% 46% NGL 10% 11% 10% 1 Net to the Oil and Gas Interests and does not include production from Neal Hot Springs 2 Percentage based on production revenue from each commodity In addition to the primary producing assets outlined in the preceding pages, Franco-Nevada has 43 Other Producing Assets that generate revenue. These interests cover more than 2,250 km 2 , primarily in Canada. Within Saskatchewan and Manitoba, the assets are concentrated in high-quality oil plays and are operated by companies such as Whitecap Resources, Saturn Oil & Gas Inc., Allied Energy II Corp. and Tundra Oil & Gas Limited. The most prominent producing assets include the Midale Unit and the Tidewater royalties. Franco-Nevada holds a 1.14% gross override royalty interest and a 1.59% working interest in the Midale Unit in Southeast Saskatchewan where Cardinal Energy produces approximately 4,200 Boe/d through CO 2 Enhanced Oil Recovery (“EOR”) techniques. The Tidewater royalties in Saskatchewan generate oil production from the Shaunavon and other formations and are managed by various operators. In Alberta and British Columbia, the interests primarily generate revenue from natural gas production sourced from shallow gas formations such as Milk River and Medicine Hat. In northern Alberta, the interests provide exposure to deeper conventional gas targets including the Shunda, Grosmont and Elkton formations. Franco-Nevada’s most significant assets in the region are the Edson property operated by Canadian Natural Resources Ltd. (“CNRL”) and the Medicine Hat Consolidated Unit No.1, operated by Canlin Resources Partnership. Franco-Nevada has an approximate 15% overriding royalty in the Edson property where CNRL extracts gas and natural gas liquids by developing resources in the Cardium Formation. The Medicine Hat Unit, situated approximately 257 km southeast of Calgary, has been producing gas since 1963. Additional production is derived from both unitized and non-unitized wells, encompassing gross overriding royalty positions in ten different units across Alberta. Other operators on the interests include, CNRL and Imperial Oil. In 2020, Franco-Nevada acquired a royalty on the Neal Hot Springs geothermal operation in Oregon as part of a broader portfolio transaction. The plant produces approximately 22 MW of geothermal energy and is operated by Ormat Technologies, Inc. In 2025, Franco-Nevada received $0.29 million in revenue from Neal Hot Springs. N km 0 80 BRITISH COLUMBIA MONTANA IDAHO WASHINGTON Montney Deep Basin Edson Cardium Duvernay Alberta Bakken Lloydminster Heavy Oil Shallow Gas CBM (HSCN) Redwater Viking CALGARY Peace River Oil Sands Athabasca Oil Sands Cold Lake Oil Sands Alberta/ British Columbia Oil and Gas Interests ALBERTA EDMONTON SASKATCHEWAN Company Core Land Company Non Core Land Major City MANITOBA SASKATCHEWAN NORTH DAKOTA MONTANA Sanish Oil Torquay Oil SE Saskatchewan Lower Bakken and Mississippian Oil Williston Basin Bakken Dodsland Viking Shallow Gas Spearfish Oil REGINA Lloydminster Heavy Oil Shaunavon Oil N km 0 80 Saskatchewan/Manitoba Oil and Gas Interests Weyburn/ Midale ALBERTA Company Core Land Company Non Core Land Major City Primarily quality oil plays in Saskatchewan and Manitoba Exposure to shallow gas and deeper conventional gas in Alberta and British Columbia Interest in the Neal Hot Springs geothermal operation TSX / NYSE: FNV 122 ★ Franco-Nevada Corporation North America
Location: AB / MB / SK, Canada & Nevada, U.S | Operator: Various Royalty: 0.1–18% and WI: 2–100% In addition to its producing assets, Franco-Nevada has exposure to a portfolio of undeveloped, non-producing oil and gas interests. These are grouped into 28 different assets covering an area of over 1,500 km 2 and are located in Alberta, Saskatchewan and Manitoba along with a small amount of acreage in Nevada. Much of the interests consist of mineral title which is currently unleased. E N E R G Y E X P L O R AT I O N A S S E T S Location Big Bend Alberta Carbon Alberta Cindy/Belloy Alberta Colgate Saskatchewan Devil Alberta Dixonville Alberta Elko Mineral Rights Nevada Flatrock British Columbia Ghost Pine Alberta Granor Alberta Harvest – SK Saskatchewan Hotchkiss Alberta Inverness Alberta Killam Alberta Liege Alberta Long Coulee Alberta Melville Saskatchewan Paradise British Columbia Provost Alberta Prudential – MB Manitoba Prudential – SK Saskatchewan Steelman Saskatchewan Swift Current Saskatchewan Touchwood Alberta Turner Alberta W. Calling Lake Alberta Widewater Alberta O T H E R P R O D U C I N G E N E R G Y A S S E T S E N E R G Y E X P L O R AT I O N A S S E T S Location Alameda Oil Saskatchewan Alida Oil Saskatchewan Benson Oil Saskatchewan Carnduff Oil Saskatchewan Cessford Gas Alberta Claresholm Gas Alberta E. Crossfield Gas Alberta Edson Gas Alberta Elswick Oil Saskatchewan Enchant Gas Alberta Ferrybank Gas Alberta Hanlan Gas Alberta Harmattan Gas Alberta Harvest – AB Gas Alberta Huntoon Oil Saskatchewan Innes Oil Saskatchewan Kimiwan Gas Alberta Laglace Gas Alberta Lesser Slave Oil Alberta Lochend Gas Alberta Lone Pine Gas Alberta Macoun Oil Saskatchewan Manitoba Oil Manitoba Medicine Hat Gas Alberta Midale Royalties Oil Saskatchewan Midale WI Oil Saskatchewan Montreal Trust Oil Saskatchewan Neal Hot Springs Geothermal Oregon Oungre Oil Saskatchewan Pearmac – AB Gas Alberta Pearmac – MB Oil Manitoba Pearmac – SK Oil Saskatchewan Prudential – AB Gas Alberta Qu’Appelle Oil Saskatchewan Queensdale Oil Saskatchewan Rainbow South Oil Alberta Rocanville Oil Saskatchewan Royce Gas Alberta Stoughton Oil Saskatchewan Swalwell Gas Alberta Tidewater Oil Saskatchewan Viewfield Oil Saskatchewan Watts/Craig Oil Alberta Franco-Nevada Corporation ★ 123 TSX / NYSE: FNV North America
TSX / NYSE: FNV 124 ★ Franco-Nevada Corporation
Hoyle Pond, Timmins, Ontario | Image Courtesy of the ROM (Royal Ontario Museum), Toronto, Canada. ©ROM M i n e r a l R e s o u r c es and Mineral Reser ves
Measured (M) Indicated (I) (M)+(I) Inferred Notes Tonnes 000s Grade g/t Contained 000 oz Tonnes 000s Grade g/t Contained 000 oz Contained 000 oz Tonnes 000s Grade g/t Contained 000 oz South America Candelaria 3,4 795,303 0.13 3,294 562,429 0.13 2,305 5,599 127,911 0.11 461 Antapaccay 5 435,000 0.06 782 856,000 0.07 1,989 2,717 344,000 0.04 457 Tocantinzinho 6 23,986 1.20 927 23,669 1.32 1,001 1,928 342 1.28 14 Condestable 7 40,300 0.15 192 43,400 0.11 153 346 12,900 0.07 31 Yanacocha 1,8 35,400 1.41 1,600 114,300 1.28 4,700 6,300 363,900 0.60 6,700 Conga 1,9 — — — 693,800 0.65 14,600 14,600 230,500 0.40 2,900 Salares Norte 1,10 — — — 22,713 4.97 3,631 3,631 210 1.50 10 Sossego 1,11 334,200 0.10 1,066 498,000 0.09 1,495 2,560 55,000 0.10 177 Cerro Moro 1,12 600 6.79 131 1,100 5.46 193 324 700 6.85 146 Cascabel 13 1,647,000 0.34 18,000 2,131,000 0.20 13,500 31,400 849,000 0.19 5,300 Posse (Mara Rosa) 14 5,965 0.98 188 31,993 0.87 898 1,086 9,353 0.72 217 Taca Taca 15 441,000 0.13 1,868 1,637,000 0.07 3,847 5,715 145,000 0.06 263 CentroGold (Gurupi) 16 — — — 43,512 1.31 1,830 1,830 18,517 1.29 770 Calcatreu 17 — — — 9,841 2.11 669 669 8,078 1.34 348 PSJ Cobre Mendocino 18 10,391 0.25 83 214,662 0.17 1,178 1,260 434,972 0.13 1,832 El Alto 19 43,000 1.86 2,600 390,000 1.49 19,000 21,000 15,000 1.70 860 Volcan 20 123,979 0.70 2,792 339,274 0.64 7,013 9,804 75,018 0.52 1,246 Central America and Mexico Guadalupe-Palmarejo 1,21 9,735 1.70 531 26,124 1.70 1,424 1,956 19,203 2.05 1,265 United States Carlin Trend 22 15,610 1.31 667 195,122 3.67 24,390 24,390 95,935 3.00 9,431 Bald Mountain 1,23 5,678 1.00 188 205,572 0.54 3,585 3,773 78,862 0.30 790 Marigold 1,24 — — — 365,133 0.43 5,044 5,044 36,903 0.38 453 Mesquite 1,25 6,716 0.66 143 74,242 0.45 1,070 1,213 5,683 0.30 55 Castle Mountain 1,26 82,179 0.57 1,502 235,862 0.54 4,073 5,575 69,980 0.63 1,422 Fire Creek/Midas 1,2,27 — — — 259 13.31 111 111 70,178 1.48 3,344 Hollister 1,2,28 — — — 86 18.77 52 52 745 12.90 309 Stibnite 1,29 — — — 148,159 1.33 6,320 6,320 52,128 0.96 1,611 Sandman 30 — — — 18,550 0.73 433 433 3,246 0.58 61 Robinson 31 317,942 0.18 1,861 40,173 0.15 189 2,050 11,942 0.18 68 Nevada North (Wildcat & Mountain View) 32 — — — 88,624 0.46 1,324 1,324 26,611 0.32 270 Sleeper 1,2,33 4,902 0.54 85 158,338 0.36 1,812 1,897 119,910 0.31 1,214 Arthur 1,34 — — — 251,780 1.16 9,350 9,350 219,790 0.90 6,340 Granite Creek 35 26,493 1.29 1,103 11,980 1.54 593 1,696 2,930 4.26 401 Lone Tree 36 — — — 7,690 1.73 428 428 52,940 1.64 2,789 Cove 37 — — — 1,177 8.20 310 310 4,047 8.90 1,156 Ruby Hill - Mineral Point 38 — — — 216,982 0.48 3,376 3,376 194,442 0.34 2,117 Ruby Hill - Archimedes 39 — — — 6,111 3.60 708 708 5,058 6.27 1,019 Canada Detour Lake 1,40 155,671 0.87 4,347 1,317,621 0.74 31,385 35,732 110,991 1.73 6,168 Hemlo 41 1,750 4.89 275 2,594 4.57 381 656 1,224 7.13 281 Côté Gold 42 153,873 0.93 4,598 535,574 0.79 13,558 18,156 100,600 0.67 2,165 Porcupine - Hoyle Pond 43 — — — 1,167 12.90 484 484 578 15.24 283 Porcupine - Borden 44 1,471 6.17 292 2,274 6.15 449 741 1,372 5.22 230 Porcupine - Pamour 45 — — — 64,755 1.30 2,704 2,704 23,264 1.34 1,002 Porcupine - Dome 46 — — — — — — — 229,284 1.49 10,978 Greenstone 1,47 6,817 1.16 255 167,813 1.42 7,663 7,918 26,371 3.26 2,763 Kirkland Lake 1,48 1,121 9.66 348 26,099 4.41 3,697 4,047 31,076 3.62 3,618 Musselwhite 1,49 5,660 6.02 1,096 5,520 5.28 937 2,032 1,860 4.99 299 Sudbury 1,50 — — — 5,278 0.44 75 75 1,424 0.36 16 Brucejack 1,51 — — — 17,800 6.12 3,500 3,500 14,500 5.30 2,500 Magino 1,52 49,151 0.79 1,248 120,788 0.86 3,332 4,580 14,045 0.75 338 Casa Berardi 1,2,53 9,380 3.19 962 11,443 3.75 1,378 2,340 2,500 6.13 493 Heva-Hosco 1,2,54 — — — 31,711 1.16 1,179 1,179 17,688 1.22 691 Dublin Gulch (Eagle) 55 35,237 0.62 705 197,960 0.57 3,596 4,304 29,595 0.52 497 Timmins 1,56 7,000 2.68 604 6,700 2.54 548 1,152 5,700 2.98 546 Gold River 1,57 — — — 700 5.29 117 117 5,300 6.06 1,027 Canadian Malartic 1,58 36,896 0.50 597 81,688 2.58 6,781 7,378 99,289 2.35 7,490 Island Gold 1,59 1,452 11.42 533 15,713 10.29 5,198 5,731 2,867 11.51 1,061 Golden Highway - Holt Complex 1,60 5,806 4.29 800 5,884 4.75 898 1,699 9,097 4.48 1,310 Golden Highway - Hislop 1,61 — — — 1,337 4.00 173 173 804 3.80 97 Golden Highway - Aquarius 1,62 — — — 12,364 2.15 856 856 122 3.59 14 Valentine Gold 1,63 33,368 1.75 1,880 46,746 1.43 2,146 4,027 20,312 1.65 1,079 Eskay Creek 64 28,648 3.37 3,106 23,252 1.71 1,275 4,380 924 2.26 67 Red Lake (McFinley) 65 — — — 2,130 4.63 317 317 1,780 3.84 220 Courageous Lake 66 6,007 2.84 548 139,167 2.34 10,449 10,997 44,737 2.67 3,841 Goldfields 67 — — — 24,000 1.28 990 990 7,400 0.90 214 Monument Bay 68 — — — 36,581 1.52 1,787 1,787 41,946 1.32 1,781 Red Mountain 69 1,920 8.81 544 1,271 5.85 239 783 405 5.32 69 Fenelon-Martiniere 70 — — — 19,790 3.30 2,100 2,100 18,899 3.35 2,037 Spences Bridge (Shovelnose) 71 — — — 3,437 6.13 677 677 2,292 3.67 270 Wawa 72 — — — 14,653 1.79 842 842 16,183 1.62 843 Kerr-Addison 73 — — — 69,252 1.50 3,311 3,311 55,611 1.30 2,369 Clarence Stream 74 — — — 12,396 2.31 922 922 15,963 2.60 1,334 Scottie 75 — — — — — — — 3,604 6.06 703 AurMac 76 — — — 112,500 0.63 2,274 2,274 280,600 0.60 5,453 G O L D M I N E R A L R E S O U R C E S ( I N C L U S I V E O F M I N E R A L R E S E R V E S ) TSX / NYSE: FNV 126 ★ Franco-Nevada Corporation Mineral Resources and Mineral Reserves
Measured (M) Indicated (I) (M)+(I) Inferred Notes Tonnes 000s Grade g/t Contained 000 oz Tonnes 000s Grade g/t Contained 000 oz Contained 000 oz Tonnes 000s Grade g/t Contained 000 oz Australia Duketon 77 10,000 0.80 270 61,000 1.20 2,320 2,590 16,000 1.30 680 Matilda (Wiluna) 78 2,760 3.90 346 54,200 1.50 2,609 2,955 34,800 3.62 4,046 South Kalgoorlie 79 2,506 4.40 357 19,881 2.60 1,635 1,992 14,405 2.50 1,162 Yilgarn Star 80 1,976 3.68 234 2,350 4.84 366 600 1,489 6.79 325 Agate Creek 1,81 447 2.04 29 9,403 0.98 297 326 6,090 0.67 132 Mt Martin 82 — — — 5,600 1.40 248 248 3,690 1.61 192 Cue 83 460 4.40 66 5,900 2.00 390 456 4,500 2.00 290 Yandal (Bronzewing) 84 21,059 1.40 949 52,804 1.80 3,080 4,029 12,108 1.60 636 Aphrodite 85 — — — 10,000 2.80 930 930 13,000 1.70 690 Red October 1,86 105 8.40 28 608 5.40 105 133 4,492 4.07 587 Henty 87 — — — 3,250 3.33 347 347 860 3.29 91 Bullabulling 88 — — — 93,000 1.00 3,000 3,000 42,000 1.10 1,500 Rebecca 89 — — — 27,000 1.30 1,100 1,100 6,500 1.20 240 Edna May 90 720 1.10 25 23,000 1.00 700 725 7,000 1.00 220 Glenburgh 91 — — — 13,500 1.00 431 431 2,800 0.90 79 Rest of World Subika (Ahafo) 1,92 32,600 1.53 1,600 97,300 2.53 7,900 9,500 22,700 2.70 2,000 Tasiast 1,93 76,861 0.91 2,252 104,971 1.35 4,545 6,797 35,950 2.10 2,377 Sabodala-Massawa Complex 94 16,900 1.21 661 63,100 2.23 4,529 5,190 27,200 2.02 1,766 Karma 95 300 0.40 4 47,700 1.24 1,894 1,898 16,200 1.30 679 Edikan 96 13,100 0.96 407 24,700 1.08 857 1,265 6,600 1.58 336 Kiziltepe 97 832 1.60 43 976 1.72 54 97 1,009 1.47 48 Séguéla 1,98 626 1.39 28 20,490 3.00 1,974 2,004 9,171 2.50 736 Perama Hill 99 2,890 4.30 412 6,194 2.49 496 908 31,831 2.10 2,145 Aği Daği 1,100 2,516 0.74 60 104,453 0.63 2,132 2,192 19,551 0.52 330 Sissingué 101 900 1.13 34 3,800 1.41 174 208 200 1.10 5 Rogozna 102 — — — — — — — 211,000 0.76 5,200 Total Gold Mineral Resources* 70,145 300,923 369,654 146,485 G O L D M I N E R A L R E S O U R C E S ( I N C L U S I V E O F M I N E R A L R E S E R V E S ) *Total excludes Cobre Panamá and New Prosperity Franco-Nevada Corporation ★ 127 TSX / NYSE: FNV Mineral Resources and Mineral Reserves
G O L D M I N E R A L R E S E R V E S Proven Probable Proven and Probable Notes Tonnes 000s Grade g/t Contained 000 oz Tonnes 000s Grade g/t Contained 000 oz Tonnes 000s Grade g/t Contained 000 oz South America Candelaria 3,4 345,438 0.11 1,206 247,274 0.10 834 592,712 0.11 2,040 Antapaccay 5 170,000 0.05 273 257,000 0.07 578 427,000 0.06 824 Tocantinzinho 6 25,545 1.14 939 24,240 1.20 935 49,784 1.17 1,874 Condestable 7 18,800 0.16 94 20,700 0.11 76 39,500 0.13 170 Yanacocha 8 18,800 0.81 500 — — — 18,800 0.81 500 Conga 9 — — — — — — — — — Salares Norte 10 — — — 19,821 5.40 3,415 19,821 5.40 3,415 Sossego 11 17,100 0.27 148 42,000 0.13 176 59,100 0.17 323 Cerro Moro 12 300 9.94 92 300 5.59 58 600 7.65 150 Cascabel 13 457,500 0.60 8,855 82,200 0.22 579 539,700 0.54 9,433 Posse (Mara Rosa) 14 5,009 1.06 171 24,447 0.95 747 29,456 0.97 917 Taca Taca 15 432,100 0.13 1,836 1,558,000 0.07 3,697 1,990,100 0.09 5,532 CentroGold (Gurupi) 16 — — — — — — — — — Calcatreu 17 — — — — — — — — — PSJ Cobre Mendocino 18 — — — — — — — — — El Alto 19 — — — — — — — — — Volcan 20 — — — — — — — — — Central America and Mexico Guadalupe-Palmarejo 21 5,137 1.79 295 13,927 1.41 632 19,064 1.51 928 United States Carlin Trend 22 8,130 1.56 407 113,821 3.81 13,984 121,951 3.66 14,309 Bald Mountain 23 — — — 66,306 0.60 1,225 66,306 0.60 1,225 Marigold 24 — — — 238,504 0.42 3,237 238,504 0.42 3,237 Mesquite 25 — — — 5,045 0.77 125 5,045 0.77 125 Castle Mountain 26 81,398 0.57 1,485 162,410 0.50 2,620 243,808 0.52 4,105 Fire Creek/Midas 2,27 — — — — — — — — — Hollister 2,28 — — — — — — — — — Stibnite 29 — — — 104,625 1.43 4,819 104,625 1.43 4,819 Sandman 30 — — — — — — — — — Robinson 31 110,513 0.15 545 8,860 0.12 34 119,374 0.15 579 Nevada North (Wildcat & Mountain View) 32 — — — — — — — — — Sleeper 2,33 — — — — — — — — — Arthur 34 — — — 87,640 1.75 4,940 87,640 1.75 4,940 Granite Creek 35 — — — — — — — — — Lone Tree 36 — — — — — — — — — Cove 37 — — — — — — — — — Ruby Hill - Mineral Point 38 — — — — — — — — — Ruby Hill - Archimedes 39 — — — — — — — — — Canada Detour Lake 40 120,371 0.78 3,035 677,690 0.71 15,540 798,061 0.72 18,575 Hemlo 41 — — — 3,746 3.93 473 3,746 3.93 473 Côté Gold 42 116,055 1.05 3,902 101,112 0.97 3,139 217,167 1.01 7,041 Porcupine - Hoyle Pond 43 — — — — — — — — — Porcupine - Borden 44 — — — — — — — — — Porcupine - Pamour 45 — — — — — — — — — Porcupine - Dome 46 — — — — — — — — — Greenstone 47 6,817 1.16 255 137,846 1.23 5,445 144,662 1.23 5,700 Kirkland Lake 48 742 9.36 223 8,068 7.62 1,976 8,810 7.77 2,200 Musselwhite 49 4,150 6.69 892 3,230 6.10 635 7,380 6.43 1,526 Sudbury 50 — — — 987 0.32 10 987 0.32 10 Brucejack 51 — — — 13,500 6.65 2,900 13,500 6.65 2,900 Magino 52 42,437 0.80 1,097 70,704 0.90 2,044 113,141 0.86 3,141 Casa Berardi 2,53 5,573 2.58 463 7,199 3.00 695 12,772 2.82 1,158 Heva-Hosco 2,54 — — — — — — — — — Dublin Gulch (Eagle) 55 21,100 0.68 464 96,600 0.63 1,943 117,700 0.64 2,407 Timmins 56 5,000 2.79 451 4,600 2.68 395 9,600 2.74 846 Gold River 57 — — — — — — — — — Canadian Malartic 58 36,896 0.50 597 76,640 2.66 6,551 113,537 1.96 7,148 Island Gold 59 1,123 11.50 415 13,949 10.54 4,726 15,072 10.61 5,141 Golden Highway - Holt Complex 60 — — — — — — — — — Golden Highway - Hislop 61 — — — — — — — — — Golden Highway - Aquarius 62 — — — — — — — — — Valentine Gold 63 23,400 1.89 1,400 28,200 1.40 1,300 51,600 1.62 2,700 Eskay Creek 64 27,954 3.00 2,657 11,889 1.80 680 39,843 2.60 3,336 Red Lake (McFinley) 65 — — — 400 5.66 78 400 5.66 78 Courageous Lake 66 2,000 3.50 200 31,900 2.60 2,600 33,900 2.60 2,800 Goldfields 67 — — — — — — — — — Monument Bay 68 — — — — — — — — — Red Mountain 69 2,194 6.68 471 351 5.51 62 2,545 6.52 534 Fenelon-Martiniere 70 — — — — — — — — — Spences Bridge (Shovelnose) 71 — — — — — — — — — Wawa 72 — — — — — — — — — Kerr-Addison 73 — — — — — — — — — Clarence Stream 74 — — — — — — — — — Scottie 75 — — — — — — — — — AurMac 76 — — — — — — — — — TSX / NYSE: FNV 128 ★ Franco-Nevada Corporation Mineral Resources and Mineral Reserves
*Total excludes Cobre Panamá and New Prosperity G O L D M I N E R A L R E S E R V E S Proven Probable Proven and Probable Notes Tonnes 000s Grade g/t Contained 000 oz Tonnes 000s Grade g/t Contained 000 oz Tonnes 000s Grade g/t Contained 000 oz Australia Duketon 77 9,000 0.70 191 21,000 1.30 891 30,000 1.10 1,082 Matilda (Wiluna) 78 — — — 5,379 2.00 345 5,379 2.00 345 South Kalgoorlie 79 1,052 5.20 176 5,035 3.30 538 6,087 3.70 714 Yilgarn Star 80 — — — — — — — — — Agate Creek 81 87 3.30 9 373 2.30 28 460 2.50 37 Mt Martin 82 — — — — — — — — — Cue 83 — — — 3,800 2.00 250 3,800 2.00 250 Yandal (Bronzewing) 84 15,658 1.20 622 19,844 2.10 1,341 35,502 1.70 1,962 Aphrodite 85 — — — — — — — — — Red October 86 — — — — — — — — — Henty 87 — — — 1,890 3.28 199 1,890 3.28 199 Bullabulling 88 — — — — — — — — — Rebecca 89 — — — 17,900 1.24 716 17,900 1.24 716 Edna May 90 — — — — — — — — — Glenburgh 91 — — — — — — — — — Rest of World Subika (Ahafo) 92 30,400 1.44 1,400 50,900 1.63 2,700 81,300 1.56 4,100 Tasiast 93 55,584 1.00 1,806 47,181 1.70 2,595 102,765 1.30 4,401 Sabodala-Massawa Complex 94 14,800 1.12 531 28,000 2.48 2,237 42,800 2.01 2,768 Karma 95 300 0.40 4 5,200 0.93 154 5,500 0.90 158 Edikan 96 8,600 0.91 250 9,300 1.27 380 17,900 1.09 629 Kiziltepe 97 451 1.76 26 287 1.81 17 738 1.78 42 Séguéla 98 626 1.39 28 15,335 3.07 1,513 15,961 3.01 1,543 Perama Hill 99 3,000 4.36 421 5,909 2.59 491 8,910 3.18 912 Aği Daği 100 1,450 0.76 36 52,911 0.66 1,130 54,361 0.67 1,166 Sissingué 101 400 1.70 23 1,800 1.95 111 2,200 1.90 134 Rogozna 102 — — — — — — — — — Total Gold Mineral Reserves* 38,890 109,538 148,318 Franco-Nevada Corporation ★ 129 TSX / NYSE: FNV Mineral Resources and Mineral Reserves
M I N E R A L R E S O U R C E S A N D M I N E R A L R E S E R V E S Silver Mineral Resources - Inclusive of Mineral Reserves Measured (M) Indicated (I) (M)+(I) Silver Inferred Mineral Resources Notes Tonnes 000s Grade g/t Contained 000 oz Tonnes 000s Grade g/t Contained 000 oz Contained 000 oz Tonnes 000s Grade g/t Contained 000 oz Candelaria 4,103 795,303 1.85 47,255 562,429 1.99 36,022 83,277 127,911 1.39 5,735 Antapaccay 104 435,000 1.22 17,111 856,000 1.90 52,216 68,291 344,000 0.79 8,735 Antamina 1,105,106 359,000 9.73 112,361 508,100 12.01 196,168 308,980 1,256,300 10.50 424,105 Condestable 107 40,300 4.18 5,419 43,400 3.15 4,396 9,815 12,900 2.28 947 Yanacocha 1,108 19,300 6.41 4,000 236,500 12.07 91,800 95,800 104,700 14.10 47,300 Conga 1,109 — — — 693,800 2.06 45,900 45,900 175,000 1.10 6,300 Salares Norte 1,110 — — — 22,713 66.89 48,845 48,845 210 8.30 56 Cerro Moro 1,111 600 222.91 4,300 1,100 254.48 9,000 13,400 700 164.00 3,500 Cascabel 112 1,576,000 1.16 58,600 1,437,000 0.71 32,700 91,300 607,000 0.56 11,000 Calcatreu 113 — — — 9,841 19.80 6,275 6,275 8,078 13.10 3,399 Fire Creek/Midas 1,2,114 — — — 259 83.20 694 694 70,178 6.29 14,199 Stibnite 1,115 — — — 148,159 1.97 9,400 9,400 52,128 1.40 2,345 Eskay Creek 116 28,648 89.45 82,391 23,252 32.97 24,644 107,035 924 30.36 902 Perama Hill 117 2,890 4.00 372 6,194 5.00 929 1,302 16,961 11.27 6,148 Nevada North (Wildcat & Mountain View) 118 — — — 88,624 3.45 9,840 9,840 26,611 2.60 2,224 Spences Bridge (Shovelnose) 119 — — — 3,437 32.30 3,565 3,565 2,292 25.20 1,860 Sleeper 1,2,120 4,902 3.62 570 158,338 4.06 20,661 21,231 119,910 2.45 9,454 Cove 121 — — — 1,177 15.00 568 568 4,047 11.10 1,439 Ruby Hill - Mineral Point 122 — — — 216,982 15.00 104,332 104,332 194,442 14.60 91,473 Ruby Hill - Archimedes 123 — — — 6,111 8.05 1,582 1,582 5,058 3.30 536 Arthur 1,124 — — — 251,780 3.13 25,350 25,350 219,790 2.26 15,960 Copper Creek 125 67,200 1.20 2,600 59,900 0.60 1,100 3,800 48,100 0.50 700 Vizcachitas 126 273,000 1.30 11,000 1,268,000 1.00 43,000 54,000 1,823,000 0.90 55,000 Rogozna 127 — — — — — — — 211,000 4.80 32,300 Total Silver Mineral Resources* 345,979 768,987 1,114,582 745,616 *Total excludes Cobre Panamá Silver Mineral Reserves Proven Probable Proven and Probable Notes Tonnes 000s Grade g/t Contained 000 oz Tonnes 000s Grade g/t Contained 000 oz Tonnes 000s Grade g/t Contained 000 oz Candelaria 4,103 345,438 1.34 14,827 247,274 1.53 12,155 592,712 1.42 26,981 Antapaccay 104 170,000 1.00 5,466 257,000 1.30 10,742 427,000 1.20 16,474 Antamina 105,106 260,200 9.90 82,820 268,200 13.00 112,097 528,400 11.50 195,367 Condestable 107 18,800 4.82 2,919 20,700 3.50 2,333 39,500 4.13 5,252 Yanacocha 108 — — — 68,300 8.82 19,400 68,300 8.82 19,400 Conga 109 — — — — — — — — — Salares Norte 110 — — — 19,821 72.21 46,013 19,821 72.21 46,013 Cerro Moro 111 300 223.00 2,100 300 282.00 2,900 600 254.00 5,000 Cascabel 112 457,500 1.70 24,942 82,200 1.20 3,093 539,700 1.60 28,034 Calcatreu 113 — — — — — — — — — Fire Creek/Midas 2,114 — — — — — — — — — Stibnite 115 — — — 104,625 1.91 6,430 104,625 1.91 6,430 Eskay Creek 116 27,954 80.90 72,661 11,889 40.10 15,308 39,843 68.70 87,969 Perama Hill 117 3,000 3.88 374 5,909 4.78 909 8,910 4.48 1,283 Nevada North (Wildcat & Mountain View) 118 — — — — — — — — — Spences Bridge (Shovelnose) 119 — — — — — — — — — Sleeper 2,120 — — — — — — — — — Cove 121 — — — — — — — — — Ruby Hill - Mineral Point 122 — — — — — — — — — Ruby Hill - Archimedes 123 — — — — — — — — — Arthur 124 — — — 87,640 2.76 7,780 87,640 2.76 7,780 Copper Creek 125 — — — — — — — — — Vizcachitas 126 302,247 1.20 11,900 917,685 1.10 31,800 1,219,932 1.10 43,600 Rogozna 127 — — — — — — — — — Total Silver Mineral Reserves* 218,008 270,959 489,583 *Total excludes Cobre Panamá PGM Mineral Resources – Inclusive of Mineral Reserves Measured (M) Indicated (I) (M)+(I) PGM Inferred Mineral Resources Notes Tonnes 000s Grade g/t Contained 000 oz Tonnes 000s Grade g/t Contained 000 oz Contained 000 oz Tonnes 000s Grade g/t Contained 000 oz Stillwater 128 41,000 15.40 20,200 44,100 13.80 19,600 39,800 96,500 13.20 41,100 Western Limb 129,130 580,225 3.82 71,200 826,252 4.07 108,100 179,400 278,889 4.35 39,000 Sudbury 1,131 — — — 5,278 3.05 517 517 1,424 2.47 113 Eagle’s Nest 132 4,727 5.19 789 4,288 4.48 618 1,408 6,750 4.35 943 Marathon (Sally) 133 — — — 24,801 0.62 494 494 14,019 0.48 218 Total PGM Mineral Resources 92,189 129,329 221,618 81,374 PGM Mineral Reserves Proven Probable Proven and Probable Notes Tonnes 000s Grade g/t Contained 000 oz Tonnes 000s Grade g/t Contained 000 oz Tonnes 000s Grade g/t Contained 000 oz Stillwater 128 7,900 14.80 3,700 37,100 13.10 15,600 45,000 13.40 19,400 Western Limb 129, 130 141,651 3.47 15,800 221,047 2.81 20,000 362,698 3.08 35,900 Sudbury 131 — — — 987 2.37 75 987 2.37 75 Eagle’s Nest 132 — — — — — — — — — Marathon (Sally) 133 — — — — — — — — — Total PGM Mineral Reserves 19,500 35,675 55,375 TSX / NYSE: FNV 130 ★ Franco-Nevada Corporation Mineral Resources and Mineral Reserves
M I N E R A L R E S O U R C E S A N D M I N E R A L R E S E R V E S Copper Mineral Resources – Inclusive of Mineral Reserves Measured (M) Indicated (I) (M)+(I) Copper Inferred Mineral Resources Notes Tonnes 000s Grade % Contained Mlbs Tonnes 000s Grade % Contained Mlbs Contained Mlbs Tonnes 000s Grade % Contained Mlbs Yanacocha 1,134 3,700 0.29 — 114,100 0.61 1,543 1,543 134,900 0.40 1,102 Conga 1,135 — — — 693,800 0.26 3,968 3,968 230,500 0.20 882 Copper Creek 136 67,200 0.48 711 59,900 0.31 413 1,123 48,100 0.28 298 Sossego 1,137 334,200 0.66 4,883 498,000 0.59 6,512 11,453 55,000 0.70 849 Cascabel 138 1,647,000 0.42 15,093 2,131,000 0.26 12,304 27,397 849,000 0.23 4,339 NuevaUnión (Relincho) 1,139 895,400 0.29 5,657 1,440,400 0.33 10,411 15,980 724,700 0.36 5,752 Taca Taca 140 441,000 0.58 5,637 1,637,000 0.38 13,578 19,215 145,000 0.27 858 Caserones 141 357,020 0.33 2,637 938,920 0.26 5,300 7,937 74,766 0.20 324 Vizcachitas 142 273,000 0.43 2,605 1,268,000 0.37 10,416 13,021 1,823,000 0.34 13,747 Copper World/East Pit 1,143 902,400 0.42 8,429 326,700 0.37 2,670 11,097 275,000 0.32 1,940 Robinson 144 317,942 0.47 3,261 40,173 0.34 305 3,566 11,942 0.38 100 Rogozna 145 — — — — — — — 211,000 0.15 708 Total Copper Mineral Resources 48,913 67,421 116,300 30,898 Copper Mineral Reserves Proven Probable Proven and Probable Notes Tonnes 000s Grade % Contained Mlbs Tonnes 000s Grade % Contained Mlbs Tonnes 000s Grade % Contained Mlbs Yanacocha 134 — — — — — — — — — Conga 135 — — — — — — — — — Copper Creek 136 — — — — — — — — — Sossego 137 17,100 0.90 339 42,000 0.41 380 59,100 0.55 717 Cascabel 138 457,500 0.64 6,475 82,200 0.36 653 539,700 0.60 7,128 NuevaUnión (Relincho) 139 576,400 0.34 4,321 977,400 0.36 7,757 1,553,800 0.35 11,989 Taca Taca 140 432,100 0.58 5,532 1,558,000 0.38 13,049 1,990,100 0.42 18,582 Caserones 141 310,112 0.34 2,317 486,958 0.27 2,923 797,070 0.30 5,240 Vizcachitas 142 302,247 0.41 2,714 917,685 0.34 6,908 1,219,932 0.36 9,623 Copper World/East Pit 143 319,400 0.54 3,802 65,700 0.52 753 385,100 0.54 4,585 Robinson 144 110,513 0.42 1,025 8,860 0.28 54 119,374 0.41 1,079 Rogozna 145 — — — — — — — — — Total Copper Mineral Reserves 26,526 32,477 58,942 Nickel Mineral Resources – Inclusive of Mineral Reserves Measured (M) Indicated (I) (M)+(I) Nickel Inferred Mineral Resources Notes Tonnes 000s Grade % Contained Mlbs Tonnes 000s Grade % Contained Mlbs Contained Mlbs Tonnes 000s Grade % Contained Mlbs Falcondo 146 40,500 1.42 1,268 31,100 1.53 1,049 2,320 4,900 1.40 151 Eagle’s Nest 147 4,727 2.24 234 4,288 1.50 141 375 6,750 1.67 249 Crawford 148 1,097,100 0.24 5,904 1,464,700 0.23 7,402 13,306 1,693,200 0.22 8,215 Mt Keith 149 132,000 0.54 1,571 67,000 0.52 768 2,340 24,000 0.52 275 Total Nickel Mineral Resources 8,977 9,360 18,340 8,891 Nickel Mineral Reserves Proven Probable Proven and Probable Notes Tonnes 000s Grade % Contained Mlbs Tonnes 000s Grade % Contained Mlbs Tonnes 000s Grade % Contained Mlbs Falcondo 146 44,900 1.28 1,267 26,300 1.36 789 71,200 1.31 2,056 Eagle’s Nest 147 — — — — — — — — — Crawford 148 994,000 0.24 5,172 721,000 0.20 3,183 1,715,000 0.22 8,356 Mt Keith 149 — — — — — — — — — Total Nickel Mineral Reserves 6,439 3,972 10,412 Chromite Mineral Resources – Inclusive of Mineral Reserves Measured (M) Indicated (I) Chromite Inferred Mineral Resources Notes Tonnes 000s Grade % Cr203 Tonnes 000s Grade % Cr203 Tonnes 000s Grade % Cr203 Ring of Fire 150 140,190 32.5 52,573 29.8 54,581 30.8 Total Chromite Mineral Resources 140,190 52,573 54,581 Chromite Mineral Reserves Proven Probable Proven and Probable Notes Tonnes 000s Grade % Cr203 Tonnes 000s Grade % Cr203 Tonnes 000s Grade % Cr203 Ring of Fire 150 — — — — — — Total Chromite Mineral Reserves* — — — *No Mineral Reserve estimate has been reported for the Ring of Fire Franco-Nevada Corporation ★ 131 TSX / NYSE: FNV Mineral Resources and Mineral Reserves
Iron Ore Mineral Resources – Inclusive of Mineral Reserves Measured (M) Indicated (I) Iron Ore Inferred Mineral Resources Notes Tonnes 000s Grade % Fe Tonnes 000s Grade % Fe Tonnes 000s Grade % Fe Vale (Northern & Southeastern System) 1,151 8,316,000 52.7 10,720,300 53.0 4,709,000 43.9 LIORC 1,152,153 523,000 39.3 1,229,000 39.0 662,000 39.0 Total Iron Ore Mineral Resources 8,839,000 11,949,300 5,371,000 Iron Ore Mineral Reserves Proven Probable Proven and Probable Notes Tonnes 000s Grade % Fe Tonnes 000s Grade % Fe Tonnes 000s Grade % Fe Vale (Northern & Southeastern System) 151 2,873,600 59.2 5,182,600 59.8 8,056,300 59.6 LIORC 152,153 352,000 39.0 571,000 39.0 923,000 39.0 Total Iron Ore Mineral Reserves 3,225,600 5,753,600 8,979,300 N O T E S A N D S O U R C E S 1 Mineral Resources reported by operator exclusive of Mineral Reserves. Franco-Nevada’s Qualified Person determined the inclusive Mineral Resources by adding the exclusive Measured and Indicated Mineral Resources to the Proven and Probable Reserves 2 Mineral Resources and Mineral Reserves are reported by the operator in non-metric units. Franco-Nevada’s Qualified Person calculated the metric conversion using 1 opt = 34.286 g/t, 1 short ton = 0.9072 metric tonnes, 1 oz = 31.1035 g 3 Lundin Mining Corporation; News Release, February 18, 2026 4 The stream agreement applies to 100% of the property, but only with respect to the ownership interest of Lundin Mining Corporation which indirectly owns 80% of the Candelaria Copper Mining Complex 5 Glencore plc; Resources & Reserves as at December 31, 2025 6 G Mining Ventures Corp.; News Release, March 12, 2026 7 Rio2 Limited; Corporate Presentation, December 8, 2025 8 Newmont Corporation; News Release, February 19, 2026 9 Newmont Corporation; News Release, February 19, 2026 10 Gold Fields Limited; Mineral Resources and Mineral Reserves Supplement to the Integrated Annual Report 2024, March 31, 2025 11 Vale S.A.; Form 20-F, March 28, 2025. Details of Vale’s Participating Debentures are available on Vale’s website 12 Pan American Silver Corp.; News Release, September 11, 2025 & Corporate Website 13 SolGold plc; Annual Information Form, September 24, 2025 (Alpala & Tandayama America Underground) & News Release, November 26, 2025 (Tandayama America Open Pit) 14 Hochschild Mining PLC; News Release, March 11, 2026 15 First Quantum Minerals Ltd.; Taca Taca Project NI 43-101 Technical Report, February 19, 2026 16 G Mining Ventures Corp.; Corporate Presentation, March 2026 17 Patagonia Gold Corp.; MD&A, November 27, 2025 18 Minera San Jorge SA; Disclosure to Franco-Nevada Corporation, Mineral Resource Estimate Update for the San Jorge Deposit, March 9, 2026 19 Barrick Gold Corporation; Management’s Discussion and Analysis (“MD&A”) Fourth Quarter and Full Year 2025, February 5, 2026 20 Hochschild Mining PLC; News Release, March 11, 2026 21 Coeur Mining, Inc.; Corporate Presentation, February 23, 2026 22 Barrick Gold Corporation; Management’s Discussion and Analysis (“MD&A”) Fourth Quarter and Full Year 2025, February 5, 2026. Carlin Trend includes Goldstrike, Gold Quarry and South Arturo as well as other properties where Franco-Nevada has no royalties or stream interests 23 Kinross Gold Corporation; News Release, February 18, 2026 24 SSR Mining Inc.; Mineral Reserve and Resource Tables as of December 31, 2025, February 17, 2026 25 Equinox Gold Corp.; Corporate Presentation, February 2026 26 Equinox Gold Corp.; Corporate Presentation, February 2026 • All Mineral Resources and Mineral Reserves have been calculated in accordance with CIM or Acceptable Foreign Codes for the purposes of NI 43-101, including Regulation S-K 1300, JORC, or SAMREC guidelines • Mineral Resources, which are not Mineral Reserves, do not have demonstrated economic viability • Unless otherwise noted, Mineral Resources were reported by the operator inclusive of Mineral Reserves • Contained metal does not take into account recovery losses • Franco-Nevada’s royalties or stream interests may not cover the operator’s entire property or all estimated Mineral Resources and Mineral Reserves or a combination of both • The grade of platinum group elements has been reported by the operators as either the sum of the individual platinum group elements grades or the individual grades. In the cases where individual platinum group element grades have been reported, Franco-Nevada’s Qualified Person has calculated the sum of the platinum group element grades for presentation purposes • Mineral Resources and Mineral Reserves based on publicly disclosed information available as of March 12, 2026 but includes assets subsequently acquired by Franco-Nevada • The MRMR statement might have excluded depletion prior to this year’s reporting • Rows and columns may not total precisely due to rounding • Inferred Resources are in addition to Measured and Indicated Resources, as described in the “Technical and Third-Party Information” section on page 144 of this Asset Handbook 27 Hecla Mining Company; News Release, February 13, 2026 28 Hecla Mining Company; News Release, February 13, 2026 29 Perpetua Resources Corp., Form 10-K, April 2, 2025 30 Borealis Mining Company Ltd. & Gold Bull Resources Corp.; News Release, December 10, 2024 31 KGHM Polska Miedź S.A.; Mineral Resources and Reserves Report, December 31, 2014 32 Integra Resources Corp.; Corporate Presentation, February 2026 33 Paramount Gold Nevada Corp.; Form 10-K; September 25, 2025 34 AngloGold Ashanti plc; Q4 2025 & Full Year Earnings Release, February 20, 2026 35 i-80 Gold Corp.; Corporate Presentation, March 2026 36 i-80 Gold Corp.; Corporate Presentation, March 2026 37 i-80 Gold Corp.; Corporate Presentation, March 2026 38 i-80 Gold Corp.; Corporate Presentation, March 2026 39 i-80 Gold Corp.; Corporate Presentation, March 2026 40 Agnico Eagle Mines Limited; News Release, February 12, 2026 41 Hemlo Mining Corp.; Corporate Presentation, February 2026 42 IAMGOLD Corporation; New Release, February 17, 2026 43 Discovery Silver Corp.; Investor Day Presentation, March 2, 2026 44 Discovery Silver Corp.; Investor Day Presentation, March 2, 2026 45 Discovery Silver Corp.; Investor Day Presentation, March 2, 2026 46 Discovery Silver Corp.; Investor Day Presentation, March 2, 2026 47 Equinox Gold Corp.; Corporate Presentation, February 2026 48 Agnico Eagle Mines Limited; News Release, February 12, 2026 49 Orla Mining Ltd.; Corporate Presentation, March 2026 50 Magna Mining Inc.; Corporate Presentation, March 2026 51 Newmont Corporation; News Release, February 19, 2026 52 Alamos Gold Inc.; News Release, February 17, 2026 53 Hecla Mining Company; News Release, February 13, 2026 54 Hecla Mining Company; News Release, February 13, 2026 55 Victoria Gold Corp.; Eagle Gold Mine NI 43-101 Technical Report, April 10, 2023 56 Pan American Silver Corp.; News Release, September 11, 2025 57 Pan American Silver Corp.; News Release, September 11, 2025 58 Agnico Eagle Mines Limited; News Release, February 12, 2026 59 Alamos Gold Inc.; News Release, February 17, 2026 60 Agnico Eagle Mines Limited; News Release, February 12, 2026 61 Kirkland Lake Gold Ltd.; News Release, February 25, 2021 62 Agnico Eagle Mines Limited; News Release, February 12, 2026 63 Equinox Gold Corp.; Corporate Presentation, February 2026 M I N E R A L R E S O U R C E S A N D M I N E R A L R E S E R V E S TSX / NYSE: FNV 132 ★ Franco-Nevada Corporation Mineral Resources and Mineral Reserves
64 Skeena Resources Limited; Eskay Creek Project NI 43-101 Technical Report, November 14, 2023 65 Evolution Mining Limited; ASX Announcement, February 14, 2024 66 Seabridge Gold Inc.; Courageous Lake Pre-feasibility study and Preliminary Economic Assessment NI 43-101 Technical Report, January 5, 2024 67 Fortune Bay Corp.; Goldfields Project Updated NI 43-101 Technical Report & Preliminary Economic Assessment, October 20, 2025 68 Agnico Eagle Mines Limited; News Release, February 16, 2023 69 Ascot Resources Ltd.; Annual Information Form, March 24, 2025 70 Wallbridge Mining Company Limited.; NI 43-101 Technical Report and Preliminary Economic Assessment Update on the Fenelon Gold Project, Quebec, Canada, March 26, 2025 71 Westhaven Gold Corp.; Updated Preliminary Economic Assessment and Mineral Resource Estimate of the Shovelnose Gold Project, April 17, 2025 72 Red Pine Exploration Inc.; Wawa Gold Project NI 43-101 Technical Report, September 30, 2024 73 Gold Candle Ltd.; Corporate Presentation, February 2026 74 Galway Metals Inc.; Corporate Presentation, January 2026 75 Scottie Resources Corp; News Release, May 7, 2025 76 Banyan Gold Corp.; News Release, March 1, 2026 77 Regis Resources Limited; ASX Announcement, May 20, 2025 78 Wiluna Mining Corporation Limited; 2024 & 2025 Annual General Meetings, November 28, 2025 and ASX Announcement, February 16, 2024 79 Northern Star Resources Limited; ASX Announcement, May 15, 2025 80 Barto Gold Mining Pty Ltd, Annual Mineral Resource Statement as at August 31, 2024 81 Savannah Goldfields Ltd; ASX Announcement, January 30, 2026 82 Lefroy Exploration Limited; Corporate Presentation, November 28, 2025 83 Ramelius Resources Limited; ASX Announcement, October 1, 2025 84 Northern Star Resources Limited; ASX Announcement, May 15, 2025 85 Genesis Minerals Limited; Annual Report, August 21, 2025 86 Matsa Resources Ltd.; Annual Report, October 26, 2025 for Red October and AngloGold Ashanti Limited; Mineral Resource and Mineral Reserve Report at December 31, 2024 for Butcher Well 87 Kaiser Reef Limited; ASX Announcement, October 23, 2025 88 Minerals 260 Limited; Corporate Presentation, February 2026 89 Ramelius Resources Limited; ASX Announcement, October 1, 2025 90 Ramelius Resources Limited; ASX Announcement, October 1, 2025 91 Benz Mining Corp; Annual Report, August 29, 2025 92 Newmont Corporation; News Release, February 19, 2026 93 Kinross Gold Corporation; News Release, February 18, 2026 94 Endeavour Mining plc; News Release, March 5, 2026 95 Endeavour Mining Corp.; Annual Report, March 17, 2022 96 Perseus Mining Limited; News Release, August 21, 2025 97 Ariana Resources plc; Replacement Prospectus, August 5, 2025 98 Fortuna Mining Corp.; News Release, January 20, 2026 99 Eldorado Gold Corporation; News Release, November 26, 2025 100 Alamos Gold Inc.; News Release, February 18, 2025 101 Perseus Mining Limited; News Release, August 21, 2025 102 Strickland Metals Limited; ASX Announcement, February 2, 2026 103 Lundin Mining Corporation; News Release, February 18, 2026 104 Glencore plc; Resources & Reserves as at December 31, 2025 105 Teck Resources Limited; Annual Information Form, February 18, 2026 106 The stream agreement applies to 100% of the property, but only with respect to the ownership interest of Teck Resources Limited which indirectly owns a 22.5% interest in Compañía Minera Antamina S.A. 107 Rio2 Limited; Corporate Presentation, December 8, 2025 108 Newmont Corporation; News Release, February 19, 2026 109 Newmont Corporation; News Release, February 19, 2026 110 Gold Fields Limited; Mineral Resources and Mineral Reserves Supplement to the Integrated Annual Report, March 31, 2025 111 Pan American Silver Corp; News Release, September 11, 2025 & Corporate Website 112 SolGold plc; Annual Information Form, September 24, 2025 113 Patagonia Gold Corp.; MD&A, November 27, 2025 114 Hecla Mining Company; News Release, February 13, 2026 115 Perpetua Resources Corp., Form 10-K, April 2, 2025 116 Skeena Resources Limited; Eskay Creek Project NI 43-101 Technical Report, November 14, 2023 117 Eldorado Gold Corporation; News Release, November 26, 2025 118 Integra Resources Corp.; Corporate Presentation, February, 2026 119 Westhaven Gold Corp.; Updated Preliminary Economic Assessment and Mineral Resource Estimate of the Shovelnose Gold Project, April 17, 2025 120 Paramount Gold Nevada Corp.; Form 10-K; September 25, 2025 121 i-80 Gold Corp.; Corporate Presentation, March 2026 122 i-80 Gold Corp.; Corporate Presentation, March 2026 123 i-80 Gold Corp.; Corporate Presentation, March 2026 124 AngloGold Ashanti plc; Q4 2025 & Full Year Earnings Release, February 20, 2026 125 Faraday Copper Corp.; Corporate Presentation, February 2026 126 Los Andes Copper Ltd.; Corporate Presentation, February 2026 127 Strickland Metals Limited; ASX Announcement, February 2, 2026 128 Sibanye Stillwater Limited; JSE Market Release, February 17, 2026 129 Sibanye Stillwater Limited; JSE Market Release, February 17, 2026 130 Western Limb includes the precious metals stream on Sibanye Stillwater Limited’s Western Limb mining operations and the net smelter return royalty on the Pandora property 131 Magna Mining Inc.; Corporate Presentation, March 2026 132 Ring of Fire Metals Pty Ltd.; Technical Report on the Eagle’s Nest Project, January 24, 2024 133 Generation Mining Limited; Marathon Copper-Palladium Project Feasibility Study Report Update, March 28, 2025 134 Newmont Corporation; News Release, February 19, 2026 135 Newmont Corporation; News Release, February 19, 2026 136 Faraday Copper Corp.; Corporate Presentation, February 2026 137 Vale S.A.; Form 20-F, March 28, 2025. Details of Vale’s Participating Debentures are available on Vale’s website 138 SolGold plc; Annual Information Form, September 24, 2025 (Alpala & Tandayama America Underground) & News Release (Tandayama America Open Pit), November 26, 2025 139 Teck Resources Limited; Annual Information Form, February 18, 2026 140 First Quantum Minerals Ltd.; Taca Taca Project NI 43-101 Technical Report, February 19, 2026 141 Lundin Mining Corporation; News Release, February 18, 2026 142 Los Andes Copper Ltd.; Corporate Presentation, February 2026 143 Hudbay Minerals Inc.; Investor Presentation, February 2026 144 KGHM Polska Miedź S.A.; Mineral Resources and Reserves Report, December 31, 2014 145 Strickland Metals Limited; ASX Announcement, February 2, 2026 146 Glencore plc; Resources & Reserves as at December 31, 2014 147 Ring of Fire Metals Pty Ltd.; Technical Report on the Eagle’s Nest Project, January 24, 2024 148 Canada Nickel Company, Inc.; Crawford Nickel Sulfide Project NI 43-101 Technical Report, October 1, 2023 149 BHP Group Limited; Annual Report, August 19, 2025 150 Noront Resources Ltd.; Black Thor, Black Label and Big Daddy NI 43-101 Technical Report, July 27, 2015 & Eagle’s Nest Project NI 43-101 Technical Report, October 19, 2012 for Blackbird 151 Vale S.A.; Form 20-F, March 28, 2025. Details of Vale’s Participating Debentures are available on Vale’s website 152 Labrador Iron Ore Royalty Corporation; Annual Information Form, March 11, 2026 153 Franco-Nevada holds a 9.9% equity interest in Labrador Iron Ore Royalty Corporation (“LIORC”). LIORC, directly and through its wholly-owned subsidiary, owns a 15.1% equity interest in Iron Ore Company of Canada and receives a 7% gross overriding royalty on the operation and also receives a C$0.10/t commission on sales of iron ore Franco-Nevada Corporation ★ 133 TSX / NYSE: FNV Mineral Resources and Mineral Reserves
N E W P R O S P E R I T Y E X C L U S I O N Mineral Resources - Inclusive of Mineral Reserves Grade Contained Metal Category Tonnes 000s Au g/t Au 000 oz Measured 547,000 0.46 8,100 Indicated 463,000 0.34 5,100 M&I 1,010,000 0.41 13,300 Inferred — — — Mineral Reserves Grade Contained Metal Category Tonnes 000s Au g/t Au 000 oz Proven 481,000 0.46 7,100 Probable 350,000 0.35 3,900 Total 831,000 0.41 11,000 • Source: Taseko Mines Limited’s Corporate Presentation dated January 2026 • The source data above for the New Prosperity Project Mineral Resource and Mineral Reserve estimate and related technical report entitled “Technical Report on the 344 Million Tonne Increase in Mineral Reserves at the Prosperity Gold-Copper Project, British Columbia, Canada” has an effective date of November 2, 2009. Franco-Nevada is not treating the New Prosperity Mineral Resource and Mineral Reserve estimate as current and caution is advised when assessing the reliability of such estimate. Readers are further cautioned that the source data has not been updated since 2009 and, accordingly, caution is advised when assessing its conclusions in light of current operating and capital costs, appropriate technologies, metals price outlooks and like matters • Mineral Resources and Mineral Reserves as defined in accordance with NI 43-101 under guidelines set out in the CIM Standards on Mineral Resources and Mineral Reserves adopted by the CIM Council • Mineral Resources are reported inclusive of Mineral Reserves • Rows and columns may not total precisely due to rounding C O B R E P A N A M Á E X C L U S I O N Mineral Resources - Inclusive of Mineral Reserves Grade Contained Metal Category Tonnes 000s Au g/t Ag g/t Au 000 oz Ag 000 oz Measured 100,900 0.15 1.65 487 5,353 Indicated 3,212,000 0.06 1.33 6,224 136,987 M&I 3,312,900 0.06 1.34 6,710 142,339 Inferred 1,084,500 0.04 1.09 1,286 37,825 Mineral Reserves Grade Contained Metal Category Tonnes 000s Au g/t Ag g/t Au 000 oz Ag 000 oz Proven 98,400 0.15 1.61 475 5,093 Probable 2,669,300 0.06 1.35 5,125 116,062 Total 2,767,700 0.06 1.36 5,600 121,243 • Source: First Quantum Minerals Ltd.’s Annual Information Form dated February 10, 2026 • Cobre Panamá has been on P&SM with production halted since November 2023. Please refer to the “Cobre Panamá Updates – Panamá” section on page 42 of this Asset Handbook and the “Technical and Third-Party Information” section on page 144 of this Asset Handbook. Due to the status of Cobre Panamá, Mineral Resources and Mineral Reserves are being reported separately and are not included in the comprehensive Mineral Resources and Mineral Reserves tables above • Mineral Resources and Mineral Reserves as defined in accordance with NI 43-101 under guidelines set out in the CIM Standards on Mineral Resources and Mineral Reserves adopted by the CIM Council • Mineral Resources are reported inclusive of Mineral Reserves • Stockpiles have been added into the Mineral Resources and Mineral Reserves • Rows and columns may not total precisely due to rounding TSX / NYSE: FNV 134 ★ Franco-Nevada Corporation Mineral Resources and Mineral Reserves
A d d i t i o nal Infor mation Hoyle Pond, Timmins, Ontario | Image Courtesy of the ROM (Royal Ontario Museum), Toronto, Canada. ©ROM
A S S E T C O U N T S Franco-Nevada’s assets are categorized by commodity and stage of development. By commodity, assets are characterized as “Precious Metals” or “Diversified” . Precious Metals includes gold, silver and PGM assets. Diversified includes iron ore, other mining and energy assets (which encompass oil, gas and natural gas liquids). “Producing” assets are those that have generated revenue from steady-state operations for Franco-Nevada or are expected to in the next year. “Advanced” assets are interests on projects which are not yet producing but where, in management’s view, the technical feasibility and commercial viability of extracting Mineral Resources are demonstrable. “Exploration” assets represent interests on projects where technical feasibility and commercial viability of extracting Mineral Resources are not demonstrable. Management uses the following criteria in its assessment of technical feasibility and commercial viability: 1. Geology: there is a known mineral deposit which contains Mineral Resources or Mineral Reserves; or the project is adjacent to a mineral deposit that is already being mined or developed and there is sufficient geologic certainty of converting the deposit into Mineral Resources or Mineral Reserves. 2. Accessibility and authorization: there are no significant unresolved issues impacting the accessibility and authorization to develop or mine the mineral deposit, and social, environmental and governmental permits and approvals to develop or mine the mineral deposit appear obtainable. For accounting purposes, the number of assets has been counted in different manners depending on the category. Royalties on a producing or advanced property are generally counted as a single asset even if Franco-Nevada has multiple different royalties on the property, such as at the Goldstrike complex. Streams covering a group of mines in close proximity and operated by a common operator, such as the Sudbury streams, have also been counted as one asset. However, royalties and streams on producing properties that have significant co-products have been counted twice, such as the Robinson royalties for gold and copper or the Sudbury streams for gold and PGM. Exploration royalties are simply counted by the number of royalty contracts and no effort has been made to consolidate royalties on the same property. Franco-Nevada’s energy interests are subdivided into Producing Assets, which are assets that are currently producing oil or natural gas, or Exploration Assets, which are undeveloped assets that are not producing oil or natural gas. Franco-Nevada’s energy interests consist of a variety of royalty interests and working interests which are derived from a large number of underlying leases, contractual agreements and mineral title covering land positions primarily in western Canada and Oklahoma, North Dakota, Pennsylvania, Louisiana and Texas in the United States. For accounting purposes, these leases, contracts and mineral title have been grouped into distinct land areas and tabulated as individual assets. In many cases, Franco-Nevada owns multiple royalties or working interests that pertain to the same land area, and in these circumstances, the interests are counted as a single asset. As of May 1, 2026, Franco-Nevada estimates that it holds 255 Precious Metals assets and 190 Diversified assets (107 Other Mining assets and 83 Energy assets) for a total of 445 assets. Franco-Nevada Asset Counts at May 1, 2026 Diversified Precious Metals Other Mining Energy Assets Total Producing 53 13 55 121 Advanced 37 9 – 46 Exploration 165 85 28 278 Total 255 107 83 445 TSX / NYSE: FNV 136 ★ Franco-Nevada Corporation Additional Information Additional Information
Franco-Nevada Acreage Tabulation (1) Producing Advanced Exploration Total acres km 2 acres km 2 acres km 2 acres km² Precious Metals South America 820,307 3,320 249,822 1,011 337,931 1,368 1,408,060 5,699 Central America & Mexico 30,157 122 32,111 130 675 3 62,943 255 Canada 613,355 2,482 206,996 838 894,969 3,622 1,715,320 6,942 United States 90,852 368 123,732 501 210,047 850 424,631 1,719 Australia 1,439,221 5,824 274,336 1,110 728,023 2,946 2,441,580 9,880 Rest of World 1,668,412 6,752 216,209 875 61,215 248 1,945,836 7,875 Total Precious Metals 4,662,304 18,868 1,103,206 4,465 2,232,860 9,037 7,998,370 32,370 Diversified Iron Ore & Other Mining South America 731,714 2,961 111,350 451 3,106,238 12,571 3,949,302 15,983 Central America & Mexico 6,605 27 59,552 241 – – 66,157 268 Canada 44,973 182 142,365 576 341,011 1,380 528,349 2,138 United States 29,234 118 25,140 102 18,585 75 72,959 295 Australia Australia 29,757 120 58,440 236 1,086,754 4,398 1,174,951 4,754 Rest of World – – – – 265,842 1,076 265,842 1,076 Total 842,283 3,408 396,847 1,606 4,818,430 19,500 6,057,560 24,514 Diversified Energy (2) United States 2,772,581 11,220 – – 53,994 219 2,826,575 11,439 Canada 608,723 2,463 – – 308,912 1,250 917,635 3,713 Total 3,381,304 13,683 – – 362,906 1,469 3,744,210 15,152 Total Diversified 4,223,587 17,091 396,847 1,606 5,181,336 20,969 9,801,770 39,666 Total Estimated Acreage South America 1,552,021 6,281 361,172 1,462 3,444,169 13,939 5,357,362 21,682 Central America & Mexico 36,762 149 91,663 371 675 3 129,100 523 Canada 1,267,051 5,127 349,361 1,414 1,544,892 6,252 3,161,304 12,793 United States 2,892,667 11,706 148,872 603 282,626 1,144 3,324,165 13,453 Australia 1,468,978 5,944 332,776 1,346 1,814,777 7,344 3,616,531 14,634 Rest of World 1,668,412 6,752 216,209 875 327,057 1,324 2,211,678 8,951 Total 8,885,891 35,959 1,500,053 6,071 7,414,196 30,006 17,800,140 72,036 A C R E A G E O F A S S E T S The following is a tabulation of the acreage of Precious Metals and Diversified lands subject to Franco-Nevada’s royalty, stream or other interests as at May 1, 2026. Acreage amounts are approximate or estimated and are compiled from available information contained in asset agreements and updated when possible using various sources including government recording offices, operator information such as technical reports, presentations and other sources. Acreage has been converted into standard measure by Franco-Nevada. (1) Represents management’s best available information as at May 1, 2026. Legal status of tenure and rate(s) of royalty, stream and other interests vary by agreement. Cobre Panamá, currently on preservation and safe management, is included in the above calculations and accounts for 32,111 acres (129.95 km 2 ) (2) Gross Acreage Franco-Nevada Corporation ★ 137 TSX / NYSE: FNV Additional Information
B O A R D O F D I R E C T O R S Tom Albanese Tom Albanese is Chair Designate and is currently a director of Franco-Nevada. The Board of Franco-Nevada intends to appoint Tom Albanese as the independent Chair of its Board of Directors following Franco-Nevada's annual meeting on May 12, 2026. Mr. Albanese served as CEO of Vedanta Resources plc (2014 to 2017), CEO of Vedanta Limited (2014 to 2017) and was CEO of Rio Tinto plc and Rio Tinto Limited (2007 to 2013). Mr. Albanese is also a director of CoTec Holdings Corp. He previously served on the boards of Nevada Copper Corp., Vedanta Resources plc, Vedanta Limited, Rio Tinto plc, Rio Tinto Limited, Ivanhoe Mines Limited, Palabora Mining Company and Turquoise Hill Resources Limited. Mr. Albanese holds a Master's of Science degree in Mining Engineering and a Bachelor of Science degree in Mineral Economics both from the University of Alaska Fairbanks. Paul Brink Paul Brink is President & Chief Executive Officer and a director of Franco-Nevada. Prior to his appointment as CEO, Mr. Brink served as President & Chief Operating Officer of Franco-Nevada from May 2018 to May 2020. He has been with Franco-Nevada since its initial public offering in 2007 and successfully led its business development activities as SVP, Business Development from 2008 until his promotion to President & Chief Operating Officer in 2018. Mr. Brink is active with a number of not-for-profit organizations. He previously had roles in corporate development at Newmont, investment banking at BMO Nesbitt Burns and project financing at UBS. Mr. Brink holds a Bachelor’s degree in Mechanical Engineering from the University of Witwatersrand and a Master’s degree in Management Studies from Oxford University. Hugo Dryland Hugo Dryland is a director of Franco-Nevada. Mr. Dryland is also a Global Partner of Rothschild & Co, Chairman of the group’s Global Advisory Metals & Mining Sector and Non-Executive Chairman of the group’s Global Advisory business in Canada. Mr. Dryland joined Rothschild & Co in 1986 and has extensive experience in the mining, minerals, oil and gas, energy, utilities and infrastructure sectors, working on transactions spanning the globe. Throughout his career, Mr. Dryland has been actively involved in the leadership, oversight and execution of M&A mandates, financing advisory transactions and strategic advisory work undertaken in the mining and metals sectors. Mr. Dryland previously served on the boards of RCF Acquisition Corp. (2023), Antofagasta plc (2011 to 2016) and Antofagasta Minerals SA (2011 to 2016). Mr. Dryland holds Masters’ degrees in Business Administration and in Comparative Law from the University of Warwick and George Washington University, respectively. Derek Evans Derek Evans is a director of Franco-Nevada. Mr. Evans served as President & CEO of MEG Energy Corp. from August 2018 until May 2024 and as President and CEO and a director of Pengrowth Energy Corporation from May 2009 until March 2018. He also serves as director and Chair of AltaGas Ltd. Previously, Mr Evans served as Executive Chairman of the Pathways Alliance from May 2024 to February 2026. Mr. Evans has over 40 years of experience in a variety of operational and senior executive positions in the oil and gas business in Western Canada. Mr. Evans is also active in not-for-profit organizations and was a board member of MaRS (an innovation hub) from 2011 until 2023. Mr. Evans holds a Bachelor of Science degree in Mining Engineering from Queen’s University and is a registered Professional Engineer in Alberta. Mr. Evans is also a member of the Institute of Corporate Directors. TSX / NYSE: FNV 138 ★ Franco-Nevada Corporation Additional Information
Dr. Catharine Farrow Catharine Farrow is a director of Franco-Nevada, a Professional Geoscientist (PGO) and accredited Corporate Director (ICD.D) with over 30 years of experience in the mining industry. She is also an Independent Director of ALS Limited, and Aclara Resources Inc. (Lead Director). Dr. Farrow is on the Board of Governors of Laurentian University and is active in the mining and technology industries in both private companies and academia. From 2012 to 2017 she was Founding CEO, Director and Co-Founder of TMAC Resources Inc. Before TMAC, Dr. Farrow was COO of KGHM International (formerly Quadra FNX Mining Ltd.). Before FNX, Dr. Farrow was with both Inco Ltd. and the Ontario Geological Survey. She is a past Director of Eldorado Gold Corporation (2020 to 2025), and Centamin PLC (2019 to 2024). Catharine has been awarded an Honourary Doctor of Science from Acadia University (2025), and an Honourary Doctor of Business Administration from Laurentian University (2024). She has been honoured as one of the 100 Global Inspirational Women in Mining (2015 and 2018). She has also obtained Professional Certificates in Cybersecurity Leadership (2024) and AI Strategy (2025) from Cornell University. Catharine obtained her BSc (Hons) from Mount Allison University, her MSc from Acadia University and her PhD from Carleton University. Maureen Jensen Maureen Jensen is a director of Franco-Nevada. Ms. Jensen also serves as a director of the Bank of Canada. Previously, she served as Chair and Chief Executive Officer of the Ontario Securities Commission (the “OSC”) from 2016 until April 2020 and was the Executive Director and Chief Administrative Officer of the OSC from 2011 to 2016. Before joining the OSC, Ms. Jensen was Senior Vice President, Surveillance and Compliance at the Investment Industry Regulatory Organization of Canada. Ms. Jensen has held senior regulatory and business positions at the Toronto Stock Exchange and had a 20-year career in the mining industry. Ms. Jensen is Chair of Canada’s Ombudsman for Banking Services and Investments and is a Public Governor of FINRA in the United States. In 2022, Ms. Jensen was inducted into the Canadian Mining Hall of Fame. Ms. Jensen is a licensed professional geoscientist (P.Geo.) with Professional Geoscientists Ontario (PGO), holds the ICD.D and GCB.D designations, has a BSc, Doctor of Laws (Honoris Causa) and is a member of the Investment Industry Hall of Fame. Jennifer Maki Jennifer Maki is a director of Franco-Nevada. She is also a director of Baytex Energy Corp. and Pan American Silver Corp. She previously served as Chief Executive Officer of Vale Canada and Executive Director of Vale Base Metals (2014 to 2017) and previously held several other positions with Vale Base Metals, including Chief Financial Officer & Executive Vice-President and Vice-President & Treasurer. She has also served on the boards of not-for-profit organizations. Ms. Maki has a Bachelor of Commerce degree from Queen’s University and a postgraduate diploma from the Institute of Chartered Accountants, both in Ontario, Canada. She is also a Fellow Chartered Professional Accountant (FCPA) and a Fellow Chartered Accountant (FCA) and holds the ICD.D designation and the CERT Certificate in Cybersecurity Oversight. Daniel Malchuk Daniel Malchuk is a director of Franco-Nevada. Mr. Malchuk brings over 30 years of strategic, operational and financial experience in the natural resource industry to the Board. He currently serves as a director of SSR Mining Inc. and a Senior Advisor with Appian Capital Advisory LLP . Previously, Mr. Malchuk served as Chairman of Jetti Resources LLC and held various leadership positions with BHP Group Limited until his retirement in 2020 including President of Operations, Minerals Americas, President of Copper, President of Aluminum, Manganese, and Nickel, President, Minerals Exploration and Vice President, Strategy and Development. He is also a member of the Senior Advisory Board at the Pre-Columbian Art Museum in Santiago. Mr. Malchuk holds a Civil Industrial Engineer degree from Universidad de Chile and an MBA from University of California at Los Angeles (UCLA) Anderson School of Management. Jacques Perron Jacques Perron is a director of Franco-Nevada. Mr. Perron has over 40 years of experience in the mining industry and has extensive technical and operations experience. He currently serves as a director of Torex Gold Resources Inc., and as director and Chair of Arizona Metals Corp. Previously, Mr. Perron was a director of Centerra Gold Inc., President and Chief Executive Officer at a number of mining companies including Pretium Resources Inc., Thompson Creek Metals Company Inc. and St Andrew Goldfields Ltd. and prior thereto held senior executive roles at a number of other mining companies. Mr. Perron is also the Chair of the Canadian Mineral Industry Education Foundation. Mr. Perron has a Bachelor of Science degree in Mining Engineering from l’École Polytechnique de Montréal. Franco-Nevada Corporation ★ 139 TSX / NYSE: FNV Additional Information
E X E C U T I V E S Paul Brink, President & CEO Paul Brink is President & Chief Executive Officer and a director of Franco-Nevada. Prior to his appointment as CEO, Mr. Brink served as President & Chief Operating Officer of Franco-Nevada from May 2018 to May 2020. He has been with Franco-Nevada since its initial public offering in 2007 and successfully led its business development activities as SVP, Business Development from 2008 until his promotion to President & Chief Operating Officer in 2018. Mr. Brink is active with a number of not-for-profit organizations. He previously had roles in corporate development at Newmont, investment banking at BMO Nesbitt Burns and project financing at UBS. Mr. Brink holds a Bachelor’s degree in Mechanical Engineering from the University of Witwatersrand and a Master’s degree in Management Studies from Oxford University. Sandip Rana, Chief Financial Officer Sandip Rana, Chief Financial Officer, joined Franco-Nevada in April 2010. He previously served in treasurer and controller roles at old Franco-Nevada until 2002 and then acted as an international controller for Newmont. From 2003 to April 2010, Mr. Rana held financial roles at Four Seasons Hotels Limited where he last served as Vice-President Corporate Finance. Mr. Rana holds a Bachelor of Business Administration degree from the Schulich School of Business and is a Chartered Professional Accountant, CA. In February 2019, Mr. Rana was recognized as a Top Gun CFO by Brendan Wood International. Lloyd Hong, Chief Legal Officer & Corporate Secretary Lloyd Hong, Chief Legal Officer & Corporate Secretary, joined Franco-Nevada in December 2012. He previously was the Senior Vice-President, Legal Counsel and Assistant Secretary of Uranium One Inc. Prior to that, he was a partner with the Canadian law firm of Davis LLP (now DLA Piper (Canada) LLP) with a practice focused on corporate finance and mergers and acquisitions. Mr. Hong holds a Bachelor of Commerce degree from the University of Alberta and a Bachelor of Laws degree from Queen’s University. Mr. Hong is a member of The Law Society of Ontario and The Law Society of British Columbia (non-practising). Eaun Gray, Chief Investment Officer Eaun Gray, Chief Investment Officer, heads Franco-Nevada’s business development group. Mr. Gray was previously a Vice President at Rothschild & Co where he advised on mergers and acquisitions and debt and stream transactions. Prior to that, Mr. Gray worked for CIBC in investment and corporate banking. Mr. Gray completed a Master of Business Administration degree at the Tuck School at Dartmouth College (Edward Tuck Scholar), is a CFA Charterholder and received a Bachelor of Commerce from Queen’s University (First Class Honours). TSX / NYSE: FNV 140 ★ Franco-Nevada Corporation Additional Information
C O R P O R A T E O R G A N I Z A T I O N Franco-Nevada Corporation (Canada) FN Holdings ULC (Alberta) Franco-Nevada GLW Holdings Corp. (British Columbia) Franco-Nevada International Corporation (Barbados) Franco-Nevada Australia Pty Ltd (Australia) Franco-Nevada U.S. Corporation (Delaware) Franco-Nevada Delaware LLC (Delaware) 100% 100% 100% 100% 100% 100% The chart below depicts certain subsidiaries of Franco-Nevada including those subsidiaries in jurisdictions in which Franco-Nevada maintains an office that are wholly-owned by Franco-Nevada either directly or indirectly and are existing under the laws of the jurisdictions set out therein. As of December 31, 2025, Franco-Nevada International Corporation (formerly Franco-Nevada (Barbados) Corporation) is Franco-Nevada’s only subsidiary with assets and revenue greater than 10% of the consolidated assets and revenue of the Company. Intermediate holding companies have been omitted. Franco-Nevada Corporation ★ 141 TSX / NYSE: FNV Additional Information
N O N - G A A P F I N A N C I A L M E A S U R E S Adjusted EBITDA and Adjusted EBITDA per Share Adjusted EBITDA and Adjusted EBITDA per share are non-GAAP financial measures, which is defined by Franco-Nevada by excluding the following from net income (loss) and earnings (loss) per share (“EPS”): • Income tax expense/recovery; • Finance expenses; • Finance income; • Depletion and depreciation; • Impairment losses and reversals related to royalty, stream and working interests; • Gains/losses on disposal of royalty, stream and working interests; • Impairment losses and expected credit losses related to investments, loans receivable and other financial instruments; • Changes in fair value of investments, loans receivable and other financial instruments; and • Foreign exchange gains/losses and other income/expenses. Management uses Adjusted EBITDA and Adjusted EBITDA per share to evaluate the underlying operating performance of Franco-Nevada as a whole for the reporting periods presented, to assist with the planning and forecasting of future operating results, and to supplement information in its financial statements. Management believes that in addition to measures prepared in accordance with IFRS Accounting Standards such as net income and EPS, our investors and analysts use Adjusted EBITDA and Adjusted EBITDA per share to evaluate the results of the underlying business of Franco-Nevada and its ability to generate liquidity by producing operating cash flow to fund working capital needs, service debt obligations and fund acquisitions. While the adjustments to net income and EPS in these measures include items that are both recurring and non-recurring, management believes that Adjusted EBITDA and Adjusted EBITDA per share are useful measures of Franco-Nevada’s performance because they adjust for items which may not relate to or have a disproportionate effect on the period in which they are recognized, impact the comparability of our core operating results from period to period, are not always reflective of the underlying operating performance of our business and/or are not necessarily indicative of future operating results. Adjusted EBITDA and Adjusted EBITDA per share are only intended to provide additional information to investors and analysts and should not be considered in isolation or as a substitute for measures of performance prepared in accordance with IFRS Accounting Standards. They do not have any standardized meaning under IFRS Accounting Standards and may not be comparable to similar measures presented by other issuers. Adjusted EBITDA Margin Adjusted EBITDA Margin is a non-GAAP ratio which is defined by Franco-Nevada as Adjusted EBITDA divided by revenue. Franco-Nevada uses Adjusted EBITDA Margin in its annual incentive compensation process to evaluate management’s performance in increasing revenue and containing costs. Management believes that in addition to measures prepared in accordance with IFRS Accounting Standards, our investors and analysts use Adjusted EBITDA Margin to evaluate the Company’s ability to contain costs relative to revenue. Adjusted EBITDA Margin is intended to provide additional information to investors and analysts and should not be considered in isolation or as a substitute for measures of performance prepared in accordance with IFRS Accounting Standards. It does not have any standardized meaning under IFRS Accounting Standards and may not be comparable to similar measures presented by other issuers. Reconciliation of Net Income to Adjusted EBITDA: (expressed in millions, except per share amounts) For the year ended December 31, 2025 2024 Net (loss) income $ 1,112.1 $ 552.1 Income tax expense 303.9 211.8 Finance expenses 3.1 2.6 Finance income (28.2) (60.6) Depletion and depreciation 306.7 225.3 Impairment losses (4.8) – Gain on sale of royalty interest – (0.3) Foreign exchange gain and other income (36.7) 20.7 Adjusted EBITDA $ 1,656.1 $ 951.6 Basic weighted average shares outstanding 192.7 192.4 Basic (loss) earnings per share $ 5.77 $ 2.87 Income tax expense 1.58 1.10 Finance expenses 0.02 0.01 Finance income (0.16) (0.31) Depletion and depreciation 1.59 1.17 Impairment losses (0.02) – Gain on sale of royalty interest – – Foreign exchange gain and other (income) expenses (0.19) 0.11 Adjusted EBITDA per share $ 8.59 $ 4.95 Calculation of Adjusted EBITDA Margin: (expressed in millions, except Adjusted EBITDA Margin) For the year ended December 31, 2025 2024 Adjusted EBITDA $ 1,656.1 $ 951.6 Revenue 1,822.8 1,113.6 Adjusted EBITDA Margin 90.9 % 85.5 % TSX / NYSE: FNV 142 ★ Franco-Nevada Corporation Additional Information
Adjusted Net Income and Adjusted Net Income per Share Adjusted Net Income and Adjusted Net Income per share are non-GAAP financial measures, which is defined by Franco-Nevada by excluding the following from net income and EPS: • Foreign exchange gains/losses and other income/expenses; • Impairment losses and reversals related to royalty, stream and working interests; • Gains/losses on disposal of royalty, stream and working interests; • Impairment losses and expected credit losses related to investments, loans receivable and other financial instruments; • Changes in fair value of investments, loans receivable and other financial instruments; • Impact of income taxes on these items; • Income taxes related to the reassessment of the probability of realization of previously recognized or de-recognized deferred income tax assets; and • Income taxes relating to the revaluation of deferred income tax assets and liabilities as a result of statutory income tax rate changes in the countries in which the Company operates. Management uses Adjusted Net Income and Adjusted Net Income per share to evaluate the underlying operating performance of Franco-Nevada as a whole for the reporting periods presented, to assist with the planning and forecasting of future operating results, and to supplement information in its financial statements. Management believes that, in addition to measures prepared in accordance with IFRS Accounting Standards such as net income and EPS, our investors and analysts use Adjusted Net Income and Adjusted Net Income per share to evaluate the results of the underlying business of Franco-Nevada, particularly since the items that are adjusted for are typically not included in our guidance. While the adjustments to net income and EPS in these measures include items that are both recurring and non-recurring, management believes that Adjusted Net Income and Adjusted Net Income per share are useful measures of Franco-Nevada’s performance because they adjust for items which may not relate to or have a disproportionate effect on the period in which they are recognized, impact the comparability of our core operating results from period to period, are not always reflective of the underlying operating performance of our business and/or are not necessarily indicative of future operating results. Adjusted Net Income and Adjusted Net Income per share are intended to provide additional information to investors and analysts and should not be considered in isolation or as a substitute for measures of performance prepared in accordance with IFRS Accounting Standards. They do not have any standardized meaning under IFRS Accounting Standards and may not be comparable to similar measures presented by other issuers. Adjusted Net Income Margin Adjusted Net Income Margin is a non-GAAP ratio which is defined by Franco-Nevada as Adjusted Net Income divided by revenue. Franco-Nevada uses Adjusted Net Income Margin in its annual incentive compensation process to evaluate management’s performance in increasing revenue and containing costs. Management believes that in addition to measures prepared in accordance with IFRS Accounting Standards, our investors and analysts use Adjusted Net Income Margin to evaluate the Company’s ability to contain costs relative to revenue. Adjusted Net Income Margin is intended to provide additional information to investors and analysts and should not be considered in isolation or as a substitute for measures of performance prepared in accordance with IFRS Accounting Standards. It does not have any standardized meaning under IFRS Accounting Standards and may not be comparable to similar measures presented by other issuers. Reconciliation of Net Income to Adjusted Net Income: (expressed in millions, except per share amounts) For the year ended December 31, 2025 2024 Net income (loss) $ 1,112.1 $ 552.1 Impairment losses (4.8) – Gain on disposal of royalty interests – (0.3) Foreign exchange loss (gain) and other (income) expenses (36.7) 20.7 Tax effect of adjustments 4.6 (2.4) Other tax related adjustments Deferred tax expense related to the remeasurement of deferred tax liability due to changes in Barbados tax rate – 49.1 Change in unrecognized deferred income tax assets – (1.1) Adjusted Net Income $ 1,075.2 $ 618.1 Basic weighted average shares outstanding 192.7 192.4 Basic earnings (loss) per share $ 5.77 $ 2.87 Impairment losses (0.02) – Gain on disposal of royalty interests – – Foreign exchange loss (gain) and other expenses (income) (0.19) 0.11 Tax effect of adjustments 0.02 (0.01) Other tax related adjustments Deferred tax expense related to the remeasurement of deferred tax liability due to changes in Barbados tax rate – 0.26 Change in unrecognized deferred income tax assets – (0.02) Adjusted Net Income per share $ 5.58 $ 3.56 Franco-Nevada Corporation ★ 143 TSX / NYSE: FNV Additional Information
T E C H N I C A L A N D T H I R D - P A R T Y I N F O R M A T I O N Except where otherwise stated, the disclosure in this Asset Handbook relating to properties and operations on the properties in which Franco-Nevada holds royalty, stream or other interests is based on information publicly disclosed by the owners or operators of these properties and information/data available in the public domain as at March 12, 2026, and none of this information has been independently verified by Franco-Nevada. Specifically, as a royalty or stream holder, Franco-Nevada has limited, if any, access to properties included in its asset portfolio. Additionally, Franco-Nevada may from time to time receive operating information from the owners and operators of the properties, which it is not permitted to disclose to the public. Franco-Nevada is dependent on the operators of the properties and their qualified persons to provide information to Franco-Nevada or on publicly available information to prepare disclosure pertaining to properties and operations on the properties on which Franco-Nevada holds royalty, stream or other interests and generally has limited or no ability to independently verify such information. Although Franco-Nevada does not have any knowledge that such information may not be accurate, there can be no assurance that such third-party information is complete or accurate. Some information publicly reported by operators may relate to a larger property than the area covered by Franco-Nevada’s royalty, stream or other interest. Franco-Nevada’s royalty, stream or other interests often cover less than 100% and sometimes only a portion of the publicly reported mineral resources, mineral reserves and production of a property. Except where otherwise noted, the disclosure in this Asset Handbook relating to mineral resources and mineral reserves statements for individual properties is made as at December 31, 2025. Reconciliation to CIM Definitions In this Asset Handbook, Franco-Nevada has disclosed a number of Mineral Resource and Mineral Reserve estimates covering properties related to mining assets that are not based on Canadian Institute of Mining, Metallurgy and Petroleum definitions (“CIM”), but have instead been prepared in reliance upon other comparable international reporting codes, including JORC (Australia), SAMREC (South Africa) and Regulation S-K 1300 (collectively, the “Acceptable Foreign Codes”). Similar to the CIM, reporting standards adopted by these Acceptable Foreign Codes are all compliant with the international Mineral Resource and Mineral Reserve Guidelines defined by the Committee for Mineral Reserves International Reporting Standards (“CRIRSCO”). In each case, the Mineral Resources and Mineral Reserves reported in this Asset Handbook are based on estimates previously disclosed by the relevant property owner or operator, without reference to the underlying data used to calculate the estimates. Accordingly, Franco-Nevada is unable to reconcile the Mineral Resource and Mineral Reserve estimates prepared in reliance with the Acceptable Foreign Codes with that of CIM. Franco-Nevada sought confirmation from one of its technical advisory firms, that is comprised of engineers experienced in the preparation of Mineral Resource and Mineral Reserve estimates using CIM and each of the Acceptable Foreign Codes, of the extent to which an estimate prepared under an Acceptable Foreign Code would differ from that prepared under CIM. Franco-Nevada was advised that CIM are largely comparable to those of the Acceptable Foreign Codes and that the Mineral Resource and Mineral Reserve definitions and categories are similar to CIM as adopted in NI 43-101 and will typically result in reporting of substantially similar Mineral Resource and Mineral Reserve estimates. Such advisors further confirmed, without reference to the procedures in which the estimates prepared using Acceptable Foreign Codes that are reproduced in this Asset Handbook were conducted, that in the course of their preparation of a Mineral Resource or Mineral Reserve estimate they would effectively apply similar procedures to prepare and report the Mineral Resource or Mineral Reserve estimate regardless of the reliance on CIM or any of the Acceptable Foreign Codes. Mineral Resource and Mineral Reserve Estimates This Asset Handbook has been prepared in accordance with the requirements of Canadian securities laws in effect in Canada, which differ from the requirements of U.S. securities laws. Unless otherwise indicated, all mineral resource and mineral reserve estimates included in this Asset Handbook have been prepared by the owners or operators of the relevant properties (as and to the extent indicated by them) in accordance with National Instrument 43-101 — Standards of Disclosure for Mineral Projects (“NI 43-101”) and the Canadian Institute of Mining, Metallurgy and Petroleum Definition Standards (“CIM Definition Standards”). NI 43-101 is a rule developed by the Canadian securities regulatory authorities which establishes standards for all public disclosure an issuer makes of scientific and technical information concerning mineral projects. NI 43-101 permits a historical estimate made prior to the adoption of NI 43-101 that does not comply with NI 43-101 to be disclosed using the historical terminology if, among other things, the disclosure: (a) identifies the source and date of the historical estimate; (b) comments on the relevance and reliability of the historical estimate; (c) states whether the historical estimate uses categories other than those prescribed by NI 43-101; and (d) includes any more recent estimates or data available. Mining disclosure under U.S. securities law was previously required to comply with SEC Industry Guide 7 (“SEC Industry Guide 7”) under the United States Securities Exchange Act of 1934, as amended. The SEC has adopted rules to replace SEC Industry Guide 7 with new mining disclosure rules under sub-parts 1300 and 1301 of Regulation S-K of the United States Securities Act of 1933 (“Regulation S-K 1300”) which became mandatory for U.S. reporting companies beginning with the first fiscal year commencing on or after January 1, 2021. Under Regulation S-K 1300, the SEC now recognizes estimates of “Measured Mineral Resources”, “Indicated Mineral Resources” and “Inferred Mineral Resources”. In addition, the SEC has amended its definitions of “Proven Mineral Reserves” and “Probable Mineral Reserves” to be substantially similar to international standards. Readers are cautioned that despite efforts to harmonize U.S. mining disclosure rules with NI 43-101 and other international requirements, there are differences between the terms and definitions used in Regulation S-K 1300 and mining terms defined in the Canadian Institute of Mining, Metallurgy and Petroleum Standards, which definitions have been adopted by NI 43 - 101, and there is no assurance that any mineral resources or mineral reserves that an owner or operator may report as “measured mineral resources”, “indicated mineral resources”, “inferred mineral resources”, “proven mineral reserves” and “probable mineral reserves” under NI 43-101 would be the same had the owner or operator prepared the mineral resource or mineral reserve estimates under the standards of Regulation S-K 1300. In addition to NI 43-101 and S-K 1300, a number of mineral resource and mineral reserve estimates have been prepared in accordance with the JORC Code or the SAMREC Code each of which constitutes an “acceptable foreign code” for purposes of NI 43-101, which differ from the requirements of NI 43-101 and U.S. securities laws. Accordingly, information containing descriptions of the Corporation’s mineral properties set forth herein may not be comparable to similar information made public by U.S. companies subject to the reporting and disclosure requirements under U.S. federal securities laws and the rules and regulations thereunder. For more information, see “Reconciliation to CIM Definitions”. Darrol van Deventer, P . Eng., Vice President, Mining of Franco-Nevada is the qualified person that approved the scientific or technical information contained in this Asset Handbook related to mineral projects that are material (for purposes of NI 43-101) to Franco-Nevada. TSX / NYSE: FNV 144 ★ Franco-Nevada Corporation Additional Information
F O R W A R D - L O O K I N G I N F O R M A T I O N This Asset Handbook contains “forward-looking information” and “forward-looking statements” within the meaning of applicable Canadian securities laws and the United States Private Securities Litigation Reform Act of 1995, respectively, which may include, but are not limited to, statements with respect to future events or future performance, management’s expectations regarding Franco-Nevada’s growth, results of operations, estimated future revenues, performance guidance, carrying value of assets, future dividends and requirements for additional capital, Mineral Resource and Mineral Reserve estimates, production estimates, production costs and revenue, future demand for and prices of commodities, expected mining sequences, business prospects and opportunities, the performance and plans of third party operators, any ongoing or future audits being conducted by the Canada Revenue Agency (the “CRA”), the expected exposure for current and future tax assessments and available remedies, and statements with respect to the future status and any potential restart of the Cobre Panamá mine and related arbitration proceedings. In addition, statements relating to Mineral Resources and Mineral Reserves, gold equivalent ounces or mine lives are forward-looking statements, as they involve implied assessment, based on certain estimates and assumptions, and no assurance can be given that the estimates and assumptions are accurate and that such Mineral Resources and Mineral Reserves, GEOs or mine lives will be realized. Such forward-looking statements reflect management’s current beliefs and are based on information currently available to management. Often, but not always, forward-looking statements can be identified by the use of words such as “plans”, “expects”, “is expected”, “budgets”, “potential for”, “scheduled”, “estimates”, “forecasts”, “predicts”, “projects”, “intends”, “targets”, “aims”, “anticipates” or “believes” or variations (including negative variations) of such words and phrases or may be identified by statements to the effect that certain actions “may”, “could”, “should”, “would”, “might” or “will” be taken, occur or be achieved. Forward-looking statements involve known and unknown risks, uncertainties and other factors, which may cause the actual results, performance or achievements of Franco-Nevada to be materially different from any future results, performance or achievements expressed or implied by the forward-looking statements. A number of factors could cause actual events or results to differ materially from any forward-looking statement, including, without limitation: fluctuations in the prices of the primary commodities that drive royalty and stream revenue (gold, platinum group metals, copper, nickel, silver, iron ore and oil and gas); fluctuations in the value of the Canadian and Australian dollar, Brazilian Real, Mexican peso, and any other currency in which revenue is generated, relative to the U.S. dollar; changes in national and local government legislation, including permitting and licensing regimes and taxation policies and the enforcement thereof; proposed tariff and other trade measures that may be imposed by the United States and proposed retaliatory measures that may be adopted by its trading partners; the adoption and implementation of a global minimum tax on corporations; regulatory, political or economic developments in any of the countries where properties in which Franco-Nevada holds a royalty, stream or other interest are located or through which they are held; risks related to the operators of the properties in which Franco-Nevada holds a royalty, stream or other interest, including changes in the ownership and control of such operators; relinquishment or sale of mineral properties; influence of macroeconomic developments; business opportunities that become available to, or are pursued by Franco-Nevada; reduced access to debt and equity capital; litigation; title, permit or license disputes related to interests on any of the properties in which Franco-Nevada holds a royalty, stream or other interest; whether or not the Company is determined to have “passive foreign investment company” (“PFIC”) status as defined in Section 1297 of the United States Internal Revenue Code of 1986, as amended; potential changes in Canadian tax treatment of offshore streams; excessive cost escalation as well as development, permitting, infrastructure, operating or technical difficulties on any of the properties in which Franco-Nevada holds a royalty, stream or other interest; access to sufficient pipeline capacity; actual mineral content may differ from the Mineral Resources and Mineral Reserves contained in technical reports; rate and timing of production differences from Mineral Resource estimates, other technical reports and mine plans; risks and hazards associated with the business of development and mining on any of the properties in which Franco-Nevada holds a royalty, stream or other interest, including, but not limited to unusual or unexpected geological and metallurgical conditions, slope failures or cave-ins, sinkholes, flooding and other natural disasters, terrorism, civil unrest or an outbreak of contagious disease; the impact of future pandemics; and the integration of acquired assets. The forward-looking statements contained herein are based upon assumptions management believes to be reasonable, including, without limitation: the ongoing operation of the properties in which Franco-Nevada holds a royalty, stream or other interest by the owners or operators of such properties in a manner consistent with past practice; the accuracy of public statements and disclosures made by the owners or operators of such underlying properties; no material adverse change in the market price of the commodities that underlie the asset portfolio; the Company’s ongoing income and assets relating to determination of its PFIC status; no material changes to existing tax treatment; the expected application of tax laws and regulations by taxation authorities; the expected assessment and outcome of any audit by any taxation authority; no adverse development in respect of any significant property in which Franco-Nevada holds a royalty, stream or other interest; the accuracy of publicly disclosed expectations for the development of underlying properties that are not yet in production; integration of acquired assets; and the absence of any other factors that could cause actions, events or results to differ from those anticipated, estimated or intended. However, there can be no assurance that forward-looking statements will prove to be accurate, as actual results and future events could differ materially from those anticipated in such statements. Investors are cautioned that forward-looking statements are not guarantees of future performance. In addition, there can be no assurance as to (i) the outcome of any ongoing or future audit by the CRA or the Company’s exposure as a result thereof, or (ii) the future status and any potential restart of the Cobre Panamá mine or the outcome of any related arbitration proceedings. Franco-Nevada cannot assure investors that actual results will be consistent with these forward- looking statements. Accordingly, investors should not place undue reliance on forward-looking statements due to the inherent uncertainty therein. For additional information with respect to risks, uncertainties and assumptions, please refer to Franco-Nevada’s most recent Annual Information Form as well as our most recent Management’s Discussion and Analysis filed with the Canadian securities regulatory authorities on www.sedarplus.com and Franco-Nevada’s most recent Annual Report filed on Form 40-F filed with the SEC on www.sec.gov. The forward-looking statements herein are made as at March 12, 2026 (except where stated otherwise) and Franco-Nevada does not assume any obligation to update or revise them to reflect new information, estimates or opinions, future events or results or otherwise, except as required by applicable law. Franco-Nevada Corporation ★ 145 TSX / NYSE: FNV Additional Information
G L O S S A R Y “ A$ ” means Australian dollars. “ Adjusted EBITDA ” and “ Adjusted EBITDA per share ” are non-IFRS measures, which exclude the following from net income and earnings per share: income tax expense/recovery; finance expenses and finance income; depletion and depreciation; non-cash costs of sales; impairment charges related to royalty, stream and working interests and investments; gains/losses on the sale of royalty, stream and working interests and investments; foreign exchange gains/losses and other income/expenses; and unusual non-recurring items. For additional information and a reconciliation of these measures to various IFRS measures, refer to the Company’s MD&A. “ Adjusted Net Income ” and “ Adjusted Net Income per share ” are non-IFRS financial measures, which exclude the following from net income and earnings per share: impairment charges related to royalty, stream and working interests and investments; gains/losses on the sale of royalty, stream and working interests and investments; foreign exchange gains/losses and other income/expenses; unusual non-recurring items; and the impact of income taxes on these items. For additional information and a reconciliation of these measures to various IFRS measures, refer to the Company’s MD&A. “ Ag ” means the chemical symbol for the element silver. “ AMR ” means Advanced Minimum Royalty and is rent paid to the royalty holder prior to the payment of royalties on production. Once production begins, the AMR payments are then credited in full against stream of production royalty payments. “ AOI ” means area of interest. “ Au ” means the chemical symbol for the element gold. “ bbl ” means barrel. “ Bbls/d ” means barrels per day. “ Bcf ” means billion cubic feet. “ Boe ” means barrels of oil equivalent. “ Boe/d ” means barrels of oil equivalent per day. “ CAGR ” means Compounded Annual Growth Rate. “ CIM ” means the Canadian Institute of Mining, Metallurgy and Petroleum. “ CIM Definitions ” means CIM Definition Standards for Mineral Resources and Mineral Reserves and CIM Estimation of Mineral Resources and Mineral Reserves Best Practice Guidelines. “ concentrate ” is the product of physical concentration process, such as flotation or gravity concentration, which involves separating ore minerals from unwanted waste rock. Concentrates require subsequent processing (such as smelting or leaching) to break down or dissolve the ore minerals and obtain the desired elements, usually metals. “ Cu ” means the chemical symbol for the element copper. “ cut-off grade ” means the lowest grade of Mineral Resource considered economic; used in the calculation of Mineral Resources and Mineral Reserves in a given deposit. “ diamond drill ” is a type of drill in which the rock cutting is done by abrasion, with a diamond impregnated bit, rather than by percussion. The drill cuts a core of rock which is recovered in long cylindrical sections. “ Inf. ” means Inferred. “ Inferred Resources ” has the meaning ascribed to the term “ Inferred Mineral Resource ” pursuant to CIM Definitions. “ JORC ” means the Australasian Code for Reporting of Mineral Resources and Mineral Reserves prepared by the Joint Ore Reserves Committee of the Australasian Institute of Mining and Metallurgy, Australian Institute of Geoscientists and Mineral Council of Australia, as amended. “ kg ” represents kilogram. “ km ” represents kilometre. “ km 2 ” represents square kilometre. “ koz ” means thousand ounces. “ kozpa ” means thousand ounces per annum. “ kt ” means thousand tonnes. “ ktpd ” means thousand tonnes per day. “ lb ” represents pound. “ LOM ” means life of mine. “ m ” means metres. “ M&I ” means Measured and Indicated. “ Mbbls/mbbls ” means thousand barrels. “ Mboe/mboe ” means thousand barrels of oil equivalent. “ Mcf/mcf ” means thousand cubic feet. “ Measured Resources ” has the meaning ascribed to the term “Measured Mineral Resource” pursuant to CIM Definitions. “ mineralization ” usually implies minerals of value occurring in rocks. “ Mineral Royalties ” means the royalty interests in precious and base metal properties and certain equity interests owned by Franco-Nevada. “ Mlbs ” means millions of pounds. “ MMbbl ” means million barrels of oil. “ MMcf/mmcf ” means million cubic feet. “ MMcf/d or mmcf/d ” means million cubic feet per day. “ Mo ” means the chemical symbol for the element molybdenum. “ Moz ” means million ounces. “ Mtpa ” means million tonnes per annum. Mtpd ” means million tonnes per day. “ NGLs ” means Natural Gas Liquids. “ NI 43-101 ” means National Instrument 43-101 – Standards of Disclosure for Mineral Projects of the Canadian Securities Administrators. “ Ni ” means the chemical symbol for the element nickel. “ NPI ” means Net Profit Interest: the profits after deduction of expenses. “ NPR ” means Net Proceeds Royalties: which is a royalty on the profits after deduction of expenses. “ NRI ” means Net Royalty Interest: paid net of operating and capital costs (similar to an NPI). “ NSR ” means Net Smelter Return: Which is the proceeds returned from the smelter and/or refinery to the mine owner less certain costs. Syn: “ core drill ”. “ dip ” is the angle between a horizontal plane and an inclined surface such as a rock formation, fault or vein. “ drift ” is a horizontal passage underground that follows along the length of a vein of rock formation. “ EIS ” means environmental impact statement. “ eq ” or “ Eq ” means equivalent. “ fault ” means a fracture in a rock where there has been displacement of the two sides. “ Fe ” means the chemical symbol for the element iron. “ feasibility study ” means a comprehensive study of a mineral deposit in which all geological, engineering, legal, operation, economic, social, environmental and other relevant factors are considered in sufficient detail that it could reasonably serve as a basis by a financial institution to finance the development of a deposit for mineral production. “ FH ” means Freehold or Lessor Royalty. “ flotation ” is a process by which mineral particles are induced to become attached to bubbles and float, in an ore and water slurry, so that the valuable minerals are concentrated at the slurry surface and separated from the worthless gangue. “ fracture ” means breaks in a rock, usually due to intensive folding or faulting. “ Franco-Nevada ” means Franco-Nevada Corporation and is also referred to as “ Franco ”, “ FNV ”, “ the Company ”, “ Corporation ”, “ management ”, “ we ”, or “ our ” in this Asset Handbook. “ Freehold ” means an interest in real property. “ g ” represents grams. “ g/t ” means grams per tonne. “ GR ” means Gross Royalty and is a royalty based on all revenues in cash or in-kind products received by the operator for the sale of product. “ grade ” means the concentration of each ore metal in a rock sample, usually given as weight percent. Where extremely low concentrations are involved, the concentration may be given in grams per tonne (g/t) or oz per ton (oz/t). “ GMR ” means Gross Margin Royalty, which is a royalty on the revenues after deduction of cash operating costs. Non-deductible costs generally include: capital costs (both development and sustaining), exploration, depreciation and other non-cash production costs. “ Guide 7 ” means the mining industry guide entitled “Description of Property by Issuers Engaged or to be Engaged in Significant Mining Operations” contained in the Securities Act Industry Guides published by the United States Securities and Exchange Commission, as amended. “ ha ” means hectares; 10,000 square metres. “ heap leaching process ” is the process of extracting gold and silver by placing broken ore on an impermeable pad and applying a diluted cyanide solution that dissolves a portion of the contained gold and silver, which are then recovered in metallurgical processes. “ Indicated Resources ” has the meaning ascribed to the term “Indicated Mineral Resource” pursuant to CIM Definitions. TSX / NYSE: FNV 146 ★ Franco-Nevada Corporation Additional Information
“ Oil and Gas Interests ” means the royalty interests, working interests and oil and natural as mineral rights in oil and natural gas properties owned by Franco- Nevada. “ open pit ” is a surface working open to daylight, such as a quarry. “ ore ” means a natural aggregate of one or more minerals which may be mined and sold at a profit, or from which some part may be profitably separated. “ ORR ” means Overriding Royalty: A percentage share of production, which is free of all costs of drilling and producing, and is created by the lessee or working interest owner and paid by the lessee or working interest owner. “ oz ” represents ounce (troy). 1 troy ounce = 1.097 avoirdupois ounce. “ oz/ton ” represents troy ounces per short ton. “ P&P ” means Proven and Probable. “ Pb ” means the chemical symbol for the element lead. “ Pd ” means the chemical symbol for the element palladium. “ PGM ” means the platinum group of metals, including but not limited to Palladium, Platinum, Rhodium, Osmium, and Rhenium. “ porphyry ” is an igneous rock of any composition that contains conspicuous, large mineral grains (phenocrysts) in a fine-grained matrix. “ ppm ” means parts per million. “ preliminary feasibility study” or “PFS” means a comprehensive study of the viability of a mineral project that has advanced to a stage where the mining method, in the case of underground mining, or the pit configuration, in the case of an open pit, has been established and an effective method of mineral processing has been determined, and includes a financial analysis based on reasonable assumptions of technical, engineering, legal, operating, economic, social, and environmental factors and the evaluation of other relevant factors which are sufficient for a qualified person, acting reasonably, to determine if all or part of the mineral resource may be classified as a mineral reserve. “ Probable Reserve ” in respect of Mineral Reserves has the meaning ascribed to the term “ Probable Mineral Reserve ” pursuant to CIM Definitions. “ Proven Reserve ” in respect of Mineral Reserves has the meaning ascribed to the term “ Proven Mineral Reserve ” pursuant to CIM Definitions. “ Pt ” means the chemical symbol for the element platinum. “ Qualified Person ” for the purposes of NI 43-101, is an individual who is an engineer or geoscientist with at least five years of experience in mineral exploration, mine development or operation or mineral project assessment, or any combination of these; and has experience relevant to the subject matter of the mineral project; and who is a member in good standing of a recognized self-regulatory organization of engineers or geoscientists. “ WI ” means Working Interest. Holders of working interests have an ownership position in the property and operation and hence are liable for cash calls on their share of capital, operating and environmental costs usually in proportion to their ownership percentage. Working interests are not considered to be royalties because of their ongoing funding requirements although, for profitable operations, they can be economically similar in their calculations to NPIs. “ Zn ” means the chemical symbol for the element zinc. “ Reserves ” means collectively, in respect of Mineral Reserves, Probable Reserves and Proven Reserves. “ Resources ” means a concentration or occurrence of diamonds, natural solid inorganic material, or natural solid fossilized organic material including base and precious metals, coal, and industrial minerals in or on the earth’s crust in such form and quantity and of such a grade or quality that it has reasonable prospects for economic extraction. “ Revenue-based Royalties ” are based on the value of the production or net proceeds received by the operator with defined deductions as specified by the royalty contract. Some forms of revenue-based royalties in the mining and energy industries are: “NSR” Net Smelter Return Royalty; “ORR” Overriding Royalty; “GR” Gross Royalty; and “FH” Freehold or Lessor Royalty. “ run-of-mine ore ” means mined ore which has not been subjected to any pre-treatment, such as washing, sorting or crushing prior to metallurgical processing. “ SAMREC ” means the South African Code for Reporting of Mineral Resources and Mineral Reserves prepared by the South African Mineral Committee under the auspices of the South African Institute of Mining and Metallurgy, as amended. “ smelting ” is an intermediate stage metallurgical process in which metal is separated from impurities by using thermal or chemical separation techniques. “ stope ” means an excavation in an underground mine from which ore is being or has been extracted. “ Streams ” are metal purchase agreements that allow the holder of the agreement to purchase all or a portion of the gold, silver or other products from a mine in exchange for an upfront payment and an additional payment on each delivery. Streams are not royalties because they are not an interest in land and there is an ongoing cash payment required to purchase the physical metal. “ strike ” means the trend or direction of the intersection of a dipping a layer of rock, fault, vein or other geologic feature with a horizontal surface. “ tailings ” means material rejected after recoverable valuable minerals have been extracted from the ore or concentrate. “ ton ” is 2,000 pounds. Syn: short ton. “ tonne ” means 1,000 kilograms. “ tpa ” means tonnes per annum. “ tpd ” means tonnes per day. “ vein ” means an epigenetic mineral filling of a fault or other fracture, in tabular or sheet-like form, often with associated replacement of the host rock; a mineral deposit of this form and origin. “ waste ” is rock which is not ore and usually has to be removed during the normal course of mining to get at the ore. Franco-Nevada Corporation ★ 147 TSX / NYSE: FNV Additional Information
C O R P O R A T E I N F O R M A T I O N Executive Management Paul Brink President & CEO Sandip Rana Chief Financial Officer Lloyd Hong Chief Legal Officer & Corporate Secretary Eaun Gray Chief Investment Officer Directors David Harquail¹ Chair of the Board Tom Albanese² Chair Designate Paul Brink President & CEO Hugo Dryland Derek Evans Dr. Catharine Farrow Maureen Jensen Jennifer Maki Daniel Malchuk Jacques Perron Chair Emeritus Pierre Lassonde Listings of Common Shares Toronto Stock Exchange: FNV New York Stock Exchange: FNV Share Capital As at March 31, 2026 Common shares outstanding: 192,855,530 Reserved for options and other: 632,470 Fully diluted: 193,488,000 Auditors PricewaterhouseCoopers LLP Toronto, Canada Transfer Agent Computershare Investor Services Inc. 320 Bay Street, 14th Floor Toronto, Ontario M5H 4A6 Canada Toll Free: (800) 564-6253 Tel: (514) 982-7555 service@computershare.com Investor Information info@franco-nevada.com www.franco-nevada.com Tel: (416) 306-6300 Toll Free: (877) 401-3833 Head Office Franco-Nevada Corporation 199 Bay Street, Suite 2000 P .O. Box 285 Commerce Court Postal Station Toronto, Ontario M5L 1G9 Canada Tel: (416) 306-6300 Barbados Office Franco-Nevada International Corporation Ground Floor, Balmoral Hall, Balmoral Gap, Hastings, Christ Church Barbados, BB14034 Tel: (246) 434-8200 U.S. Office Franco-Nevada U.S. Corporation 1745 Shea Center Drive, Suite 400 Highlands Ranch, Colorado 80129 United States Tel: (720) 344-4986 Australia Office Franco-Nevada Australia Pty Ltd 44 Kings Park Road, Suite 41 West Perth, Western Australia 6005 Australia Tel: 61-8-6263-4425 1 Mr. Harquail is not standing for re-election to the Board. The Board of Franco-Nevada intends to appoint Mr. Harquail as Chair Emertius following Franco-Nevada's annual meeting on May 12, 2026. 2 The Board of Franco-Nevada intends to appoint Mr. Albanese as the independent Chair of its Board of Directors following Franco-Nevada's annual meeting on May 12, 2026. TSX / NYSE: FNV 148 ★ Franco-Nevada Corporation Additional Information
F R A N C O - N E V A D A . C O M T S X / N Y S E : F N V