
32 (expressed in millions, except per share amounts) For the three months ended December 31, For the year ended December 31, 2022 2021 2022 2021 Adjusted Net Income $ 164.9 163.7 $ 697.6 673.6 Revenue 320.4 327.7 1,315.7 1,300.0 Adjusted Net Income Margin 51.5% 50.0% 53.0% 51.8% APPENDIX – GEOS AND NON-GAAP MEASURES 1. Starting in Q4 2021, revenue from Franco-Nevada’s Energy assets is included in the calculation of GEOs. GEOs for comparative periods have been recalculated to conform with the current presentation. GEOs include Franco- Nevada’s attributable share of production from our Mining and Energy assets, after applicable recovery and payability factors. GEOs are estimated on a gross basis for NSR royalties and, in the case of stream ounces, before the payment of the per ounce contractual price paid by the Company. For NPI royalties, GEOs are calculated taking into account the NPI economics. Silver, platinum, palladium, iron ore, oil, gas and other commodities are converted to GEOs by dividing associated revenue, which includes settlement adjustments, by the relevant gold price. The price used in the computation of GEOs earned from a particular asset varies depending on the royalty or stream agreement, which may make reference to the market price realized by the operator, or the average price for the month, quarter, or year in which the commodity was produced or sold. 2. Non-GAAP financial measures: Cash Costs, Cash Costs per GEO sold, Adjusted Net Income, Adjusted Net Income per Share, Adjusted Net Income Margin, Adjusted EBITDA, Adjusted EBITDA per share, and Adjusted EBITDA Margin are non-GAAP financial measures with no standardized meaning under IFRS and might not be comparable to similar financial measures disclosed by other issuers. For a quantitative reconciliation of each non-GAAP financial measure to the most directly comparable IFRS financial measure, refer to the following tables. Further information relating to these Non-GAAP financial measures is incorporated by reference from the “Non-GAAP Financial Measures” section of Franco-Nevada’s MD&A for the three and nine months ended December 31, 2022 and filed on March 15, 2023 with the Canadian securities regulatory authorities on SEDAR available at www.sedar.com and with the U.S. Securities and Exchange Commission available on EDGAR at www.sec.gov. Starting in Q4 2021, revenue from Franco-Nevada’s Energy assets are included in the calculation of GEOs. Similarly, the composition of Cash Costs and Cash Costs per GEO sold has been amended to include costs and GEOs related to Franco-Nevada’s Energy assets. Cash Costs and Cash Costs per GEO sold for comparative periods have been recalculated to conform with current presentation.
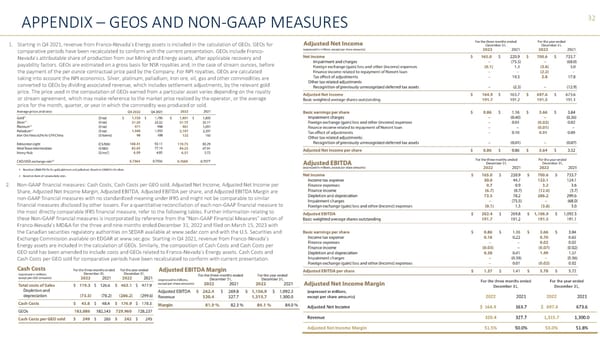 Franco-Nevada Corporate Presentation Page 31 Page 33