
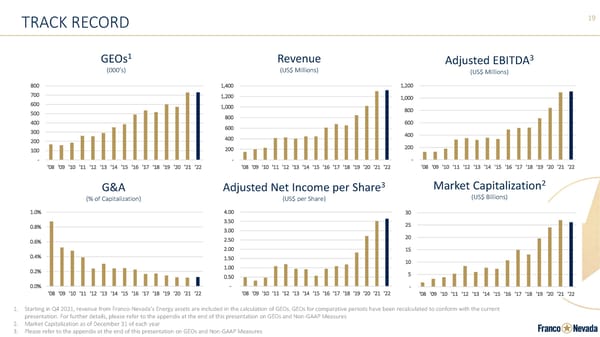
19 TRACK RECORD GEOs1 (000’s) Revenue (US$ Millions) G&A (% of Capitalization) Adjusted EBITDA3 (US$ Millions) Adjusted Net Income per Share3 (US$ per Share) 1. Starting in Q4 2021, revenue from Franco-Nevada’s Energy assets are included in the calculation of GEOs. GEOs for comparative periods have been recalculated to conform with the current presentation. For further details, please refer to the appendix at the end of this presentation on GEOs and Non-GAAP Measures 2. Market Capitalization as of December 31 of each year 3. Please refer to the appendix at the end of this presentation on GEOs and Non-GAAP Measures - 100 200 300 400 500 600 700 800 '08 '09 '10 '11 '12 '13 '14 '15 '16 '17 '18 '19 '20 '21 '22 - 200 400 600 800 1,000 1,200 1,400 '08 '09 '10 '11 '12 '13 '14 '15 '16 '17 '18 '19 '20 '21 '22 0.0% 0.2% 0.4% 0.6% 0.8% 1.0% '08 '09 '10 '11 '12 '13 '14 '15 '16 '17 '18 '19 '20 '21 '22 - 0.50 1.00 1.50 2.00 2.50 3.00 3.50 4.00 '08 '09 '10 '11 '12 '13 '14 '15 '16 '17 '18 '19 '20 '21 '22 - 200 400 600 800 1,000 1,200 '08 '09 '10 '11 '12 '13 '14 '15 '16 '17 '18 '19 '20 '21 '22 Market Capitalization2 (US$ Billions) - 5 10 15 20 25 30 '08 '09 '10 '11 '12 '13 '14 '15 '16 '17 '18 '19 '20 '21 '22
 Franco-Nevada Corporate Presentation Page 18 Page 20