
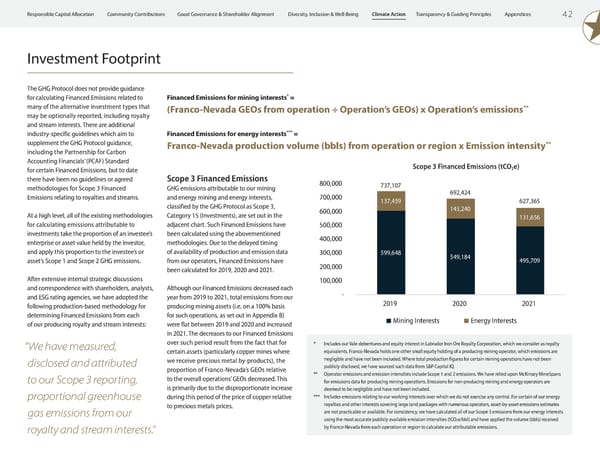
4 2 Appendices Transparency & Guiding Principles Climate Action Diversity, Inclusion & Well-Being Good Governance & Shareholder Alignment Community Contributions Responsible Capital Allocation 0.8 0.7 0.6 1.5 1.5 5.6 2.3 2.2 6.2 - 1.0 2.0 3.0 4.0 5.0 6.0 7.0 2020 2021 2022 Water Waste 44.1 33.4 78.3 - 10.0 20.0 30.0 40.0 50.0 60.0 70.0 80.0 90.0 2020 2021 2022 1.2 1.2 1.7 2.5 9.4 12.3 0.4 0.4 0.1 4.1 11.0 14.1 - 2.0 4.0 6.0 8.0 10.0 12.0 14.0 16.0 2020 2021 2022 Other Purchased Good & Services Electronics Paper Use 599,648 549,184 495,709 137,459 143,240 131,656 737,107 692,424 627,365 - 100,000 200,000 300,000 400,000 500,000 600,000 700,000 800,000 2019 2020 2021 Mining Interests Energy Interests The GHG Protocol does not provide guidance for calculating Financed Emissions related to many of the alternative investment types that may be optionally reported, including royalty and stream interests. There are additional industry-specific guidelines which aim to supplement the GHG Protocol guidance, including the Partnership for Carbon Accounting Financials’ (PCAF) Standard for certain Financed Emissions, but to date there have been no guidelines or agreed methodologies for Scope 3 Financed Emissions relating to royalties and streams. At a high level, all of the existing methodologies for calculating emissions attributable to investments take the proportion of an investee’s enterprise or asset value held by the investor, and apply this proportion to the investee’s or asset’s Scope 1 and Scope 2 GHG emissions. After extensive internal strategic discussions and correspondence with shareholders, analysts, and ESG rating agencies, we have adopted the following production-based methodology for determining Financed Emissions from each of our producing royalty and stream interests: Investment Footprint * Includes our Vale debentures and equity interest in Labrador Iron Ore Royalty Corporation, which we consider as royalty equivalents. Franco-Nevada holds one other small equity holding of a producing mining operator, which emissions are negligible and have not been included. Where total production figures for certain mining operations have not been publicly disclosed, we have sourced such data from S&P Capital IQ. ** Operator emissions and emission intensities include Scope 1 and 2 emissions. We have relied upon McKinsey MineSpans for emissions data for producing mining operations. Emissions for non-producing mining and energy operators are deemed to be negligible and have not been included. *** Includes emissions relating to our working interests over which we do not exercise any control. For certain of our energy royalties and other interests covering large land packages with numerous operators, asset-by-asset emissions estimates are not practicable or available. For consistency, we have calculated all of our Scope 3 emissions from our energy interests using the most accurate publicly available emission intensities (tCO 2 e/bbl) and have applied the volume (bbls) received by Franco-Nevada from each operation or region to calculate our attributable emissions. Financed Emissions for mining interests * = (Franco-Nevada GEOs from operation ÷ Operation’s GEOs) x Operation’s emissions ** Financed Emissions for energy interests *** = Franco-Nevada production volume (bbls) from operation or region x Emission intensity ** Scope 3 Financed Emissions GHG emissions attributable to our mining and energy mining and energy interests, classified by the GHG Protocol as Scope 3, Category 15 (Investments), are set out in the adjacent chart. Such Financed Emissions have been calculated using the abovementioned methodologies. Due to the delayed timing of availability of production and emission data from our operators, Financed Emissions have been calculated for 2019, 2020 and 2021. Although our Financed Emissions decreased each year from 2019 to 2021, total emissions from our producing mining assets (i.e. on a 100% basis for such operations, as set out in Appendix B ) were flat between 2019 and 2020 and increased in 2021. The decreases to our Financed Emissions over such period result from the fact that for certain assets (particularly copper mines where we receive precious metal by-products), the proportion of Franco-Nevada’s GEOs relative to the overall operations’ GEOs decreased. This is primarily due to the disproportionate increase during this period of the price of copper relative to precious metals prices. Scope 3 Financed Emissions (tCO 2 e) “We have measured, disclosed and attributed to our Scope 3 reporting, proportional greenhouse gas emissions from our royalty and stream interests.”
 ESG Report 2023 Page 43 Page 45