
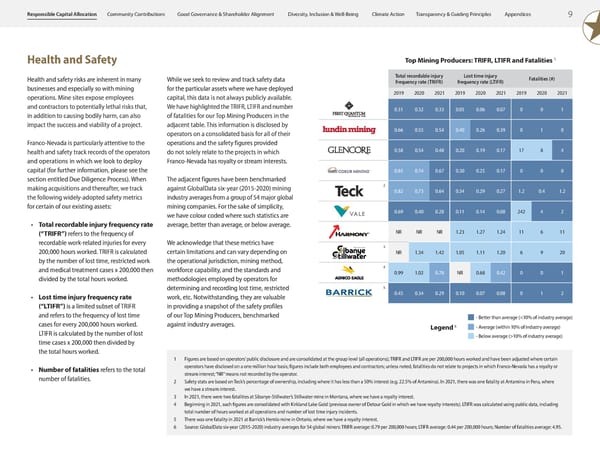
9 Appendices Transparency & Guiding Principles Climate Action Diversity, Inclusion & Well-Being Good Governance & Shareholder Alignment Community Contributions Responsible Capital Allocation Health and Safety Health and safety risks are inherent in many businesses and especially so with mining operations. Mine sites expose employees and contractors to potentially lethal risks that, in addition to causing bodily harm, can also impact the success and viability of a project. Franco-Nevada is particularly attentive to the health and safety track records of the operators and operations in which we look to deploy capital (for further information, please see the section entitled Due Diligence Process). When making acquisitions and thereafter, we track the following widely-adopted safety metrics for certain of our existing assets: • Total recordable injury frequency rate (“TRIFR”) refers to the frequency of recordable work-related injuries for every 200,000 hours worked. TRIFR is calculated by the number of lost time, restricted work and medical treatment cases x 200,000 then divided by the total hours worked. • Lost time injury frequency rate (“LTIFR”) is a limited subset of TRIFR and refers to the frequency of lost time cases for every 200,000 hours worked. LTIFR is calculated by the number of lost time cases x 200,000 then divided by the total hours worked. • Number of fatalities refers to the total number of fatalities. While we seek to review and track safety data for the particular assets where we have deployed capital, this data is not always publicly available. We have highlighted the TRIFR, LTIFR and number of fatalities for our Top Mining Producers in the adjacent table. This information is disclosed by operators on a consolidated basis for all of their operations and the safety figures provided do not solely relate to the projects in which Franco-Nevada has royalty or stream interests. The adjacent figures have been benchmarked against GlobalData six-year (2015-2020) mining industry averages from a group of 54 major global mining companies. For the sake of simplicity, we have colour coded where such statistics are average, better than average, or below average. We acknowledge that these metrics have certain limitations and can vary depending on the operational jurisdiction, mining method, workforce capability, and the standards and methodologies employed by operators for determining and recording lost time, restricted work, etc. Notwithstanding, they are valuable in providing a snapshot of the safety profiles of our Top Mining Producers, benchmarked against industry averages. 1 Figures are based on operators’ public disclosure and are consolidated at the group level (all operations); TRIFR and LTIFR are per 200,000 hours worked and have been adjusted where certain operators have disclosed on a one million hour basis; figures include both employees and contractors; unless noted, fatalities do not relate to projects in which Franco-Nevada has a royalty or stream interest; “NR” means not recorded by the operator. 2 Safety stats are based on Teck’s percentage of ownership, including where it has less than a 50% interest (e.g. 22.5% of Antamina). In 2021, there was one fatality at Antamina in Peru, where we have a stream interest. 3 In 2021, there were two fatalities at Sibanye-Stillwater’s Stillwater mine in Montana, where we have a royalty interest. 4 Beginning in 2021, such figures are consolidated with Kirkland Lake Gold (previous owner of Detour Gold in which we have royalty interests). LTIFR was calculated using public data, including total number of hours worked at all operations and number of lost time injury incidents. 5 There was one fatality in 2021 at Barrick’s Hemlo mine in Ontario, where we have a royalty interest. 6 Source: GlobalData six-year (2015-2020) industry averages for 54 global miners: TRIFR average: 0.79 per 200,000 hours; LTIFR average: 0.44 per 200,000 hours; Number of fatalities average: 4.95. Top Mining Producers: TRIFR, LTIFR and Fatalities 1 Total recordable injury frequency rate (TRIFR) Lost time injury frequency rate (LTIFR) Fatalities (#) 2019 2020 2021 2019 2020 2021 2019 2020 2021 0.31 0.32 0.33 0.05 0.06 0.07 0 0 1 0.66 0.55 0.54 0.40 0.26 0.39 0 1 0 0.58 0.54 0.48 0.20 0.19 0.17 17 8 4 0.85 0.74 0.67 0.30 0.25 0.17 0 0 0 2 0.82 0.73 0.64 0.34 0.29 0.27 1.2 0.4 1.2 0.69 0.40 0.28 0.11 0.14 0.08 242 4 2 NR NR NR 1.23 1.27 1.24 11 6 11 3 NR 1.34 1.42 1.05 1.11 1.20 6 9 20 4 0.99 1.02 0.78 NR 0.68 0.42 0 0 1 5 0.45 0.34 0.29 0.10 0.07 0.08 0 1 2 Legend 6 - Better than average (<10% of industry average) - Average (within 10% of industry average) - Below average (>10% of industry average)
 ESG Report 2023 Page 10 Page 12