
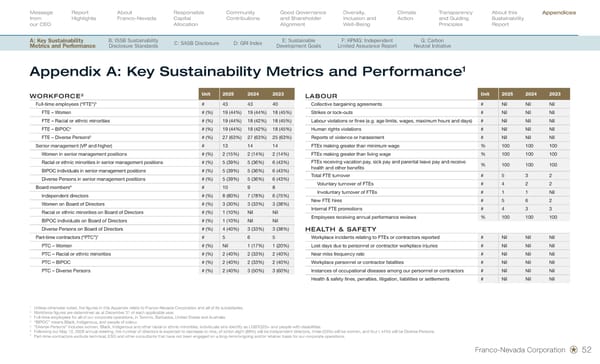
Appendix A: Key Sustainability Metrics and Performance 1 1 Unless otherwise noted, the figures in this Appendix relate to Franco-Nevada Corporation and all of its subsidiaries. 2 Workforce figures are determined as at December 31 of each applicable year. 3 Full-time employees for all of our corporate operations, in Toronto, Barbados, United States and Australia. 4 “BIPOC” means Black, Indigenous, and people of colour. 5 “Diverse Persons” includes women, Black, Indigenous and other racial or ethnic minorities, individuals who identify as LGBTQ2S+ and people with disabilities. 6 Following our May 12, 2026 annual meeting, the number of directors is expected to decrease to nine, of which eight (89%) will be independent directors, three (33%) will be women, and four ( 44%) will be Diverse Persons. 7 Part-time contractors exclude technical, ESG and other consultants that have not been engaged on a long-term/ongoing and/or retainer basis for our corporate operations. LABOUR Unit 2025 2024 2023 Collective bargaining agreements # Nil Nil Nil Strikes or lock-outs # Nil Nil Nil Labour violations or fines (e.g. age limits, wages, maximum hours and days) # Nil Nil Nil Human rights violations # Nil Nil Nil Reports of violence or harassment # Nil Nil Nil FTEs making greater than minimum wage % 100 100 100 FTEs making greater than living wage % 100 100 100 FTEs receiving vacation pay, sick pay and parental leave pay and receive health and other benefits % 100 100 100 Total FTE turnover # 5 3 2 Voluntary turnover of FTEs # 4 2 2 Involuntary turnover of FTEs # 1 1 Nil New FTE hires # 5 6 2 Internal FTE promotions # 4 3 3 Employees receiving annual performance reviews % 100 100 100 HEALTH & SAFETY Workplace incidents relating to FTEs or contractors reported # Nil Nil Nil Lost days due to personnel or contractor workplace injuries # Nil Nil Nil Near miss frequency rate # Nil Nil Nil Workplace personnel or contractor fatalities # Nil Nil Nil Instances of occupational diseases among our personnel or contractors # Nil Nil Nil Health & safety fines, penalties, litigation, liabilities or settlements # Nil Nil Nil WORKFORCE 2 Unit 2025 2024 2023 Full-time employees (“FTE”) 3 # 43 43 40 FTE – Women # (%) 19 (44%) 19 (44%) 18 (45%) FTE – Racial or ethnic minorities # (%) 19 (44%) 18 (42%) 18 (45%) FTE – BIPOC 4 # (%) 19 (44%) 18 (42%) 18 (45%) FTE – Diverse Persons 5 # (%) 27 (63%) 27 (63%) 25 (63%) Senior management (VP and higher) # 13 14 14 Women in senior management positions # (%) 2 (15%) 2 (14%) 2 (14%) Racial or ethnic minorities in senior management positions # (%) 5 (39%) 5 (36%) 6 (43%) BIPOC individuals in senior management positions # (%) 5 (39%) 5 (36%) 6 (43%) Diverse Persons in senior management positions # (%) 5 (39%) 5 (36%) 6 (43%) Board members 6 # 10 9 8 Independent directors # (%) 8 (80%) 7 (78%) 6 (75%) Women on Board of Directors # (%) 3 (30%) 3 (33%) 3 (38%) Racial or ethnic minorities on Board of Directors # (%) 1 (10%) Nil Nil BIPOC individuals on Board of Directors # (%) 1 (10%) Nil Nil Diverse Persons on Board of Directors # (%) 4 (40%) 3 (33%) 3 (38%) Part-time contractors (“PTC”) 7 # 5 6 5 PTC – Women # (%) Nil 1 (17%) 1 (20%) PTC – Racial or ethnic minorities # (%) 2 (40%) 2 (33%) 2 (40%) PTC – BIPOC # (%) 2 (40%) 2 (33%) 2 (40%) PTC – Diverse Persons # (%) 2 (40%) 3 (50%) 3 (60%) Franco-Nevada Corporation 52
 Sustainability Report 2026 Page 53 Page 55