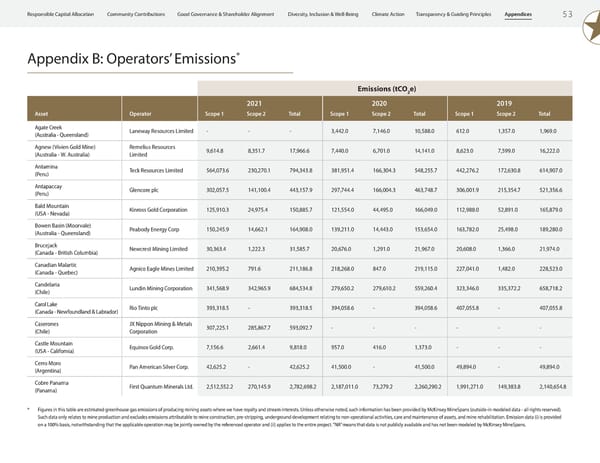
Responsible Capital Allocation Community Contributions Good Governance & Shareholder Alignment Diversity, Inclusion & Well-Being Climate Action Transparency & Guiding Principles Appendices 53 * Appendix B: Operators’ Emissions Emissions (tCO e) 2 2021 2020 2019 Asset Operator Scope 1 Scope 2 Total Scope 1 Scope 2 Total Scope 1 Scope 2 Total Agate Creek Laneway Resources Limited - - - 3,442.0 7,146.0 10,588.0 612.0 1,357.0 1,969.0 (Australia - Queensland) Agnew (Vivien Gold Mine) Remelius Resources 9,614.8 8,351.7 17,966.6 7,440.0 6,701.0 14,141.0 8,623.0 7,599.0 16,222.0 (Australia - W. Australia) Limited Antamina Teck Resources Limited 564,073.6 230,270.1 794,343.8 381,951.4 166,304.3 548,255.7 442,276.2 172,630.8 614,907.0 (Peru) Antapaccay Glencore plc 302,057.5 141,100.4 443,157.9 297,744.4 166,004.3 463,748.7 306,001.9 215,354.7 521,356.6 (Peru) Bald Mountain Kinross Gold Corporation 125,910.3 24,975.4 150,885.7 121,554.0 44,495.0 166,049.0 112,988.0 52,891.0 165,879.0 (USA - Nevada) Bowen Basin (Moorvale) Peabody Energy Corp 150,245.9 14,662.1 164,908.0 139,211.0 14,443.0 153,654.0 163,782.0 25,498.0 189,280.0 (Australia - Queensland) Brucejack Newcrest Mining Limited 30,363.4 1,222.3 31,585.7 20,676.0 1,291.0 21,967.0 20,608.0 1,366.0 21,974.0 (Canada - British Columbia) Canadian Malartic Agnico Eagle Mines Limited 210,395.2 791.6 211,186.8 218,268.0 847.0 219,115.0 227,041.0 1,482.0 228,523.0 (Canada - Quebec) Candelaria Lundin Mining Corporation 341,568.9 342,965.9 684,534.8 279,650.2 279,610.2 559,260.4 323,346.0 335,372.2 658,718.2 (Chile) Carol Lake Rio Tinto plc 393,318.5 - 393,318.5 394,058.6 - 394,058.6 407,055.8 - 407,055.8 (Canada - Newfoundland & Labrador) Caserones JX Nippon Mining & Metals 307,225.1 285,867.7 593,092.7 - - - - - - (Chile) Corporation Castle Mountain Equinox Gold Corp. 7,156.6 2,661.4 9,818.0 957.0 416.0 1,373.0 - - - (USA - California) Cerro Moro Pan American Silver Corp. 42,625.2 - 42,625.2 41,500.0 - 41,500.0 49,894.0 - 49,894.0 (Argentina) Cobre Panama First Quantum Minerals Ltd. 2,512,552.2 270,145.9 2,782,698.2 2,187,011.0 73,279.2 2,260,290.2 1,991,271.0 149,383.8 2,140,654.8 (Panama) * Figures in this table are estimated greenhouse gas emissions of producing mining assets where we have royalty and stream interests. Unless otherwise noted, such information has been provided by McKinsey MineSpans (outside-in modeled data - all rights reserved). Such data only relates to mine production and excludes emissions attributable to mine construction, pre-stripping, underground development relating to non-operational activities, care and maintenance of assets, and mine rehabilitation. Emission data (i) is provided on a 100% basis, notwithstanding that the applicable operation may be jointly owned by the referenced operator and (ii) applies to the entire project. “NA” means that data is not publicly available and has not been modeled by McKinsey MineSpans.
 2023 ESG Report | Franco-Nevada Page 54 Page 56