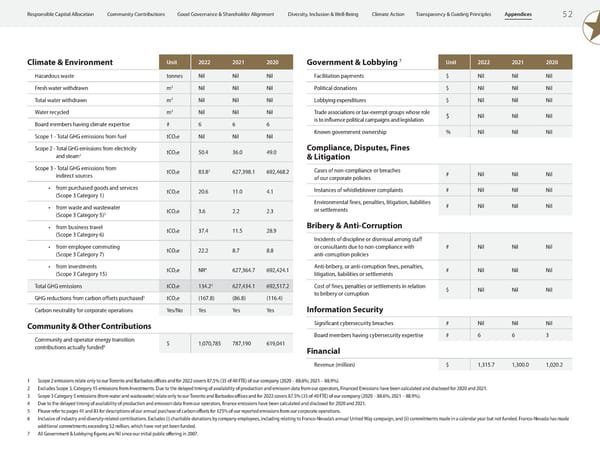
Responsible Capital Allocation Community Contributions Good Governance & Shareholder Alignment Diversity, Inclusion & Well-Being Climate Action Transparency & Guiding Principles Appendices 52 Climate & Environment Unit 2022 2021 2020 Government & Lobbying 7 Unit 2022 2021 2020 Hazardous waste tonnes Nil Nil Nil Facilitation payments $ Nil Nil Nil Fresh water withdrawn m3 Nil Nil Nil Political donations $ Nil Nil Nil Total water withdrawn m3 Nil Nil Nil Lobbying expenditures $ Nil Nil Nil Water recycled m3 Nil Nil Nil Trade associations or tax-exempt groups whose role is to influence political campaigns and legislation $ Nil Nil Nil Board members having climate expertise # 6 6 6 Scope 1 - Total GHG emissions from fuel tCO e Nil Nil Nil Known government ownership % Nil Nil Nil 2 Scope 2 - Total GHG emissions from electricity tCO e 50.4 36.0 49.0 Compliance, Disputes, Fines 1 2 and steam & Litigation Scope 3 - Total GHG emissions from 2 Cases of non-compliance or breaches tCO e 83.8 627,398.1 692,468.2 indirect sources 2 of our corporate policies # Nil Nil Nil • from purchased goods and services tCO e 20.6 11.0 4.1 Instances of whistleblower complaints # Nil Nil Nil (Scope 3 Category 1) 2 • from waste and wastewater Environmental fines, penalties, litigation, liabilities # Nil Nil Nil tCO e 3.6 2.2 2.3 or settlements (Scope 3 Category 5)3 2 • from business travel tCO e 37.4 11.5 28.9 Bribery & Anti-Corruption (Scope 3 Category 6) 2 Incidents of discipline or dismissal among staff • from employee commuting tCO e 22.2 8.7 8.8 or consultants due to non-compliance with # Nil Nil Nil (Scope 3 Category 7) 2 anti-corruption policies • from investments tCO e NR4 627,364.7 692,424.1 Anti-bribery, or anti-corruption fines, penalties, # Nil Nil Nil (Scope 3 Category 15) 2 litigation, liabilities or settlements Total GHG emissions tCO e 134.22 627,434.1 692,517.2 Cost of fines, penalties or settlements in relation 2 $ Nil Nil Nil GHG reductions from carbon offsets purchased5 tCO e (167.8) (86.8) (116.4) to bribery or corruption 2 Carbon neutrality for corporate operations Yes/No Yes Yes Yes Information Security Community & Other Contributions Significant cybersecurity breaches # Nil Nil Nil Community and operator energy transition Board members having cybersecurity expertise # 6 6 3 6 $ 1,070,785 787,190 619,041 contributions actually funded Financial Revenue (million) $ 1,315.7 1,300.0 1,020.2 1 Scope 2 emissions relate only to our Toronto and Barbados offices and for 2022 covers 87.5% (35 of 40 FTE) of our company (2020 – 88.6%; 2021 – 88.9%). 2 Excludes Scope 3, Category 15 emissions from Investments. Due to the delayed timing of availability of production and emission data from our operators, Financed Emissions have been calculated and disclosed for 2020 and 2021. 3 Scope 3 Category 5 emissions (from water and wastewater) relate only to our Toronto and Barbados offices and for 2022 covers 87.5% (35 of 40 FTE) of our company (2020 – 88.6%; 2021 – 88.9%). 4 Due to the delayed timing of availability of production and emission data from our operators, finance emissions have been calculated and disclosed for 2020 and 2021. 5 Please refer to pages 41 and 83 for descriptions of our annual purchase of carbon offsets for 125% of our reported emissions from our corporate operations. 6 Inclusive of industry and diversity-related contributions. Excludes (i) charitable donations by company employees, including relating to Franco-Nevada’s annual United Way campaign, and (ii) commitments made in a calendar year but not funded. Franco-Nevada has made additional commitments exceeding $2 million, which have not yet been funded. 7 All Government & Lobbying figures are Nil since our initial public offering in 2007.
 2023 ESG Report | Franco-Nevada Page 53 Page 55