
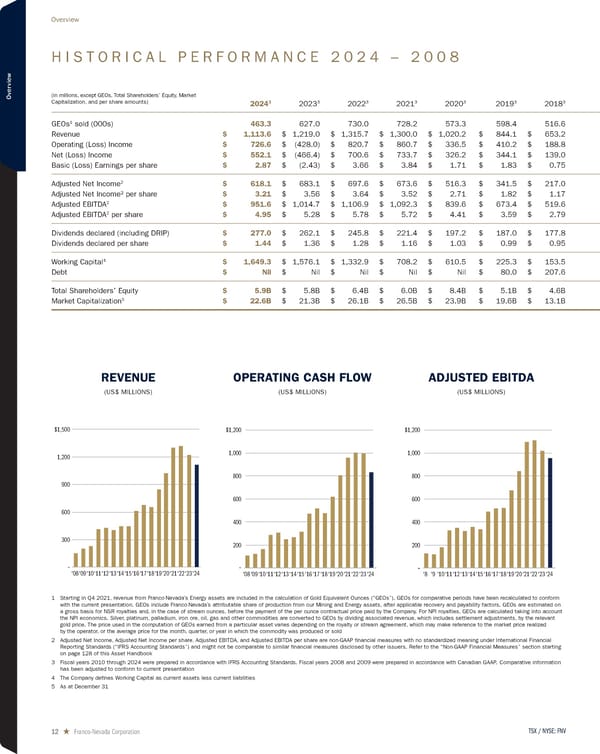
H I S T O R I C A L P E R F O R M A N C E 2 0 2 4 – 2 0 0 8 1 Starting in Q4 2021, revenue from Franco-Nevada’s Energy assets are included in the calculation of Gold Equivalent Ounces (“GEOs”). GEOs for comparative periods have been recalculated to conform with the current presentation. GEOs include Franco-Nevada’s attributable share of production from our Mining and Energy assets, after applicable recovery and payability factors. GEOs are estimated on a gross basis for NSR royalties and, in the case of stream ounces, before the payment of the per ounce contractual price paid by the Company. For NPI royalties, GEOs are calculated taking into account the NPI economics. Silver, platinum, palladium, iron ore, oil, gas and other commodities are converted to GEOs by dividing associated revenue, which includes settlement adjustments, by the relevant gold price. The price used in the computation of GEOs earned from a particular asset varies depending on the royalty or stream agreement, which may make reference to the market price realized by the operator, or the average price for the month, quarter, or year in which the commodity was produced or sold 2 Adjusted Net Income, Adjusted Net Income per share, Adjusted EBITDA, and Adjusted EBITDA per share are non-GAAP financial measures with no standardized meaning under International Financial Reporting Standards (“IFRS Accounting Standards”) and might not be comparable to similar financial measures disclosed by other issuers. Refer to the “Non-GAAP Financial Measures” section starting on page 128 of this Asset Handbook 3 Fiscal years 2010 through 2024 were prepared in accordance with IFRS Accounting Standards. Fiscal years 2008 and 2009 were prepared in accordance with Canadian GAAP. Comparative information has been adjusted to conform to current presentation 4 The Company defines Working Capital as current assets less current liabilities 5 As at December 31 REVENUE (US$ MILLIONS) OPERATING CASH FLOW (US$ MILLIONS) 300 – 600 900 1,200 $1,500 ‘24 ‘23 ‘22 ‘21 ‘20 ‘19 ‘18 ‘17 ‘16 ‘15 ‘14 ‘13 ‘12 ‘11 ‘10 ‘09 ‘08 (in millions, except GEOs, Total Shareholders’ Equity, Market Capitalization, and per share amounts) 2024 3 2023 3 2022 3 2021 3 2020 3 2019 3 2018 3 GEOs 1 sold (000s) 463.3 627.0 730.0 728.2 573.3 598.4 516.6 Revenue $ 1,113.6 $ 1,219.0 $ 1,315.7 $ 1,300.0 $ 1,020.2 $ 844.1 $ 653.2 Operating (Loss) Income $ 726.6 $ (428.0) $ 820.7 $ 860.7 $ 336.5 $ 410.2 $ 188.8 Net (Loss) Income $ 552.1 $ (466.4) $ 700.6 $ 733.7 $ 326.2 $ 344.1 $ 139.0 Basic (Loss) Earnings per share $ 2.87 $ (2.43) $ 3.66 $ 3.84 $ 1.71 $ 1.83 $ 0.75 Adjusted Net Income 2 $ 618.1 $ 683.1 $ 697.6 $ 673.6 $ 516.3 $ 341.5 $ 217.0 Adjusted Net Income2 per share $ 3.21 $ 3.56 $ 3.64 $ 3.52 $ 2.71 $ 1.82 $ 1.17 Adjusted EBITDA 2 $ 951.6 $ 1,014.7 $ 1,106.9 $ 1,092.3 $ 839.6 $ 673.4 $ 519.6 Adjusted EBITDA 2 per share $ 4.95 $ 5.28 $ 5.78 $ 5.72 $ 4.41 $ 3.59 $ 2.79 Dividends declared (including DRIP) $ 277.0 $ 262.1 $ 245.8 $ 221.4 $ 197.2 $ 187.0 $ 177.8 Dividends declared per share $ 1.44 $ 1.36 $ 1.28 $ 1.16 $ 1.03 $ 0.99 $ 0.95 Working Capital 4 $ 1,649.3 $ 1,576.1 $ 1,332.9 $ 708.2 $ 610.5 $ 225.3 $ 153.5 Debt $ Nil $ Nil $ Nil $ Nil $ Nil $ 80.0 $ 207.6 Total Shareholders’ Equity $ 5.9B $ 5.8B $ 6.4B $ 6.0B $ 8.4B $ 5.1B $ 4.6B Market Capitalization 5 $ 22.6B $ 21.3B $ 26.1B $ 26.5B $ 23.9B $ 19.6B $ 13.1B ADJUSTED EBITDA (US$ MILLIONS) 200 – 400 600 800 1,000 $1,200 ‘24 ‘23 ‘22 ‘21 ‘20 ‘19 ‘18 ‘17 ‘16 ‘15 ‘14 ‘13 ‘12 ‘11 ‘10 ‘09 ‘08 – 200 400 600 800 1,000 $1,200 ‘24 ‘23 ‘22 ‘21 ‘20 ‘19 ‘18 ‘17 ‘16 ‘15 ‘14 ‘13 ‘12 ‘11 ‘10 ‘9 ‘8 TSX / NYSE: FNV 12 ★ Franco-Nevada Corporation Overview
 2025 Asset Handbook Page 11 Page 13