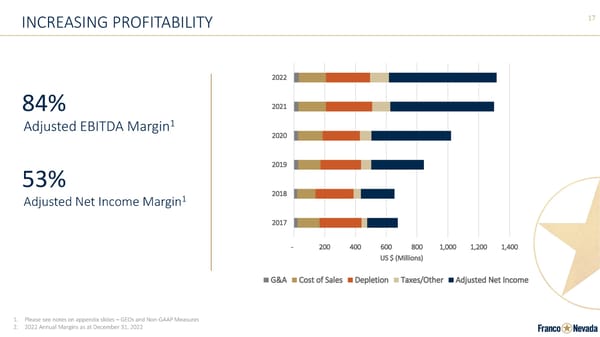
INCREASING PROFITABILITY 17 2022 84% 2021 1 Adjusted EBITDA Margin 2020 53% 2019 Adjusted Net Income Margin1 2018 2017 - 200 400 600 800 1,000 1,200 1,400 US $ (Millions) G&A Cost of Sales Depletion Taxes/Other Adjusted Net Income 1. Please see notes on appendix slides – GEOs and Non-GAAP Measures 2. 2022 Annual Margins as at December 31, 2022
 Corporate Presentation | Franco-Nevada Page 16 Page 18