
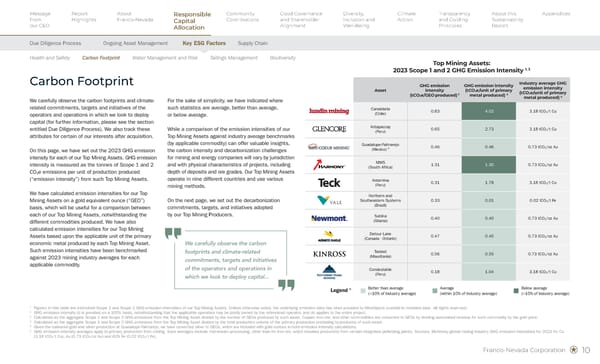
Carbon Footprint
Top Mining Assets: Tailings Structure Characteristics and Management 1, 2, 3 Asset Number and type of active tailings dams Classification system adopted Tailings management Detour Lake (Canada - Ontario) 1 - Downstream Canadian Dam Association Agnico Eagle has appointed an Accountable Executive for all TSFs who reports annually to the Board on compliance with regulatory and industry standards, resourcing, and risk. Engineers of Record (EoR) and Responsible Persons are designated for the facility, and Independent Tailings Review Boards (ITRBs) have been established at material sites, consistent with CDA guidance and GISTM alignment. Hemlo (Canada - Ontario) 9 - Centreline / Modified Centreline Raises GISTM TSFs were governed under Barrick’s Group Tailings Management Standard aligned with GISTM, including designated EoRs and independent third party review. Guadalupe- Palmarejo (Mexico) 1 - Downstream Canadian Dam Association Coeur’s Responsible Tailings Management Policy requires each TSF to have a formally designated EoR, Responsible Tailings Facility Engineer, and independent review function (either ITRB or Senior Independent Technical Reviewer), with escalation to corporate leadership and Board oversight where performance or risk thresholds warrant. Tocantinzinho (Brazil) 1 - Downstream GISTM Tocantinzinho was designed and permitted with GISTM principles embedded from development, including conservative downstream construction, clear accountability, EoR designation, and third - party technical review. As a new operation, governance structures are being formalized as part of G Mining Ventures’ transition from developer to operator. Antapaccay (Peru) 1 - Downstream GISTM For “Very High” and “Extreme” consequence TSFs, Glencore requires ITRB oversight. Antapaccay’s TSF is subject to regular third - party assurance by internationally recognized dam engineering firms, typically on a rolling 12–18 - month cycle, with results reported through Glencore’s central tailings governance structure. Côté Gold (Canada - Ontario) 1 - Centreline Canadian Dam Association As a newly operating asset, Côté Gold is governed under IAMGOLD’s corporate Tailings Management Framework aligned with CDA requirements and progressing toward full GISTM conformance. The facility has an EoR, defined operating accountabilities, OMS and EPRP documentation, and independent technical review commensurate with risk profile. Candelaria (Chile) 1 - Downstream GISTM Candelaria’s tailings storage facilities are regulated under Chilean law, including SERNAGEOMIN DS 248/2007 and DGA Decreto 50 (2015). Lundin Mining has undertaken independent third - party gap assessments against GISTM, and the active tailings facilities at Candelaria are reported to be in conformance with GISTM. Oversight is supported through Lundin Mining’s corporate Tailings Management Standard and ITRBs established across the portfolio. Subika (Ghana) 1 - Downstream / Modified Centreline Canadian Dam Association Newmont applies a multi - criteria alternatives analysis for TSF siting, design, and construction methods, supported by internal expertise and external consultants. Governance includes EoR designation and review through an ITRB or Senior Independent Technical Reviewer, consistent with Newmont’s enterprise tailings standard aligned with GISTM. Western Limb PGM Complex (South Africa) 12 - Upstream GISTM; South Africa SAN 10286 Sibanye - Stillwater has committed to GISTM conformance across its TSFs. The Western Limb TSFs are governed under South African regulatory standards, supported by centralized group oversight, defined accountability, EoR appointments, and independent review proportionate to consequence classification. Antamina (Peru) 1 - Downstream / Centreline Hybrid Canadian Dam Association Comprehensive tailings management at Antamina is aligned with GISTM. Teck’s TSFs are governed by site - specific Tailings Management Systems meeting or exceeding industry standards, with EoRs, OMS manuals, and Emergency Preparedness and Response Plans. An ITRB is in place at Antamina, and Teck contributes senior experts to Antamina’s Tailings Technical Committee as part of joint - venture governance. 1 Tailings data sourced from Global Tailings Portal and company reporting. 2 Tailings structure data (i) is provided on a 100% basis, notwithstanding that the applicable operation may be jointly owned by the referenced operator, and (ii) applies to the entire project. 3 All information pertaining to operators' review and management of their TSFs on this page has been sourced from the operators' public websites and other public disclosure documents. Franco-Nevada has not independently verified any data presented herein. Tailings Management Following several major tailings dam failures over the past decade, tailings storage facilities (“TSFs”) have been subject to heightened regulatory scrutiny and increased stakeholder expectations. In 2019, an investor - led initiative coordinated by the Church of England Pensions Board and the Council on Ethics of the Swedish National Pension Funds called on mining companies to enhance transparency regarding TSFs, identifying the absence of a globally consistent standard as a contributing factor to past failures. In response, the Global Industry Standard on Tailings Management (“GISTM”) was launched in August 2020 with the objective of achieving zero harm to people and the environment. The GISTM establishes comprehensive requirements for the governance, design, construction, operation, monitoring, closure and post - closure management of TSFs across their full lifecycle. Substantially all of our Top Mining Producers have committed to implementing the GISTM or an equivalent international framework, such as the Towards Sustainable Mining (“TSM”) program. Consistent with industry expectations, summary information on the TSFs associated with our Top Mining Assets is publicly disclosed by operators through the Global Tailings Portal (tailing.grida.no). Responsible tailings management requires rigorous oversight throughout the life of a facility, from initial design and construction through closure and post - closure care. As part of our capital allocation and due diligence processes, we review the planned and existing waste management and tailings arrangements for each project. Where appropriate, our royalty and streaming agreements include contractual commitments requiring operators to implement the GISTM or another equivalent international standard and to provide ongoing reporting regarding adherence to such standards. On this page, we summarize selected characteristics of the TSFs associated with our Top Mining Assets, together with an overview of each operator’s approach to tailings governance and oversight. Franco-Nevada Corporation 10
 Sustainability Report 2025 Page 11 Page 13