
Health and Safety
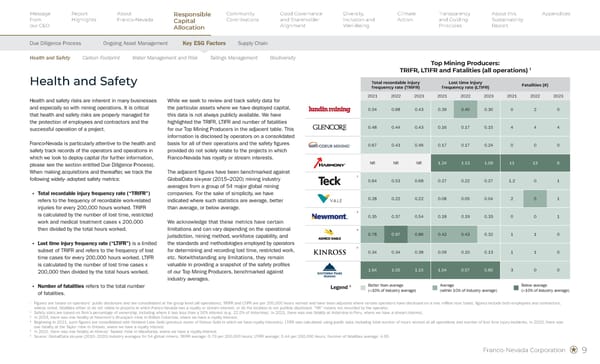
Top Mining Producers: TRIFR, LTIFR and Fatalities (all operations) 1 Total recordable injury frequency rate (TRIFR) Lost time injury frequency rate (LTIFR) Fatalities (#) 2022 2023 2024 2022 2023 2024 2022 2023 2024 2 0.97 0.86 1.03 0.43 0.32 0.34 1 0 0 0.26 0.23 0.18 0.06 0.05 0.02 5 5 3 0.43 0.46 0.67 0.17 0.24 0.44 0 0 0 0.30 0.34 0.08 0 0 0.08 0 0 0 0.44 0.44 0.37 0.17 0.16 0.14 4 4 4 0.76 0.69 0.63 0.08 0.15 0.09 1 0 0 0.68 0.43 0.49 0.40 0.30 0.34 2 0 1 3 0.37 0.54 0.62 0.19 0.33 0.41 0 1 4 4 1.01 1.05 0.87 0.88 0.91 0.77 5 11 8 5 0.38 0.45 0.65 0.15 0.14 0.31 0 1 1 Legend 6 Better than average (<10% of industry average) Average (within 10% of industry average) Below average (>10% of industry average) 1 Figures are based on operators’ public disclosure and are consolidated at the group level (all operations); TRIFR and LTIFR are per 200,000 hours worked and have been adjusted where certain operators have disclosed on a one million hour basis; figures include both employees and contractors; unless noted, fatalities either (i) do not relate to projects in which Franco-Nevada has a royalty or stream interest, or (ii) the location is not publicly disclosed. 2 In 2022, there was one fatality at the Taylor mine in Ontario, where we have a royalty interest. 3 In 2023, there was one fatality at Newmont's Brucejack mine in British Columbia, where we have a royalty interest. Due to data availability and comparability, TRIFR and LTIFR data for 2022 and 2023 does not include the former Newcrest Mining Limited assets acquired by Newmont in November 2023. 4 In 2023, there was one fatality at Sibanye - Stillwater’s Stillwater mine in Montana, where we have a royalty interest. Certain fatalities occurred at Sibanye - Stillwater’s Western Limb PGM operations prior to Franco - Nevada’s acquisition of its stream interest in December 2024. 5 TRIFR and LTIFR are reported for Teck-controlled assets only and exclude data associated with Teck’s previously owned steelmaking coal operations, which were sold in 2024. In 2024, there was one fatality at the Antamina mine (a joint venture between Teck, BHP, Glencore and Mitsubishi), where we have a stream on Teck’s 22.5% interest. 6 Source: GlobalData, Safety Trends in Mining, 2025, based on publicly disclosed health and safety data reported by leading mining companies. Five - year industry averages (2020–2024): TRIFR: approximately 0.60 per 200,000 hours worked (derived from a five - year average of 3.00 per one million hours, based on data from 41 companies). LTIFR: approximately 0.34 per 200,000 hours worked (derived from a five - year average of 1.70 per one million hours, based on data from 42 companies). Number of fatalities average (rounded): 3.5 per company (five - year average across 54 companies). Health and safety risks are inherent in many businesses, and are particularly relevant in mining operations. The effective identification, assessment and management of these risks is critical to protecting employees and contractors, and to supporting the safe, reliable and uninterrupted operation of mining projects. Franco - Nevada places significant emphasis on the health and safety track records of the operators and operations in which we consider deploying capital (for further information, see Due Diligence Process ). As part of our acquisition evaluation and, where applicable, on an ongoing basis thereafter, we monitor the following widely adopted health and safety metrics: § Total recordable injury frequency rate (“TRIFR”) refers to the frequency of recordable work-related injuries for every 200,000 hours worked. TRIFR is calculated by the number of lost time, restricted work and medical treatment cases x 200,000 then divided by the total hours worked. § Lost time injury frequency rate (“LTIFR”) is a limited subset of TRIFR and refers to the frequency of lost time cases for every 200,000 hours worked. LTIFR is calculated by the number of lost time cases x 200,000 then divided by the total hours worked. § Number of fatalities refers to the total number of fatalities. Health and Safety While we seek to review and track safety data for the particular assets where we have deployed capital, this data is not always publicly available. We have highlighted the TRIFR, LTIFR and number of fatalities for our Top Mining Producers in the adjacent table. This information is disclosed by operators on a consolidated basis for all of their operations and the safety figures provided do not solely relate to the projects in which Franco-Nevada has royalty or stream interests. Health and safety performance is benchmarked using publicly available mining industry safety data published by GlobalData, which provides globally comparable metrics for TRIFR, LTIFR, and fatalities across a broad cross - section of leading mining companies. Industry benchmarks are based on GlobalData’s consolidated five - year average analysis over the 2020–2024 period, with TRIFR data available for up to 41 companies, LTIFR data for up to 42 companies, and fatalities data for up to 54 companies, depending on metric availability and reporting year. While GlobalData standardizes and aggregates these metrics to support comparability, coverage varies by metric and reporting practices differ among operators; accordingly, TRIFR and LTIFR benchmarks are presented to provide industry context rather than precise like - for - like comparisons at the asset level. We also acknowledge that these metrics have inherent limitations and may vary based on factors such as operational jurisdiction, mining method, workforce capability, and the standards and methodologies used by operators to define and record injuries (including lost time and restricted work cases). Notwithstanding these limitations, the metrics remain useful in providing a high - level snapshot of the safety performance and relative risk profiles of our Top Mining Producers, particularly when considered alongside qualitative context and multi - year trends, even where comprehensive industry benchmarks are not publicly available. Franco-Nevada Corporation 9
 Sustainability Report 2025 Page 10 Page 12