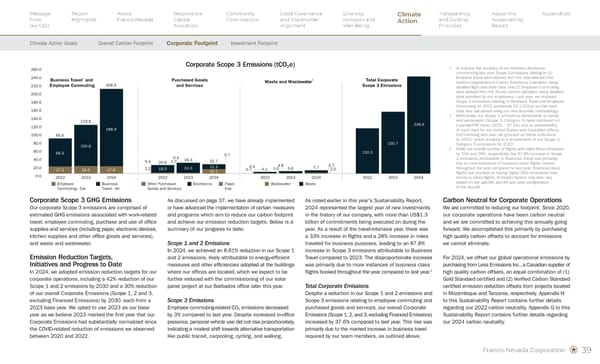
Franco-Nevada Corporation 39 Corporate Scope 3 GHG Emissions Our corporate Scope 3 emissions are comprised of estimated GHG emissions associated with work-related travel, employee commuting, purchase and use of office supplies and services (including paper, electronic devices, kitchen supplies and other office goods and services), and waste and wastewater. Emission Reduction Targets, Initiatives and Progress to Date In 2024, we adopted emission reduction targets for our corporate operations, including a 42% reduction of our Scope 1 and 2 emissions by 2030 and a 30% reduction of our overall Corporate Emissions (Scope 1, 2 and 3, excluding Financed Emissions) by 2030, each from a 2023 base year. We opted to use 2023 as our base year as we believe 2023 marked the first year that our Corporate Emissions had substantially normalized since the COVID-related reduction of emissions we observed between 2020 and 2022. As discussed on page 37, we have already implemented or have advanced the implementation of certain measures and programs which aim to reduce our carbon footprint and achieve our emission reduction targets. Below is a summary of our progress to date: Scope 1 and 2 Emissions In 2024, we achieved an 8.61% reduction in our Scope 1 and 2 emissions, likely attributable to energy-efficient measures and other efficiencies adopted at the buildings where our offices are located, which we expect to be further reduced with the commissioning of our solar panel project at our Barbados office later this year. Scope 3 Emissions Employee commuting-related CO2 emissions decreased by 3% compared to last year. Despite increased in-office presence, personal vehicle use did not rise proportionately, indicating a modest shift towards alternative transportation like public transit, carpooling, cycling, and walking. As noted earlier in this year's Sustainability Report, 2024 represented the largest year of new investments in the history of our company, with more than US$1.3 billion of commitments being executed on during the year. As a result of the travel-intensive year, there was a 33% increase in flights and a 28% increase in miles traveled for business purposes, leading to an 87.8% increase in Scope 3 emissions attributable to Business Travel compared to 2023. The disproportionate increase was primarily due to more instances of business class flights booked throughout the year compared to last year.◊ Total Corporate Emissions Despite a reduction in our Scope 1 and 2 emissions and Scope 3 emissions relating to employee commuting and purchased goods and services, our overall Corporate Emissions (Scope 1, 2, and 3, excluding Financed Emissions) increased by 37.6% compared to last year. This rise was primarily due to the marked increase in business travel required by our team members, as outlined above. Carbon Neutral for Corporate Operations We are committed to reducing our footprint. Since 2020, our corporate operations have been carbon neutral and we are committed to achieving this annually going forward. We accomplished this primarily by purchasing high quality carbon offsets to account for emissions we cannot eliminate. For 2024, we offset our global operational emissions by purchasing from Less Emissions Inc., a Canadian supplier of high quality carbon offsets, an equal combination of (1) Gold Standard certified and (2) Verified Carbon Standard certified emission reduction offsets from projects located in Mozambique and Tanzania, respectively. Appendix H to this Sustainability Report contains further details regarding our 2022 carbon neutrality. Appendix G to this Sustainability Report contains further details regarding our 2024 carbon neutrality. Employee Commuting - Car Business Travel - Air Other Purchased Goods and Services Electronics Paper Use Wastewater Waste 0.0 20.0 40.0 60.0 80.0 100.0 120.0 140.0 160.0 180.0 200.0 220.0 240.0 260.0 2024 2023 2022 2024 2023 2022 2024 2023 2022 2024 2023 2022 Business Travel* and Employee Commuting Purchased Goods and Services Waste and Wastewater † Total Corporate Scope 3 Emissions 17.3 68.3 85.6 18.2 100.6 118.8 17.6 188.9 206.5 2.2 0.4 18.0 20.6 0.7 3.4 1.04.6 2.0 5.7 0.7 1.7 0.3 24.3 26.3 11.3 10.7 22.7 110.3 236.9 4.1 5.6 7.7 150.7 Corporate Scope 3 Emissions (tCO2e) * To improve the accuracy of our emission disclosure, commencing last year, Scope 3 emissions relating to (1) Business Travel were derived from the International Civil Aviation Organization’s Carbon Emissions Calculator using detailed flight and other data, and (2) Employee Commuting were derived from the Thrust Carbon calculator using detailed data provided by our employees. Last year, we restated Scope 3 emissions relating to Business Travel and Employee Commuting for 2022 (previously 22.2 tCO2e) so that such data was calculated using our new accurate methodology. † Historically, our Scope 3 emissions attributable to waste and wastewater (Scope 3, Category 5) were disclosed on a partial FTE basis (2022 – 87.5%) due to unavailability of such data for our United States and Australian offices. Commencing last year, we grossed up these emissions to 100%, which resulted in a restatement of our Scope 3, Category 5 emissions for 2022. ◊ While the overall number of flights and miles flown increased by 33% and 28%, respectively, the 87.8% increase in Scope 3 emissions attributable to Business Travel was primarily due to more instances of business class flights booked throughout the year compared to last year. Business class flights are counted as having higher GHG emissions than economy class flights. Emission factors may also vary based on the specific aircraft and seat configuration of the aircraft. Message from our CEO Report Highlights About Franco-Nevada Responsible Capital Allocation Community Contributions Good Governance and Shareholder Alignment Diversity, Inclusion and Well-Being Transparency and Guiding Principles About this Sustainability Report Appendices Climate Action Goals Overall Carbon Footprint Investment Footprint Climate Action Corporate Footprint
 Sustainability Report 2025 Page 40 Page 42