
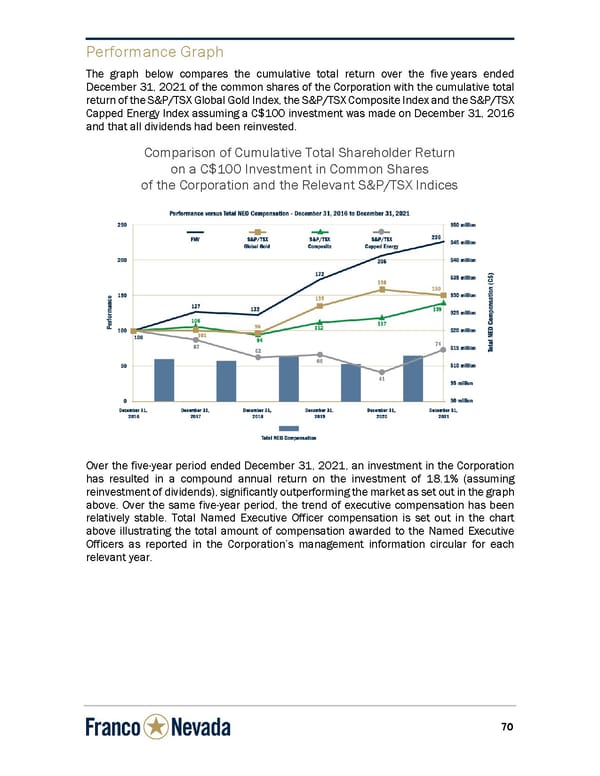
7 7 0 Performance Graph The graph below compares the cumulative total return over the five years ended December 31, 2021 of the common shares of the Corporation with the cumulative total return of the S&P/TSX Global Gold Index, the S&P/TSX Composite Index and the S&P/TSX Capped Energy Index assuming a C$100 inve stment was made on December 31, 2016 and that all dividends had been reinvested. Comparison of Cumulative Total Shareholder Return on a C$100 Investment in Common Shares of the Corporation and the Relevant S&P/TSX Indices Over the five-year period ended December 31, 2021, an investment in the Corporation has resulted in a compound annual return on the investment of 18.1% (assuming reinvestment of dividends), significantly outperforming the market as set out in the graph above. Over the same five-year period, the trend of executive compensation has been relatively stable. Total Named Executive Officer compensation is set out in the chart above illustrating the total amount of compensation awarded to the Named Executive Officers as reported in the Corporation’s management information circular for each relevant year.
 Circular Page 77 Page 79