
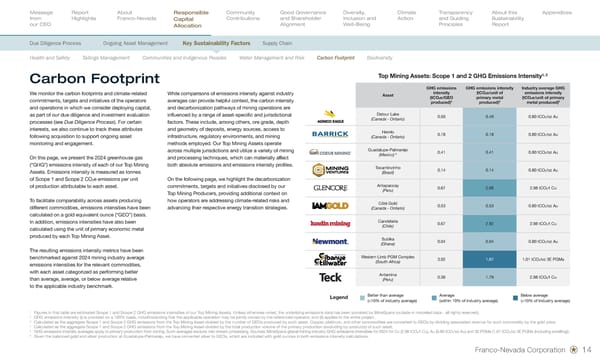
1 Figures in this table are estimated Scope 1 and Scope 2 GHG emissions intensities of our Top Mining Assets. Unless otherwise noted, the underlying emissions data has been provided by MineSpans (outside-in modeled data - all rights reserved). 2 GHG emissions intensity (i) is provided on a 100% basis, notwithstanding that the applicable operation may be jointly owned by the referenced operator, and (ii) applies to the entire project. 3 Calculated as the aggregate Scope 1 and Scope 2 GHG emissions from the Top Mining Asset divided by the number of GEOs produced by such asset. Copper, platinum, and other commodities are converted to GEOs by dividing associated revenue for such commodity by the gold price. 4 Calculated as the aggregate Scope 1 and Scope 2 GHG emissions from the Top Mining Asset divided by the total production volume of the primary production (excluding by-products) of such asset. 5 GHG emissions intensity averages apply to primary production from mining. Such averages exclude mid-stream processing. Sources: MineSpans global mining industry GHG emissions intensities for 2024 for Cu (2.98 tCO 2 /t Cu), Au (0.80 tCO 2 /oz Au) and 3E PGMs (1.01 tCO 2 /oz 3E PGMs (including smelting)). 6 Given the balanced gold and silver production at Guadalupe-Palmarejo, we have converted silver to GEOs, which are included with gold ounces in both emissions intensity calculations. Legend Better than average (<10% of industry average) Average (within 10% of industry average) Below average (>10% of industry average) We monitor the carbon footprints and climate - related commitments, targets and initiatives of the operators and operations in which we consider deploying capital, as part of our due diligence and investment evaluation processes (see Due Diligence Process ). For certain interests, we also continue to track these attributes following acquisition to support ongoing asset monitoring and engagement. On this page, we present the 2024 greenhouse gas (“GHG”) emissions intensity of each of our Top Mining Assets. Emissions intensity is measured as tonnes of Scope 1 and Scope 2 CO 2 e emissions per unit of production attributable to each asset. To facilitate comparability across assets producing different commodities, emissions intensities have been calculated on a gold equivalent ounce (“GEO”) basis. In addition, emissions intensities have also been calculated using the unit of primary economic metal produced by each Top Mining Asset. The resulting emissions intensity metrics have been benchmarked against 2024 mining industry average emissions intensities for the relevant commodities, with each asset categorized as performing better than average, average, or below average relative to the applicable industry benchmark. While comparisons of emissions intensity against industry averages can provide helpful context, the carbon intensity and decarbonization pathways of mining operations are influenced by a range of asset - specific and jurisdictional factors. These include, among others, ore grade, depth and geometry of deposits, energy sources, access to infrastructure, regulatory environments, and mining methods employed. Our Top Mining Assets operate across multiple jurisdictions and utilize a variety of mining and processing techniques, which can materially affect both absolute emissions and emissions intensity profiles. On the following page, we highlight the decarbonization commitments, targets and initiatives disclosed by our Top Mining Producers, providing additional context on how operators are addressing climate - related risks and advancing their respective energy transition strategies. Carbon Footprint Top Mining Assets: Scope 1 and 2 GHG Emissions Intensity 1, 2 Asset GHG emissions intensity (tCO 2 e/GEO produced) 3 GHG emissions intensity (tCO 2 e/unit of primary metal produced) 4 Industry average GHG emissions intensity (tCO 2 e/unit of primary metal produced) 5 Detour Lake (Canada - Ontario) 0.50 0.49 0.80 tCO 2 /oz Au Hemlo (Canada - Ontario) 0.18 0.18 0.80 tCO 2 /oz Au Guadalupe-Palmarejo (Mexico) 6 0.41 0.41 0.80 tCO 2 /oz Au Tocantinzinho (Brazil) 0.14 0.14 0.80 tCO 2 /oz Au Antapaccay (Peru) 0.67 2.68 2.98 tCO 2 /t Cu Côté Gold (Canada - Ontario) 0.53 0.53 0.80 tCO 2 /oz Au Candelaria (Chile) 0.67 2.92 2.98 tCO 2 /t Cu Subika (Ghana) 0.04 0.04 0.80 tCO 2 /oz Au Western Limb PGM Complex (South Africa) 3.02 1.67 1.01 tCO 2 /oz 3E PGMs Antamina (Peru) 0.36 1.79 2.98 tCO 2 /t Cu Franco-Nevada Corporation 14
 Sustainability Report 2026 Page 15 Page 17