
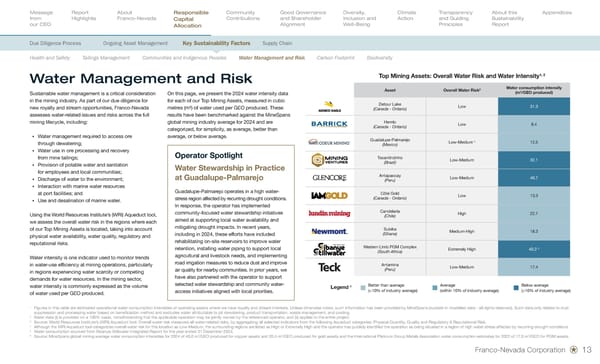
1 Figures in this table are estimated operational water consumption intensities of operating assets where we have royalty and stream interests. Unless otherwise noted, such information has been provided by MineSpans (outside-in modelled data - all rights reserved). Such data only relates to dust suppression and processing water based on beneficiation method and excludes water attributable to pit dewatering, product transportation, waste management, and cooling. 2 Water data (i) is provided on a 100% basis, notwithstanding that the applicable operation may be jointly owned by the referenced operator, and (ii) applies to the entire project. 3 Source: World Resources Institute’s (WRI) Aqueduct tool. Overall water risk measures all water-related risks, by aggregating all selected indicators from the following Aqueduct categories: Physical Quantity, Quality and Regulatory & Reputational Risk. 4 Although the WRI Aqueduct tool categorizes overall water risk for this location as Low-Medium, the surrounding regions are listed as High or Extremely High and the operator has publicly identified the operation as being situated in a region of high water stress affected by recurring drought conditions. 5 Water consumption sourced from Sibanye-Stillwater Integrated Report for the year ended 31 December 2024. 6 Source: MineSpans global mining average water consumption intensities for 2024 of 40.0 m 3 /GEO produced for copper assets and 20.4 m 3 /GEO produced for gold assets and the International Platinum Group Metals Association water consumption estimates for 2022 of 17.0 m 3 /GEO for PGM assets. Sustainable water management is a critical consideration in the mining industry. As part of our due diligence for new royalty and stream opportunities, Franco - Nevada assesses water - related issues and risks across the full mining lifecycle, including: § Water management required to access ore through dewatering; § Water use in ore processing and recovery from mine tailings; § Provision of potable water and sanitation for employees and local communities; § Discharge of water to the environment; § Interaction with marine water resources at port facilities; and § Use and desalination of marine water. Using the World Resources Institute’s (WRI) Aqueduct tool, we assess the overall water risk in the regions where each of our Top Mining Assets is located, taking into account physical water availability, water quality, regulatory and reputational risks. Water intensity is one indicator used to monitor trends in water - use efficiency at mining operations, particularly in regions experiencing water scarcity or competing demands for water resources. In the mining sector, water intensity is commonly expressed as the volume of water used per GEO produced. On this page, we present the 2024 water intensity data for each of our Top Mining Assets, measured in cubic metres (m³) of water used per GEO produced. These results have been benchmarked against the MineSpans global mining industry average for 2024 and are categorized, for simplicity, as average, better than average, or below average. Water Management and Risk Top Mining Assets: Overall Water Risk and Water Intensity 1, 2 Asset Overall Water Risk 3 Water consumption intensity (m 3 /GEO produced) Detour Lake (Canada - Ontario) Low 31.3 Hemlo (Canada - Ontario) Low 8.4 Guadalupe-Palmarejo (Mexico) Low-Medium 4 12.5 Tocantinzinho (Brazil) Low-Medium 32.1 Antapaccay (Peru) Low-Medium 46.7 Côté Gold (Canada - Ontario) Low 13.3 Candelaria (Chile) High 22.7 Subika (Ghana) Medium-High 18.3 Western Limb PGM Complex (South Africa) Extremely High 40.2 5 Antamina (Peru) Low-Medium 17.4 Legend 6 Better than average (<10% of industry average) Average (within 10% of industry average) Below average (>10% of industry average) Operator Spotlight Water Stewardship in Practice at Guadalupe - Palmarejo Guadalupe-Palmarejo operates in a high water - stress region affected by recurring drought conditions. In response, the operator has implemented community - focused water stewardship initiatives aimed at supporting local water availability and mitigating drought impacts. In recent years, including in 2024, these efforts have included rehabilitating on - site reservoirs to improve water retention, installing water piping to support local agricultural and livestock needs, and implementing road irrigation measures to reduce dust and improve air quality for nearby communities. In prior years, we have also partnered with the operator to support selected water stewardship and community water - access initiatives aligned with local priorities. Franco-Nevada Corporation 13
 Sustainability Report 2026 Page 14 Page 16