
Franco-Nevada Corporate Presentation
This document provides an overview of Franco-Nevada's gold investment strategies as a corporate presentation, marking 15 years since its IPO.
FNV: TSX | NYSE Corporate Presentation
2 CAUTIONARY STATEMENT Forward Looking Statements This presentation contains “forward looking information” and “forward looking statements” within the meaning of applicable Canadian securities laws and the United States Private Securities Litigation Reform Act of 1995, respectively, which may include, but are not limited to, statements with respect to future events or future performance, management’s expectations regarding Franco-Nevada’s growth, results of operations, estimated future revenues, performance guidance, carrying value of assets, future dividends and requirements for additional capital, mineral resources and mineral reserves estimates, production estimates, production costs and revenue, future demand for and prices of commodities, expected mining sequences, business prospects and opportunities, the performance and plans of third party operators, audits being conducted by the Canada Revenue Agency (“CRA”), the expected exposure for current and future assessments and available remedies, the completion of the public consultation process and obtaining all required Panamanian approvals for the Proposed Concession Contract with the Government of Panama for the Cobre Panama mine and the terms of the Proposed Concession Contract. In addition, statements (including data in tables) relating to resources and reserves including resources and reserves covered by a royalty, stream or other interest, gold equivalent ounces (“GEOs”) or mine lives are forward looking statements, as they involve implied assessment, based on certain estimates and assumptions, and no assurance can be given that the estimates and assumptions are accurate and that such resources and reserves, mine lives and GEOs will be realized. Such forward looking statements reflect management’s current beliefs and are based on information currently available to management. Often, but not always, forward looking statements can be identified by the use of words such as “plans”, “expects”, “is expected”, “budgets”, “potential for”, “scheduled”, “estimates”, “forecasts”, “predicts”, “projects”, “intends”, “targets”, “aims”, “anticipates” or “believes” or variations (including negative variations) of such words and phrases or may be identified by statements to the effect that certain actions “may”, “could”, “should”, “would”, “might” or “will” be taken, occur or be achieved. Forward looking statements involve known and unknown risks, uncertainties and other factors, which may cause the actual results, performance or achievements of Franco-Nevada to be materially different from any future results, performance or achievements expressed or implied by the forward looking statements. A number of factors could cause actual events or results to differ materially from any forward looking statement, including, without limitation: fluctuations in the prices of the primary commodities that drive royalty and stream revenue (gold, platinum group metals, copper, nickel, uranium, silver, iron-ore and oil and gas); fluctuations in the value of the Canadian and Australian dollar, Mexican peso and any other currency in which revenue is generated, relative to the U.S. dollar; changes in national and local government legislation, including permitting and licensing regimes and taxation policies and the enforcement thereof; the adoption of a global minimum tax on corporations; regulatory, political or economic developments in any of the countries where properties in which Franco-Nevada holds a royalty, stream or other interest are located or through which they are held; risks related to the operators of the properties in which Franco-Nevada holds a royalty, stream or other interest, including changes in the ownership and control of such operators; relinquishment or sale of mineral properties; influence of macroeconomic developments; business opportunities that become available to, or are pursued by Franco-Nevada; reduced access to debt and equity capital; litigation; title, permit or license disputes related to interests on any of the properties in which Franco-Nevada holds a royalty, stream or other interest; whether or not Franco-Nevada is determined to have “passive foreign investment company” (“PFIC”) status as defined in Section 1297 of the United States Internal Revenue Code of 1986, as amended; potential changes in Canadian tax treatment of offshore streams; excessive cost escalation as well as development, permitting, infrastructure, operating or technical difficulties on any of the properties in which Franco-Nevada holds a royalty, stream or other interest; access to sufficient pipeline capacity; actual mineral content may differ from the resources and reserves contained in technical reports; rate and timing of production differences from resource estimates, other technical reports and mine plans; risks and hazards associated with the business of development and mining on any of the properties in which Franco-Nevada holds a royalty, stream or other interest, including, but not limited to unusual or unexpected geological and metallurgical conditions, slope failures or cave-ins, sinkholes, flooding and other natural disasters, terrorism, civil unrest or an outbreak of contagious disease; the impact of the COVID-19 (coronavirus) pandemic; and the integration of acquired assets. The forward looking statements contained in this presentation are based upon assumptions management believes to be reasonable, including, without limitation: the ongoing operation of the properties in which Franco-Nevada holds a royalty, stream or other interest by the owners or operators of such properties in a manner consistent with past practice; the accuracy of public statements and disclosures made by the owners or operators of such underlying properties; no material adverse change in the market price of the commodities that underlie the asset portfolio; Franco-Nevada’s ongoing income and assets relating to determination of its PFIC status; no material changes to existing tax treatment; the expected application of tax laws and regulations by taxation authorities; the expected assessment and outcome of any audit by any taxation authority; no adverse development in respect of any significant property in which Franco-Nevada holds a royalty, stream or other interest; the accuracy of publicly disclosed expectations for the development of underlying properties that are not yet in production; integration of acquired assets; and the absence of any other factors that could cause actions, events or results to differ from those anticipated, estimated or intended. However, there can be no assurance that forward looking statements will prove to be accurate, as actual results and future events could differ materially from those anticipated in such statements. Investors are cautioned that forward looking statements are not guarantees of future performance. In addition, there can be no assurance as to the outcome of the ongoing audit by the CRA or the Company’s exposure as a result thereof. Franco-Nevada cannot assure investors that actual results will be consistent with these forward looking statements. Accordingly, investors should not place undue reliance on forward looking statements due to the inherent uncertainty therein. For additional information with respect to risks, uncertainties and assumptions, please refer to Franco-Nevada’s most recent Annual Information Form filed with the Canadian securities regulatory authorities on www.sedar.com and Franco-Nevada’s most recent Annual Report filed on Form 40-F filed with the SEC on www.sec.gov. The forward-looking statements herein are made as of the date herein only and Franco-Nevada does not assume any obligation to update or revise them to reflect new information, estimates or opinions, future events or results or otherwise, except as required by applicable law. Non-GAAP Measures Cash Costs, Cash Costs per GEO sold, Adjusted Net Income, Adjusted Net Income per Share, Adjusted Net Income Margin, Adjusted EBITDA, Adjusted EBITDA per Share, and Adjusted EBITDA Margin are non-GAAP financial measures with no standardized meaning under International Financial Reporting Standards (“IFRS”) and might not be comparable to similar financial measures disclosed by other issuers. For a quantitative reconciliation of each non-GAAP financial measure to the most directly comparable IFRS financial measure, refer to the appendix at the end of this presentation. Further information relating to these Non-GAAP financial measures is incorporated by reference from the “Non-GAAP Financial Measures” section of Franco-Nevada’s MD&A for the three and nine months ended December 31, 2022 and filed on March 15, 2023 with the Canadian securities regulatory authorities on SEDAR available at www.sedar.com and with the U.S. Securities and Exchange Commission available on EDGAR at www.sec.gov. Gold and Gold Equivalent Ounces Starting in Q4 2021, revenue from Franco-Nevada’s Energy assets is included in the calculation of GEOs. GEOs for comparative periods have been recalculated to conform with the current presentation. For further details, please refer to the appendix at the end of this presentation on GEOs and Non-GAAP Measures. This presentation does not constitute an offer to sell or a solicitation for an offer to purchase any security in any jurisdiction.
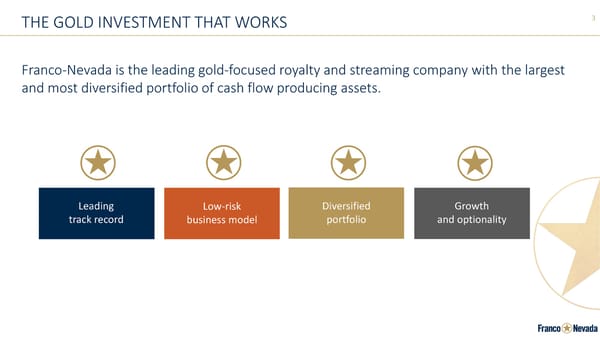
3 THE GOLD INVESTMENT THAT WORKS Franco-Nevada is the leading gold-focused royalty and streaming company with the largest and most diversified portfolio of cash flow producing assets. Leading track record Low-risk business model Diversified portfolio Growth and optionality
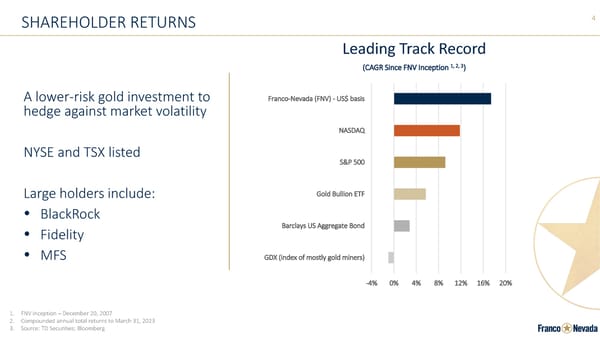
4 SHAREHOLDER RETURNS A lower-risk gold investment to hedge against market volatility NYSE and TSX listed Large holders include: BlackRock Fidelity MFS GDX (index of mostly gold miners) Barclays US Aggregate Bond Gold Bullion ETF S&P 500 NASDAQ Franco-Nevada (FNV) - US$ basis -4% 0% 4% 8% 12% 16% 20% Leading Track Record (CAGR Since FNV Inception 1, 2, 3) 1. FNV Inception – December 20, 2007 2. Compounded annual total returns to March 31, 2023 3. Source: TD Securities; Bloomberg
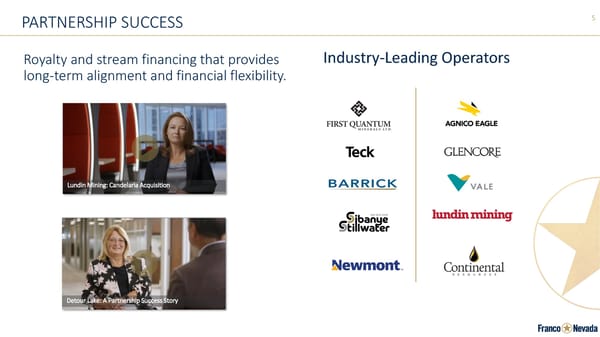
5 PARTNERSHIP SUCCESS Royalty and stream financing that provides long-term alignment and financial flexibility. Industry-Leading Operators Lundin Mining: Candelaria Acquisition Detour Lake: A Partnership Success Story


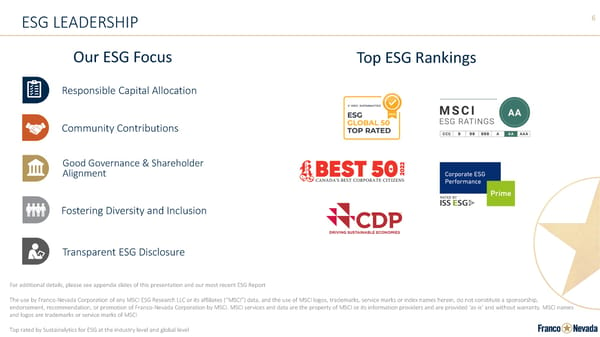
6 ESG LEADERSHIP Responsible Capital Allocation Community Contributions Good Governance & Shareholder Alignment Fostering Diversity and Inclusion Transparent ESG Disclosure For additional details, please see appendix slides of this presentation and our most recent ESG Report The use by Franco-Nevada Corporation of any MSCI ESG Research LLC or its affiliates (“MSCI”) data, and the use of MSCI logos, trademarks, service marks or index names herein, do not constitute a sponsorship, endorsement, recommendation, or promotion of Franco-Nevada Corporation by MSCI. MSCI services and data are the property of MSCI or its information providers and are provided ‘as-is’ and without warranty. MSCI names and logos are trademarks or service marks of MSCI Top rated by Sustainalytics for ESG at the industry level and global level Our ESG Focus Top ESG Rankings
Business Model
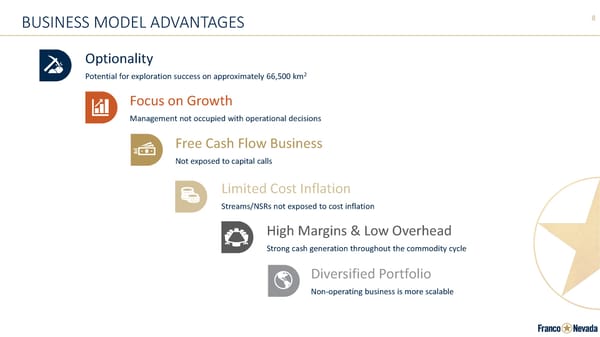
8 BUSINESS MODEL ADVANTAGES Optionality Potential for exploration success on approximately 66,500 km2 Focus on Growth Management not occupied with operational decisions Free Cash Flow Business Not exposed to capital calls Limited Cost Inflation Streams/NSRs not exposed to cost inflation Diversified Portfolio Non-operating business is more scalable High Margins & Low Overhead Strong cash generation throughout the commodity cycle
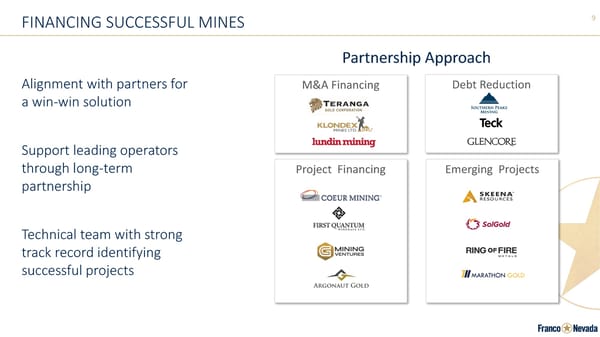
9 FINANCING SUCCESSFUL MINES Alignment with partners for a win-win solution Support leading operators through long-term partnership Technical team with strong track record identifying successful projects M&A Financing Project Financing Debt Reduction Emerging Projects Partnership Approach
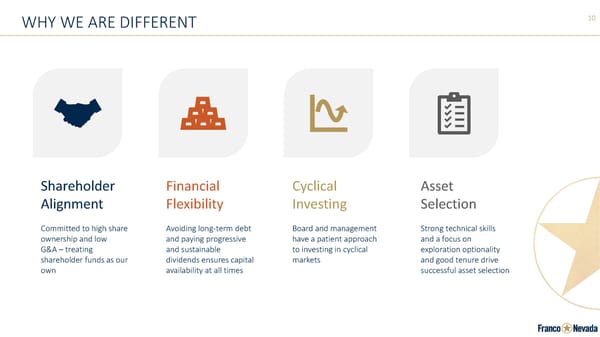
10 WHY WE ARE DIFFERENT Shareholder Alignment Committed to high share ownership and low G&A – treating shareholder funds as our own Financial Flexibility Avoiding long-term debt and paying progressive and sustainable dividends ensures capital availability at all times Cyclical Investing Board and management have a patient approach to investing in cyclical markets Asset Selection Strong technical skills and a focus on exploration optionality and good tenure drive successful asset selection
Asset Portfolio
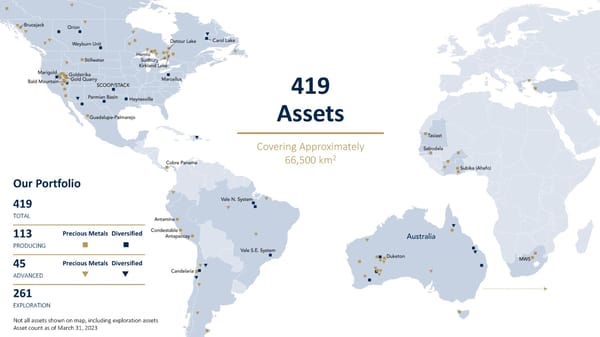
12 Our Portfolio Covering Approximately 66,500 km2 Not all assets shown on map, including exploration assets Asset count as of March 31, 2023 419 TOTAL 113 Precious Metals Diversified PRODUCING 45 Precious Metals Diversified ADVANCED 261 EXPLORATION 419 Assets
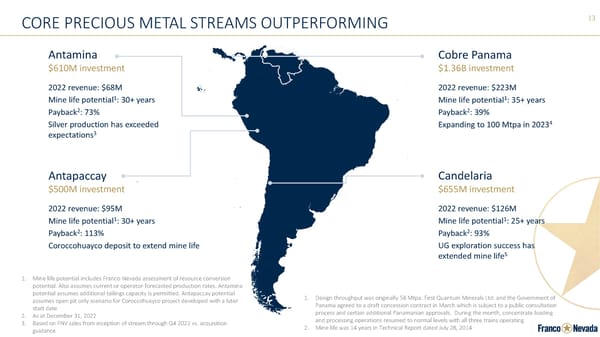
13 CORE PRECIOUS METAL STREAMS OUTPERFORMING Antamina $610M investment 2022 revenue: $68M Mine life potential1: 30+ years Payback2: 73% Silver production has exceeded expectations3 Cobre Panama $1.36B investment 2022 revenue: $223M Mine life potential1: 35+ years Payback2: 39% Expanding to 100 Mtpa in 20234 Antapaccay $500M investment 2022 revenue: $95M Mine life potential1: 30+ years Payback2: 113% Coroccohuayco deposit to extend mine life Candelaria $655M investment 2022 revenue: $126M Mine life potential1: 25+ years Payback2: 93% UG exploration success has extended mine life5 1. Mine life potential includes Franco-Nevada assessment of resource conversion potential. Also assumes current or operator-forecasted production rates. Antamina potential assumes additional tailings capacity is permitted. Antapaccay potential assumes open pit only scenario for Coroccohuayco project developed with a later start date 2. As at December 31, 2022 3. Based on FNV sales from inception of stream through Q4 2022 vs. acquisition guidance 1. Design throughput was originally 58 Mtpa. First Quantum Minerals Ltd. and the Government of Panama agreed to a draft concession contract in March which is subject to a public consultation process and certain additional Panamanian approvals. During the month, concentrate loading and processing operations resumed to normal levels with all three trains operating 2. Mine life was 14 years in Technical Report dated July 28, 2014
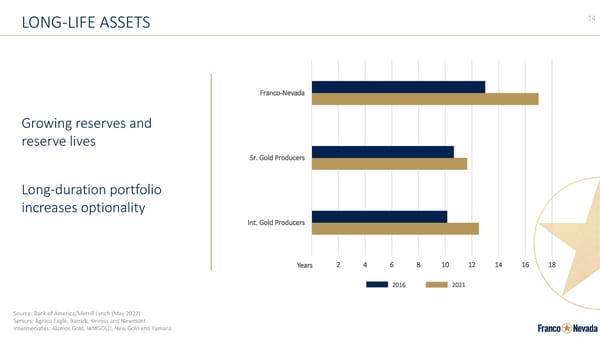
14 0 2 4 6 8 10 12 14 16 18 Int. Gold Producers Sr. Gold Producers Franco-Nevada Years LONG-LIFE ASSETS Growing reserves and reserve lives Long-duration portfolio increases optionality Source: Bank of America/Merrill Lynch (May 2022) Seniors: Agnico Eagle, Barrick, Kinross and Newmont Intermediates: Alamos Gold, IAMGOLD, New Gold and Yamana 2016 2021
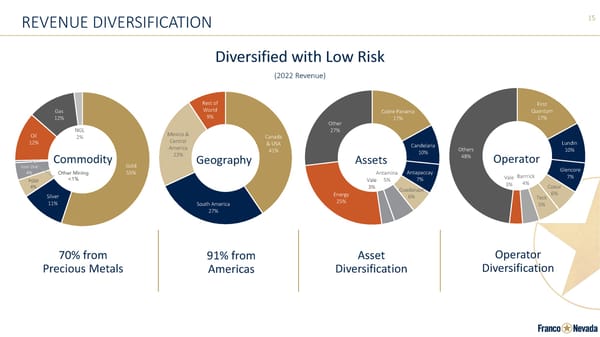
15 First Quantum 17% Lundin 10% Glencore 7% Coeur 6% Teck 5% Barrrick 4% Vale 3% Others 48% Operator Canada & USA 41% South America 27% Mexico & Central America 23% Rest of World 9% Geography REVENUE DIVERSIFICATION Asset Diversification 70% from Precious Metals 91% from Americas Operator Diversification Gold 55% Silver 11% PGM 4% Iron Ore 4% Oil 12% Gas 12% NGL 2% Commodity Cobre Panama 17% Candelaria 10% Antapaccay 7% Guadalupe 6% Antamina 5% Vale 3% Energy 25% Other 27% Assets Diversified with Low Risk (2022 Revenue)
16 ROYALTY OPTIONALITY IPO $1.2B paid for portfolio Reserves increase at no cost 2007 2022 2008 - 2022 - 20 40 60 80 100 120 Proven & Probable Mineral Reserves (Moz) >45 Moz gold produced Gold Reserves2 at time of IPO Gold Reserves2 of same assets as reported Dec. 2022 >$2.1B3 revenue to FNV from portfolio 1. Calculation includes depletion 2. Total gold reserves associated with the top 37 assets at the time of IPO (not adjusted for FNV royalty ownership). All Mineral Reserves have been calculated in accordance with CIM or acceptable foreign codes for the purposes of NI 43-101, including Regulation S-K 1300, SEC Industry Guide 7, JORC, or SAMREC guidelines 3. Revenue from original FNV portfolio includes gold, platinum and palladium revenue as at December 31, 2022 >3x increase1
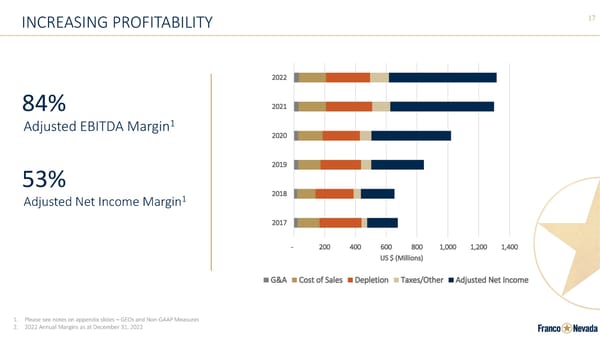
17 INCREASING PROFITABILITY Adjusted EBITDA Margin1 1. Please see notes on appendix slides – GEOs and Non-GAAP Measures 2. 2022 Annual Margins as at December 31, 2022 84% Adjusted Net Income Margin1 53% - 200 400 600 800 1,000 1,200 1,400 2017 2018 2019 2020 2021 2022 US $ (Millions) G&A Cost of Sales Depletion Taxes/Other Adjusted Net Income
Track Record
19 TRACK RECORD GEOs1 (000’s) Revenue (US$ Millions) G&A (% of Capitalization) Adjusted EBITDA3 (US$ Millions) Adjusted Net Income per Share3 (US$ per Share) 1. Starting in Q4 2021, revenue from Franco-Nevada’s Energy assets are included in the calculation of GEOs. GEOs for comparative periods have been recalculated to conform with the current presentation. For further details, please refer to the appendix at the end of this presentation on GEOs and Non-GAAP Measures 2. Market Capitalization as of December 31 of each year 3. Please refer to the appendix at the end of this presentation on GEOs and Non-GAAP Measures - 100 200 300 400 500 600 700 800 '08 '09 '10 '11 '12 '13 '14 '15 '16 '17 '18 '19 '20 '21 '22 - 200 400 600 800 1,000 1,200 1,400 '08 '09 '10 '11 '12 '13 '14 '15 '16 '17 '18 '19 '20 '21 '22 0.0% 0.2% 0.4% 0.6% 0.8% 1.0% '08 '09 '10 '11 '12 '13 '14 '15 '16 '17 '18 '19 '20 '21 '22 - 0.50 1.00 1.50 2.00 2.50 3.00 3.50 4.00 '08 '09 '10 '11 '12 '13 '14 '15 '16 '17 '18 '19 '20 '21 '22 - 200 400 600 800 1,000 1,200 '08 '09 '10 '11 '12 '13 '14 '15 '16 '17 '18 '19 '20 '21 '22 Market Capitalization2 (US$ Billions) - 5 10 15 20 25 30 '08 '09 '10 '11 '12 '13 '14 '15 '16 '17 '18 '19 '20 '21 '22
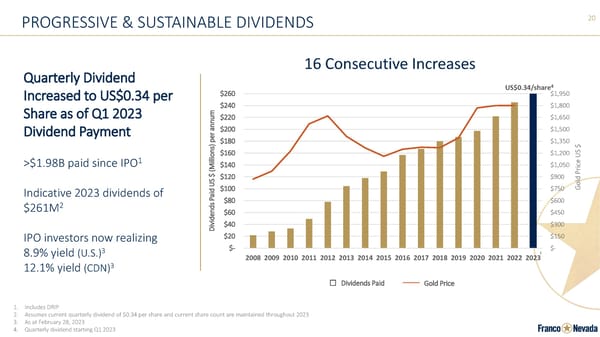
20 PROGRESSIVE & SUSTAINABLE DIVIDENDS $- $150 $300 $450 $600 $750 $900 $1,050 $1,200 $1,350 $1,500 $1,650 $1,800 $1,950 $- $20 $40 $60 $80 $100 $120 $140 $160 $180 $200 $220 $240 $260 2008 2009 2010 2011 2012 2013 2014 2015 2016 2017 2018 2019 2020 2021 2022 2023 Gold Price US $ Dividends Paid US $ (Millions) per annum 2 Dividends Paid Gold Price Quarterly Dividend Increased to US$0.34 per Share as of Q1 2023 Dividend Payment >$1.98B paid since IPO1 Indicative 2023 dividends of $261M2 IPO investors now realizing 8.9% yield (U.S.)3 12.1% yield (CDN)3 1. Includes DRIP 2. Assumes current quarterly dividend of $0.34 per share and current share count are maintained throughout 2023 3. As at February 28, 2023 4. Quarterly dividend starting Q1 2023 16 Consecutive Increases US$0.34/share4
21 OUTPERFORMING BULL & BEAR MARKETS Franco-Nevada (US$) Gold GDX1 1. GDX is a Gold Equity index comprised mostly of gold operating companies 2. Source: TD Securities; Bloomberg 3. All returns are as of March 31, 2023 4. Total returns are CAGRs and assume reinvestment of dividends over designated period 32% (6%) 19% 14% (14%) 8% 1% (33%) 14% (40%) (20%) – 20% 40% Bull Market (2008 - 2012) Bear Market (2013 - 2015) Bull Market (2016 - Present)
Growth Outlook
23 GUIDANCE Total GEOs 2022 Actual 2023 Guidance1 2027 Outlook2 729,960 + Record GEOs in 2022 + Diversified guidance exceeded + Benefit of strong energy prices 640,000-700,000 – Assumes lower oil and gas prices1 + Vale royalty attributable production 760,000-820,000 Assumes flat commodity prices1 + Growth from Precious Metal assets + Vale royalty attributable production increase + Continued development of Energy assets + Copper World Precious Metal GEOs 2022 Actual 2023 Guidance1 2027 Outlook2 510,385 + Candelaria, Tasiast, Subika (Ahafo) – Cobre Panama due to timing of shipments – Antapaccay – Less favourable GEO conversion ratios for silver and PGMs 490,000-530,000 + Cobre Panama expansion2 + Antapaccay, MWS, Tasiast, Musselwhite + New mines: Magino, Séguéla, Salares Norte – Antamina, Hemlo, Candelaria 565,000-605,000 + Cobre Panama expansion2 + New mines: Tocantinzinho, Greenstone (Hardrock), Valentine Gold, Stibnite, Eskay Creek + Sudbury still producing – Candelaria step-down – MWS cap met in 2024 Funding Commitments Up to $250M for Tocantinzinho stream Up to $79M for Continental Royalty Acquisition Venture ($10-20M expected in FY 2023) Depletion Estimate $275-$305 million 1. Assuming the following prices: $1,800/oz Au, $21/oz Ag, $900/oz Pt, $1,500/oz Pd, $120/tonne Fe 62% CFR China, $80/bbl WTI oil and $3/mcf Henry Hub natural gas 2. First Quantum Minerals Ltd. and the Government of Panama agreed to a draft concession contract in March which is subject to a public consultation process and certain additional Panamanian approvals. During the month, concentrate loading and processing operations resumed to normal levels with all three trains operating
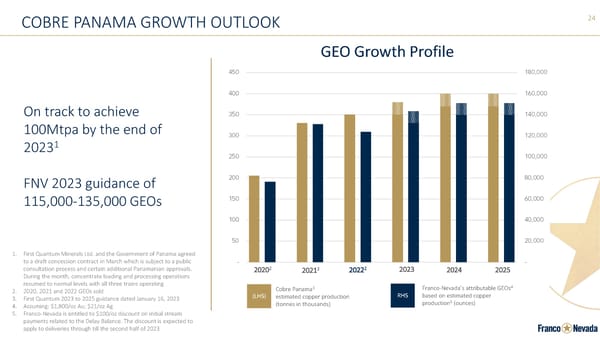
24 COBRE PANAMA GROWTH OUTLOOK GEO Growth Profile Cobre Panama3 estimated copper production (tonnes in thousands) Franco-Nevada’s attributable GEOs4 based on estimated copper production5 (ounces) 1. First Quantum Minerals Ltd. and the Government of Panama agreed to a draft concession contract in March which is subject to a public consultation process and certain additional Panamanian approvals. During the month, concentrate loading and processing operations resumed to normal levels with all three trains operating 2. 2020, 2021 and 2022 GEOs sold 3. First Quantum 2023 to 2025 guidance dated January 16, 2023 4. Assuming: $1,800/oz Au; $21/oz Ag 5. Franco-Nevada is entitled to $100/oz discount on initial stream payments related to the Delay Balance. The discount is expected to apply to deliveries through till the second half of 2023 On track to achieve 100Mtpa by the end of 20231 FNV 2023 guidance of 115,000-135,000 GEOs 20202 20222 2023 20212 2025 2024
25 ORGANIC GROWTH PIPELINE Expansions1 2023 2024 2025 2026 2027 Q1 Q2 Q3 Q4 Q1 Q2 Q3 Q4 Q1 Q2 Q3 Q4 Q1 Q2 Q3 Q4 Q1 Q2 Q3 Q4 Cobre Panama2 Panama Subika Ghana Tasiast Mauritania Vale Brazil Detour Lake Ontario Kirkland Lake Ontario Island Gold Ontario Stillwater Montana New Mines Est. Start3 Q1 Q2 Q3 Q4 Q1 Q2 Q3 Q4 Q1 Q2 Q3 Q4 Q1 Q2 Q3 Q4 Q1 Q2 Q3 Q4 Magino Ontario Séguéla Côte d'Ivoire Salares Norte Chile Yandal/Bronzewing Australia Greenstone Ontario Posse (Mara Rosa) Brazil Tocantinzinho Brazil Valentine Gold Newfoundland Eskay Creek British Columbia Stibnite Gold Idaho Copper World Arizona 1. Expansion periods are based on operators’ indicated period of ramp-up 2. First Quantum Minerals Ltd. and the Government of Panama agreed to a draft concession contract in March which is subject to a public consultation process and certain additional Panamanian approvals. During the month, concentrate loading and processing operations resumed to normal levels with all three trains operating 3. Indicated start periods are based on operators’ guidance and FNV best estimates
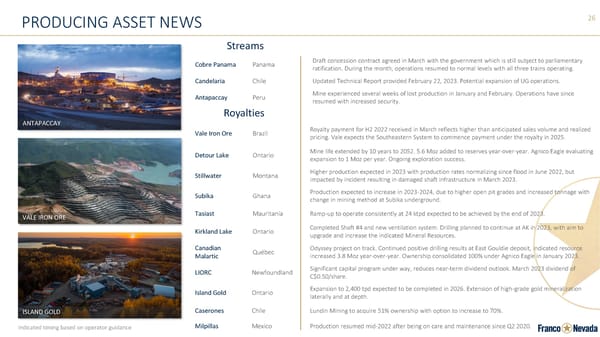
26 PRODUCING ASSET NEWS ANTAPACCAY VALE IRON ORE Royalties Vale Iron Ore Brazil Royalty payment for H2 2022 received in March reflects higher than anticipated sales volume and realized pricing. Vale expects the Southeastern System to commence payment under the royalty in 2025. Detour Lake Ontario Mine life extended by 10 years to 2052. 5.6 Moz added to reserves year-over-year. Agnico Eagle evaluating expansion to 1 Moz per year. Ongoing exploration success. Stillwater Montana Higher production expected in 2023 with production rates normalizing since flood in June 2022, but impacted by incident resulting in damaged shaft infrastructure in March 2023. Subika Ghana Production expected to increase in 2023-2024, due to higher open pit grades and increased tonnage with change in mining method at Subika underground. Tasiast Mauritania Ramp-up to operate consistently at 24 ktpd expected to be achieved by the end of 2023. Kirkland Lake Ontario Completed Shaft #4 and new ventilation system. Drilling planned to continue at AK in 2023, with aim to upgrade and increase the indicated Mineral Resources. Canadian Malartic Québec Odyssey project on track. Continued positive drilling results at East Gouldie deposit, indicated resource increased 3.8 Moz year-over-year. Ownership consolidated 100% under Agnico Eagle in January 2023. LIORC Newfoundland Significant capital program under way, reduces near-term dividend outlook. March 2023 dividend of C$0.50/share. Island Gold Ontario Expansion to 2,400 tpd expected to be completed in 2026. Extension of high-grade gold mineralization laterally and at depth. Caserones Chile Lundin Mining to acquire 51% ownership with option to increase to 70%. Milpillas Mexico Production resumed mid-2022 after being on care and maintenance since Q2 2020. Streams Cobre Panama Panama Draft concession contract agreed in March with the government which is still subject to parliamentary ratification. During the month, operations resumed to normal levels with all three trains operating. Candelaria Chile Updated Technical Report provided February 22, 2023. Potential expansion of UG operations. Antapaccay Peru Mine experienced several weeks of lost production in January and February. Operations have since resumed with increased security. ISLAND GOLD Indicated timing based on operator guidance
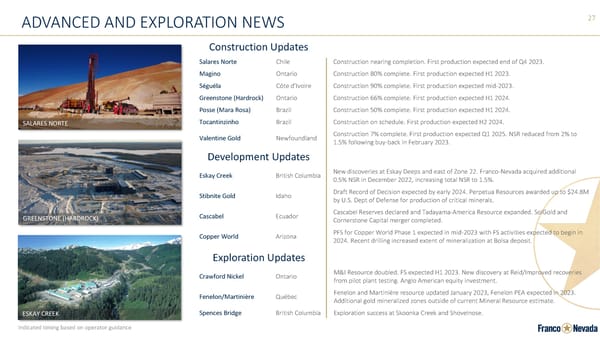
27 ESKAY CREEK ADVANCED AND EXPLORATION NEWS Development Updates Eskay Creek British Columbia New discoveries at Eskay Deeps and east of Zone 22. Franco-Nevada acquired additional 0.5% NSR in December 2022, increasing total NSR to 1.5%. Stibnite Gold Idaho Draft Record of Decision expected by early 2024. Perpetua Resources awarded up to $24.8M by U.S. Dept of Defense for production of critical minerals. Cascabel Ecuador Cascabel Reserves declared and Tadayama-America Resource expanded. SolGold and Cornerstone Capital merger completed. Copper World Arizona PFS for Copper World Phase 1 expected in mid-2023 with FS activities expected to begin in 2024. Recent drilling increased extent of mineralization at Bolsa deposit. Construction Updates Salares Norte Chile Construction nearing completion. First production expected end of Q4 2023. Magino Ontario Construction 80% complete. First production expected H1 2023. Séguéla Côte d’Ivoire Construction 90% complete. First production expected mid-2023. Greenstone (Hardrock) Ontario Construction 66% complete. First production expected H1 2024. Posse (Mara Rosa) Brazil Construction 50% complete. First production expected H1 2024. Tocantinzinho Brazil Construction on schedule. First production expected H2 2024. Valentine Gold Newfoundland Construction 7% complete. First production expected Q1 2025. NSR reduced from 2% to 1.5% following buy-back in February 2023. Exploration Updates Crawford Nickel Ontario M&I Resource doubled. FS expected H1 2023. New discovery at Reid/Improved recoveries from pilot plant testing. Anglo American equity investment. Fenelon/Martinière Québec Fenelon and Martinière resource updated January 2023, Fenelon PEA expected in 2023. Additional gold mineralized zones outside of current Mineral Resource estimate. Spences Bridge British Columbia Exploration success at Skoonka Creek and Shovelnose. GREENSTONE (HARDROCK) SALARES NORTE Indicated timing based on operator guidance
28 LONG-TERM OPTIONALITY 2.9Moz of total 18.6Moz M&I Royalty Ounces1 are from long-term assets • Not included in 5-year outlook2 Exposure to large gold, copper and nickel deposits Additional potential from 17 Advanced and 224 Exploration Assets 1. For calculation of M&I Royalty Ounces refer to Franco-Nevada 2022 Asset Handbook published in April 2022 2. 5-year Outlook (2027) as published on March 15, 2023 2.9 Moz Cascabel (Cu, Au, Ag) Taca Taca (Cu, Au) NuevaUnión (Cu, Au) Crawford (Ni) Pandora Expansion (PGM) Ring of Fire (Cr, Ni) Holt (Au) Other Long-Term Assets
29 AVAILABLE CAPITAL 1. As at December 31, 2022 2. $1B Corporate Revolver 3. Funding commitments subsequent to December 31, 2022 will be funded with cash flow from operations NUEVAUNIÓN (RELINCHO)
30 BOARD AND MANAGEMENT David Harquail Chair of the Board Tom Albanese Former CEO Rio Tinto Derek Evans CEO MEG Energy Louis Gignac Chair G Mining Ventures Maureen Jensen Former CEO Ontario Securities Commission Jennifer Maki Former CEO Vale Canada Randall Oliphant Former CEO Barrick Gold Jacques Perron Former CEO Pretium Resources Inc Board Dr. Catharine Farrow Former CEO TMAC Resources Elliott Pew Former Chair EnerPlus Paul Brink President & CEO Board Director Sandip Rana CFO Lloyd Hong CLO Jason O’Connell SVP, Diversified Eaun Gray SVP, Business Development Management
www.FRANCO-NEVADA.com TSX: FNV | NYSE: FNV T H A N K Y O U F O R Y O U R I N T E R E S T I N
32 (expressed in millions, except per share amounts) For the three months ended December 31, For the year ended December 31, 2022 2021 2022 2021 Adjusted Net Income $ 164.9 163.7 $ 697.6 673.6 Revenue 320.4 327.7 1,315.7 1,300.0 Adjusted Net Income Margin 51.5% 50.0% 53.0% 51.8% APPENDIX – GEOS AND NON-GAAP MEASURES 1. Starting in Q4 2021, revenue from Franco-Nevada’s Energy assets is included in the calculation of GEOs. GEOs for comparative periods have been recalculated to conform with the current presentation. GEOs include Franco- Nevada’s attributable share of production from our Mining and Energy assets, after applicable recovery and payability factors. GEOs are estimated on a gross basis for NSR royalties and, in the case of stream ounces, before the payment of the per ounce contractual price paid by the Company. For NPI royalties, GEOs are calculated taking into account the NPI economics. Silver, platinum, palladium, iron ore, oil, gas and other commodities are converted to GEOs by dividing associated revenue, which includes settlement adjustments, by the relevant gold price. The price used in the computation of GEOs earned from a particular asset varies depending on the royalty or stream agreement, which may make reference to the market price realized by the operator, or the average price for the month, quarter, or year in which the commodity was produced or sold. 2. Non-GAAP financial measures: Cash Costs, Cash Costs per GEO sold, Adjusted Net Income, Adjusted Net Income per Share, Adjusted Net Income Margin, Adjusted EBITDA, Adjusted EBITDA per share, and Adjusted EBITDA Margin are non-GAAP financial measures with no standardized meaning under IFRS and might not be comparable to similar financial measures disclosed by other issuers. For a quantitative reconciliation of each non-GAAP financial measure to the most directly comparable IFRS financial measure, refer to the following tables. Further information relating to these Non-GAAP financial measures is incorporated by reference from the “Non-GAAP Financial Measures” section of Franco-Nevada’s MD&A for the three and nine months ended December 31, 2022 and filed on March 15, 2023 with the Canadian securities regulatory authorities on SEDAR available at www.sedar.com and with the U.S. Securities and Exchange Commission available on EDGAR at www.sec.gov. Starting in Q4 2021, revenue from Franco-Nevada’s Energy assets are included in the calculation of GEOs. Similarly, the composition of Cash Costs and Cash Costs per GEO sold has been amended to include costs and GEOs related to Franco-Nevada’s Energy assets. Cash Costs and Cash Costs per GEO sold for comparative periods have been recalculated to conform with current presentation.
33 ESG LEADERSHIP Responsible Capital Allocation Community Contributions Good Governance & Shareholder Alignment Fostering Diversity and Inclusion Transparent ESG Disclosure Our ESG Focus Responsible Capital Allocation Community Contributions Committed to WGC Responsible Gold Mining Principles UN Global Compact Participant Commitment to responsible mining and energy extraction through investments in operations with good labour, environmental and community practices Contributing to our communities and engaging with our operators to partner in community initiatives where our royalty and stream assets are located
34 ESG LEADERSHIP Fostering Diversity and Inclusion Transparent ESG Disclosure Pledge to alleviate systemic black racism Patron Sponsor Good Governance & Shareholder Alignment Established board and management team aligned with shareholders with substantial ownership of company and having low G&A costs Committed to furthering diversity and inclusion through the adoption of objective targets and ongoing sponsorships of diversity initiatives Our annual ESG Report is available on our website and is aligned with leading sustainability frameworks, including TCFD and SASB BOARD Independent Directors Women Directors 38% TARGET Board and Management Diverse Representation 40% by 2025 Board and Management own >$200M1 in stock Low G&A even when compared to Gold ETF fees 1. Based on March 31, 2023 closing price
35 CRA AUDIT (2012-2017) Taxation Years Reassessed Potential Income Tax Payable1 Potential Interest & Penalties1,4,5 Canadian Domestic Tax Matters 2014-2017 $14.6M (C$19.9M)2 $4.6M (C$6.2M) Transfer Pricing (Mexican Subsidiary) 2013-2016 $22.1M (C$29.9M)3 $20.1M (C$27.1M) Transfer Pricing (Barbadian Subsidiary) 2014-2017 $34.4M (C$46.5M) $24.3M (C$33.1M) Foreign Accrual Property Income (Barbadian Subsidiary) 2012-2013 $5.7M (C$7.7M) $2.8M (C$3.7M) Franco-Nevada does not believe that the reassessments are supported by Canadian tax law and jurisprudence and intends to vigorously defend its tax filing positions. 1. Canadian dollar amounts in this table have been converted to US dollars at the exchange rate applicable at December 31, 2022 as quoted by the Bank of Canada 2. Tax payable after applying available non-capital losses and other deductions 3. Tax payable before any double taxation relief under the Canada-Mexico tax treaty 4. Includes transfer pricing penalties: $9.5M (C$12.8M) for 2013-2015; $12.4M (C$16.8M) for 2016-2017 currently under review by the Canada Revenue Agency 5. Interest calculated to December 31, 2022